Flow over a backward facing step
OBJECTIVE : To simulate flow through Backward step for different grid size and investigate flow properties .
INTRODUCTION :
Flow through Backward face channel is very basic problem for Computation fluid dynamics and are interest of everyday life use.
PROCEDURE :
1. Creation of geometry
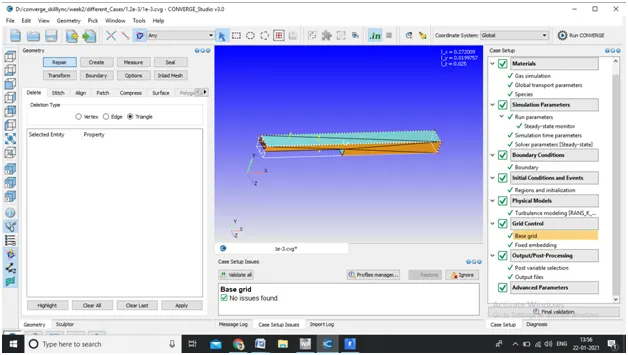
- Select point(x,y) according to length and create triangle by joining them and offset that plane to required plane and and again create triangle on lower and upper faces.
-
- Click on begin case set up select application type time based
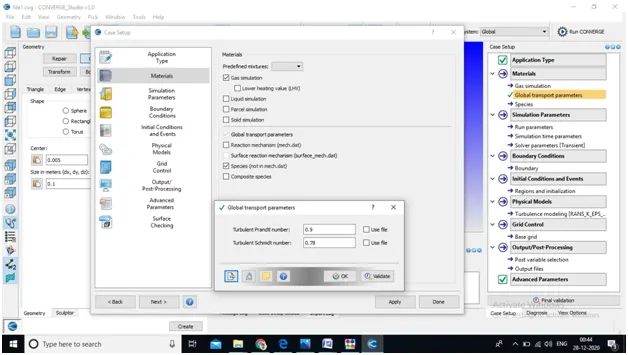
- Selection of material :
-
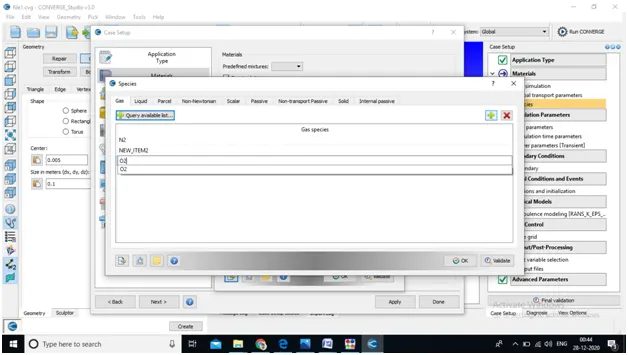
- Check on gas simulation & species, uncheck reaction simulation
3. solving parameter
-
- Select steady state solver , Full hydrodynamic and compressible flow
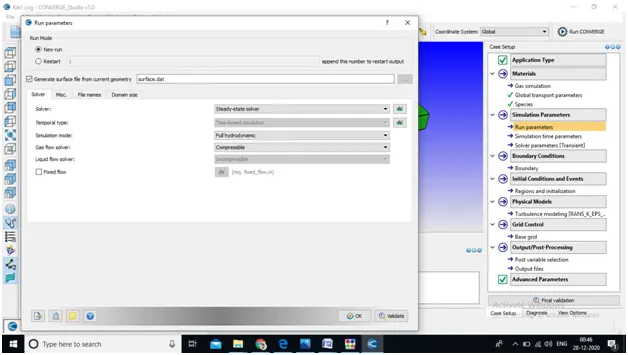
- In misc. uncheck used share memory and check monitor steady state
- In simulation time parameter provide values according to simulation
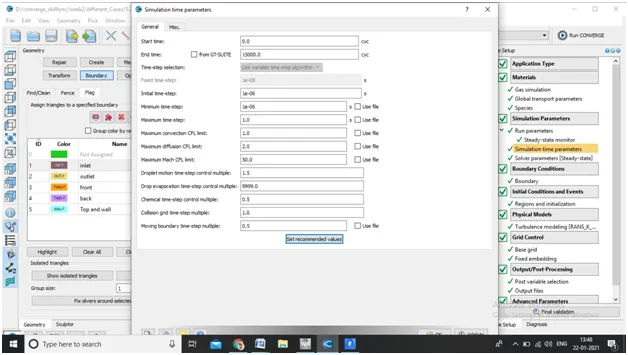
- Solver scheme select PISO solver keep other things same .
4. Assign Boundary at face and give bounadry condition.
- Select Triangle and select trianges on the faces ( I,e upper face in figure) and click on boundary and add boundry follow same procedure for others faces.
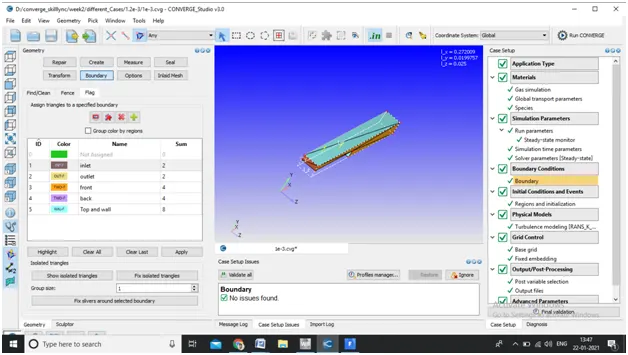
- Once give boundary condition create region & Name and give same region name to all boundaries that we have created
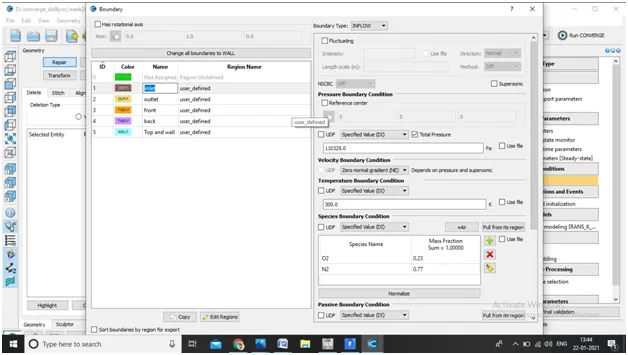
.Boundary Conditions :
1.Inlet
- Boundary type : INFLOW
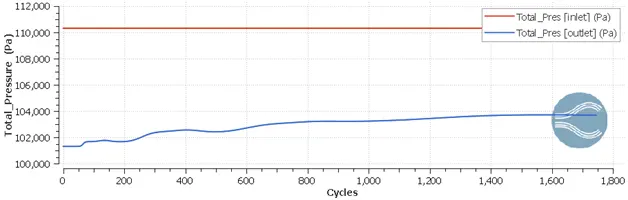
- Pressure : 110325 pa
- Temp :300 K
- Velocity :Zero Gradient
2. outlet
- Boundary type : OUTFLOW
- Pressure : 101325 pa
- Temp :300 K
- Velocity :Zero Normal Gradient
3. Top and bottom
- Boundary type : WALL
- Wall motion : Stationary & No-slip
4. Front and back
- Boundary type : 2D
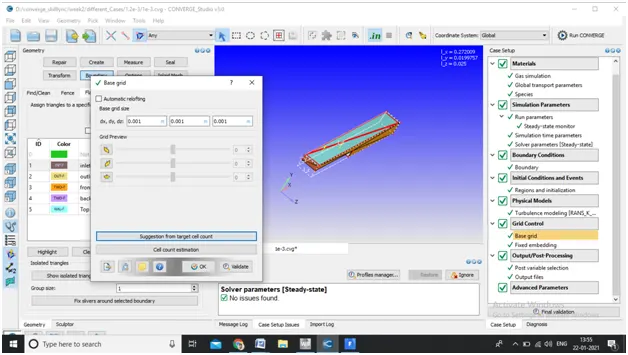
5. Meshing generation
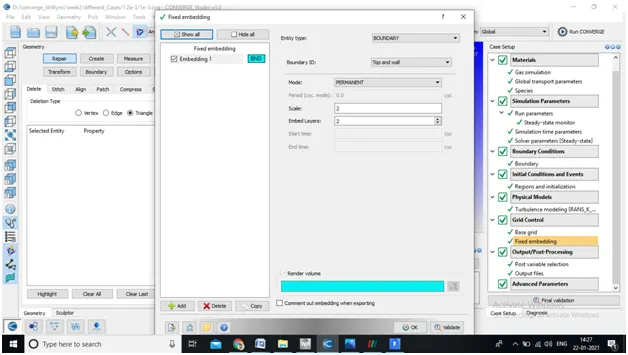
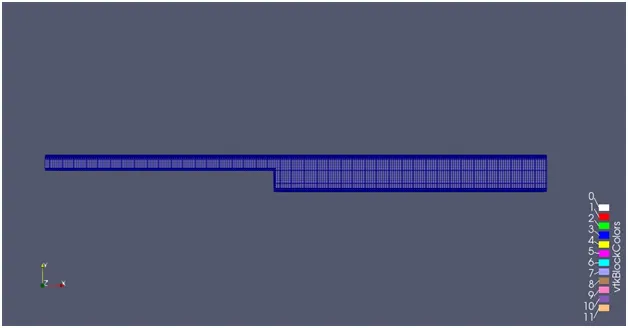
- Provide appropriate valued of mesh size as shown in figure
6 .Output post processing data
- Select the variable those which needs to post process.
- Provide Data for writing time interval according to simuation
Different case :
- Mesh size : 2e-3
- Mesh size : 1.5e-3
- Mesh size : 1e-3
RESULTS
1). Mesh size : 2e-3
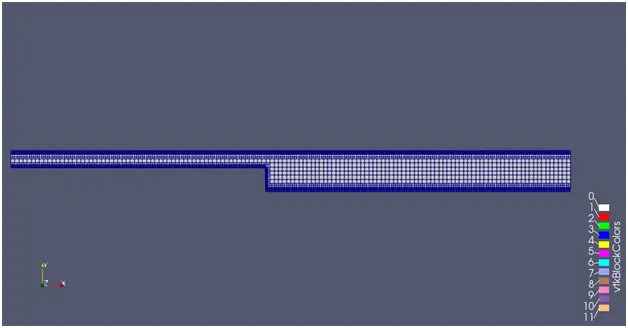
1). Cell count plot
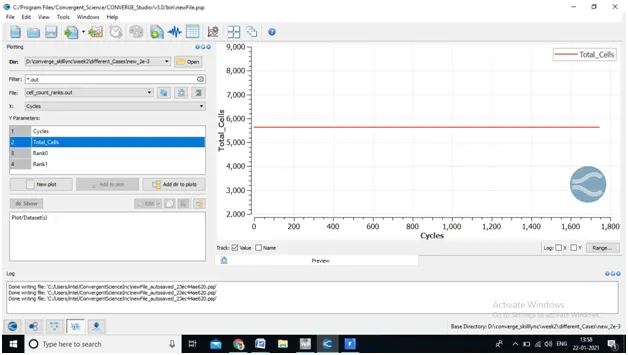
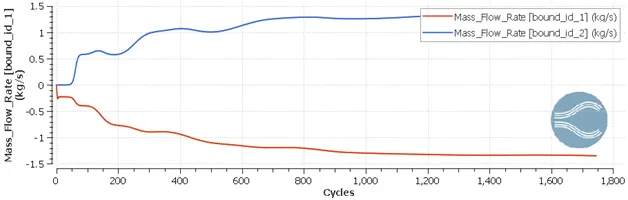
2). Mass flow rate plot at inlet & outlet
3). Total pressure plot at inlet & outlet
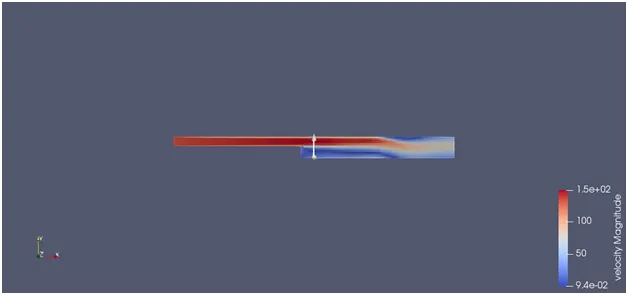
4). Velocity contour
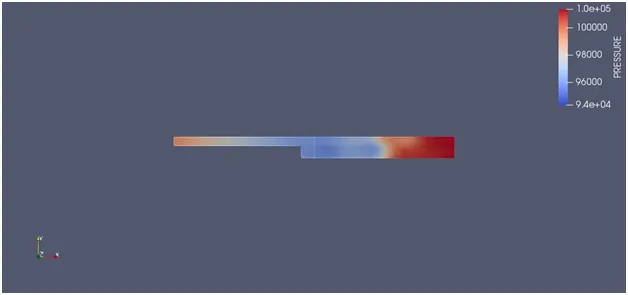
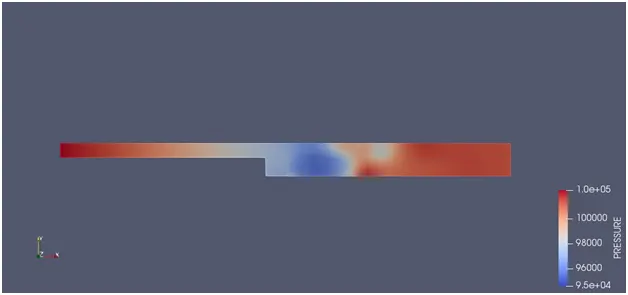
5). Pressure contour
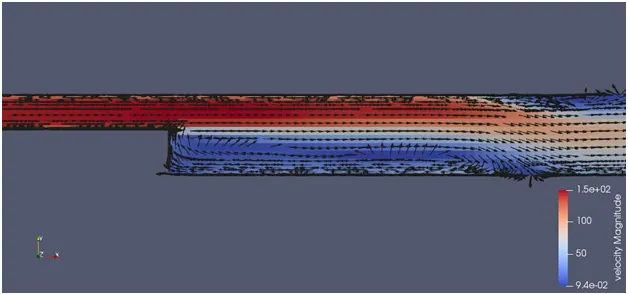
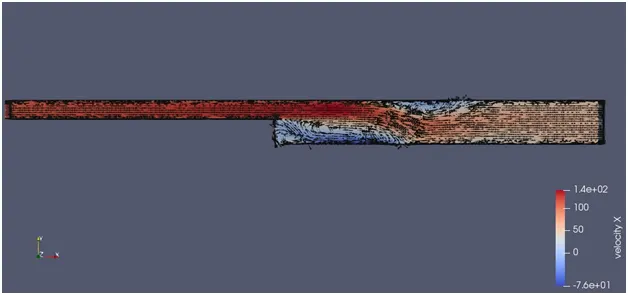
6).Velocity Vector plot
2). Mesh size : 1.5e-4
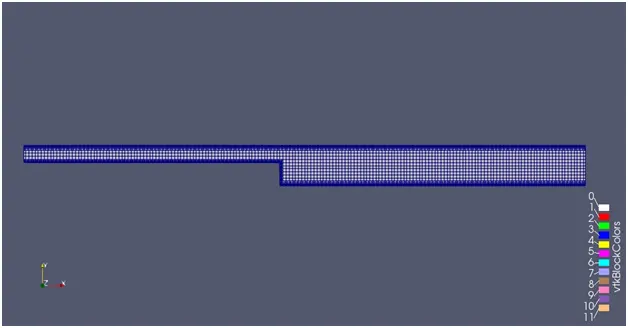
1 ). Cell count plot
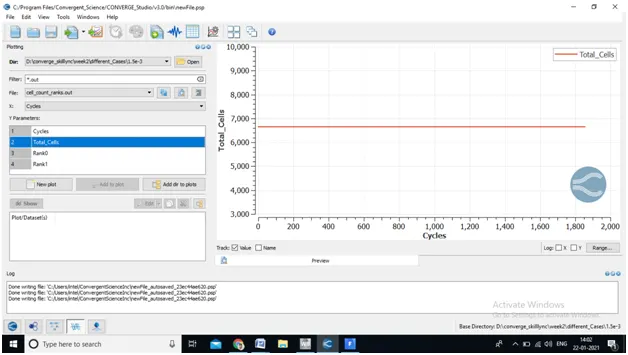
2). Mass flow rate plot at inlet & outlet
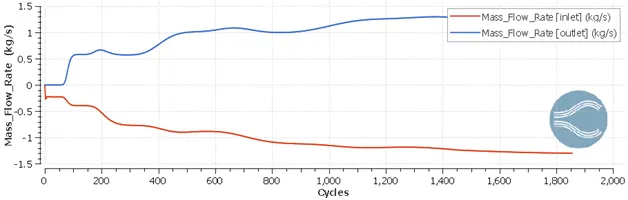
3). Total pressure plot at inlet & outlet
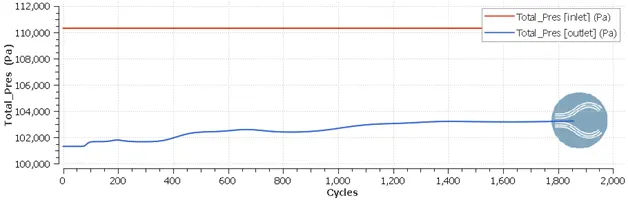
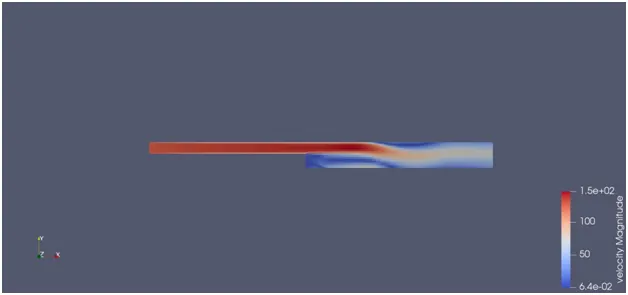
4). Velocity countour
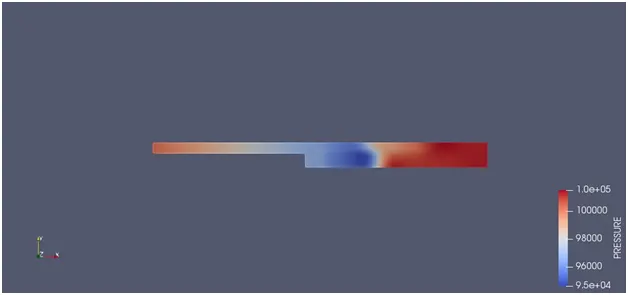
5).Pressure contour
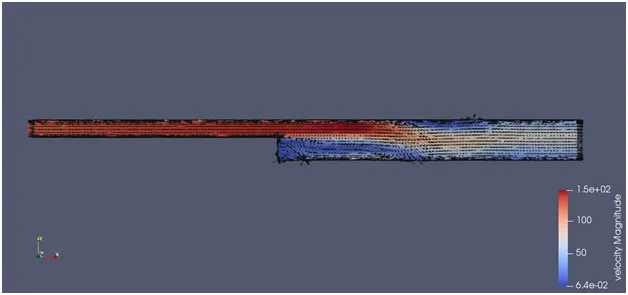
6).Velocity Vector plot
3). Mesh size : 1.2e-3
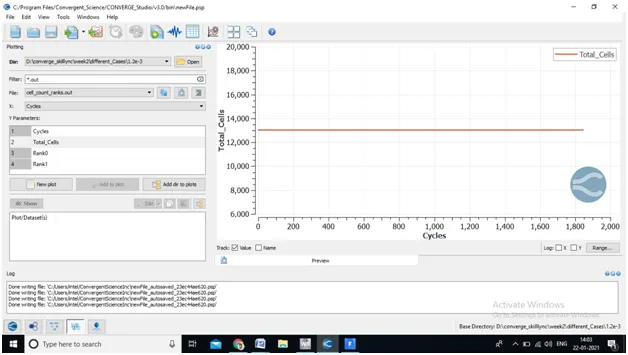
1 ). Cell count plot
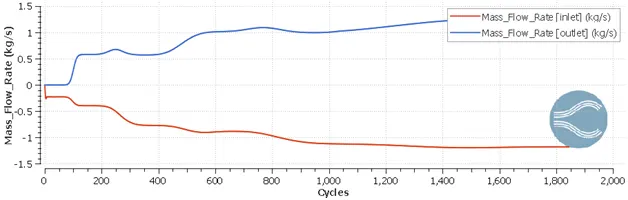
2). Mass flow rate plot at inlet & outlet
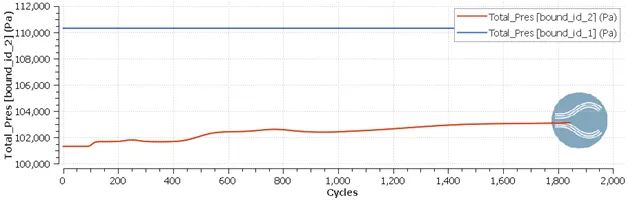
3). Total pressure plot at inlet & outlet
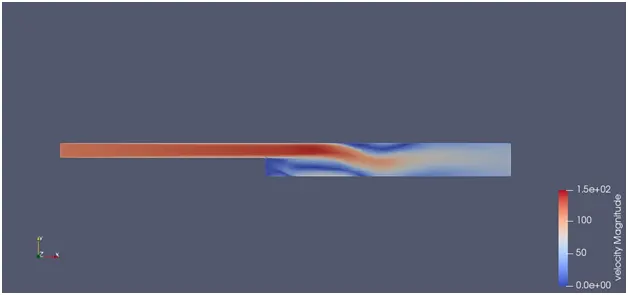
4). Velocity contour
5).Pressure contour
6).Velocity Vector plot
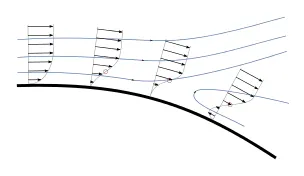
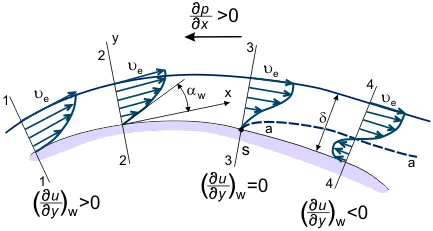
- Why Flow sepration occurred :
when fluid passes through body because of higher momentum in starting its find favourable pressure difference (dp/dx < 0) which causes fluid to flow in upstream but while flowing its continue loosing its momentum transfer due to viscosity of fluid and induced shear stress when momentum transfer is not capable to overcome friction force due to shear stress at that point velocity and pressure gradient can be seen as zero ( dp/dx=0 & dv/dx=0 ) point at which flow septares and as flow further move in upward direction because of positive pressure gradient (dp/dx > 0 ) due to that adverse pressure difference fluid start to flow back and produces vortex.
CONCLUSION :
- Flow through backward face successfully simulated for corase and fine mesh as above shown in figures
- As the Grid size decreses Cell count is increses and hence result become more accurates which can be shown from vector plot .
- while simulation to avoid fluctuation ( Divergence in solution ) max. c.f.L convection limit choose as 10 (As per simulation )
- Flow sepration is phenomena because of adverse pressure gradient at point as mentioned above.