RADIOSS Interfaces & Effect of Notches in Crashboxes
Part 1
Bumper assembly has geometric issues to be cleaned up first before meshing
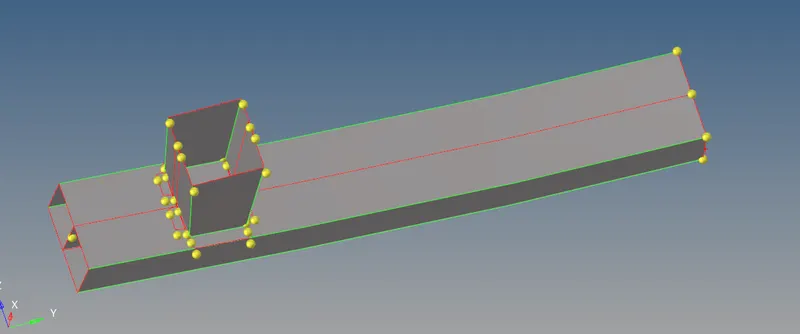
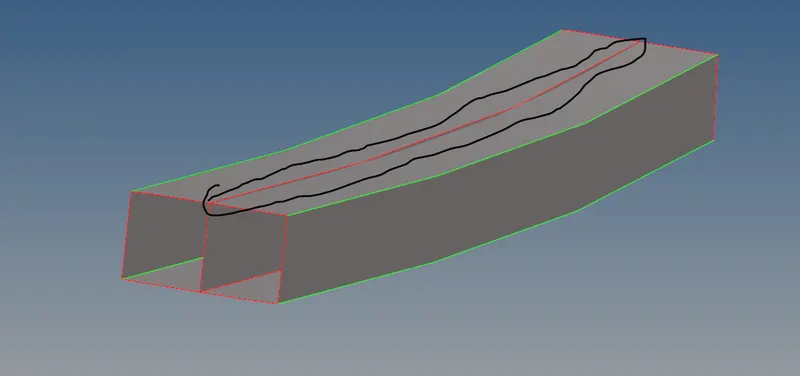
by surface extension midplate is extended to upper and lower plates
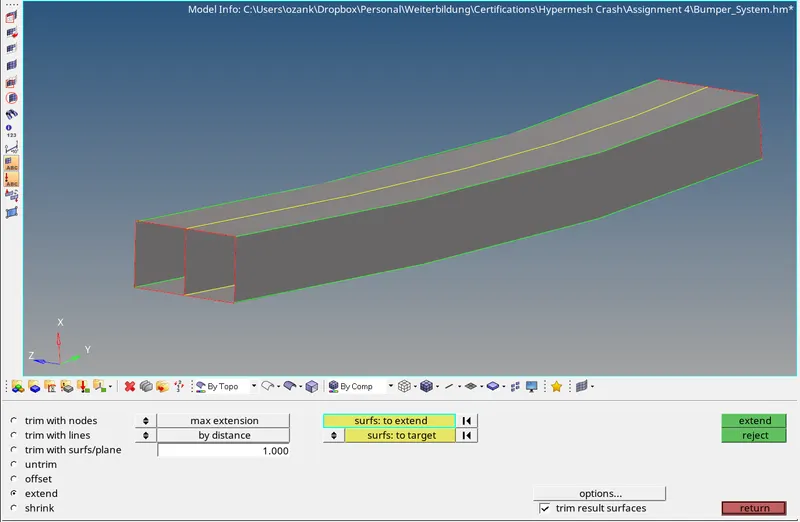
Some other geometric issues to be fixed
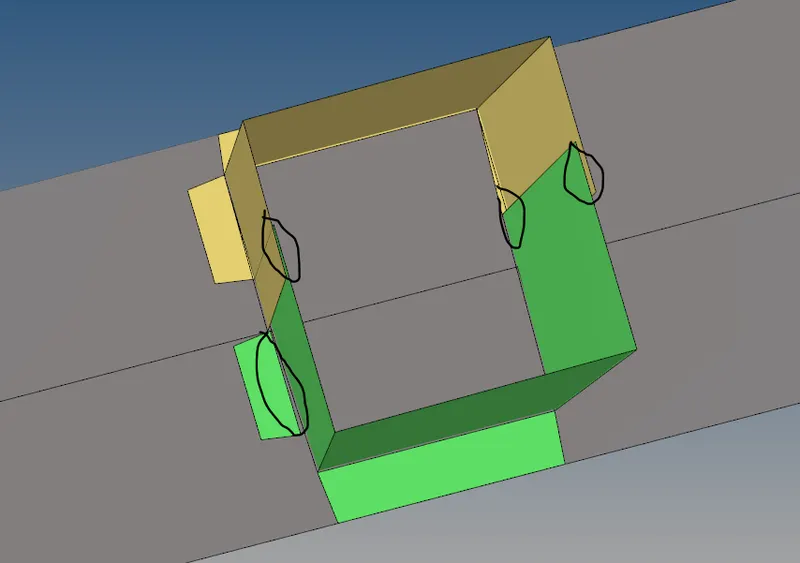
AFTER GEOMETRY CLEAN UP
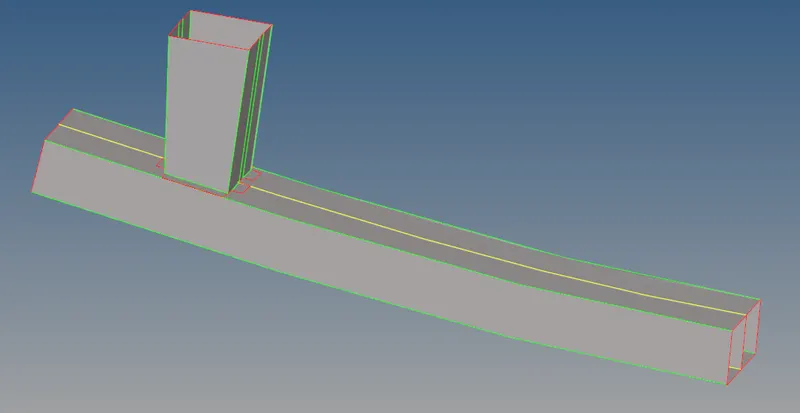
Meshing with 6mm
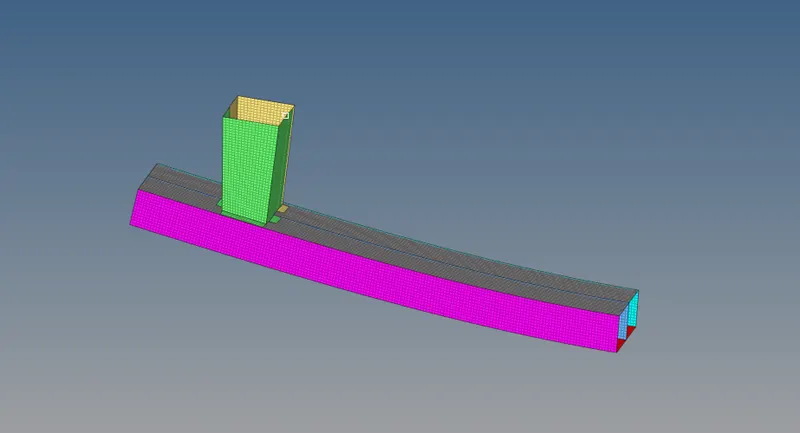
Free Edges on the geometry:
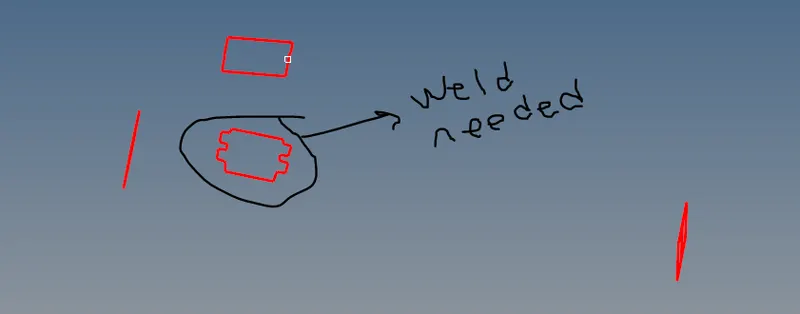
In the marked region weld connection is needed. not necessary for this assignment.
Part 2
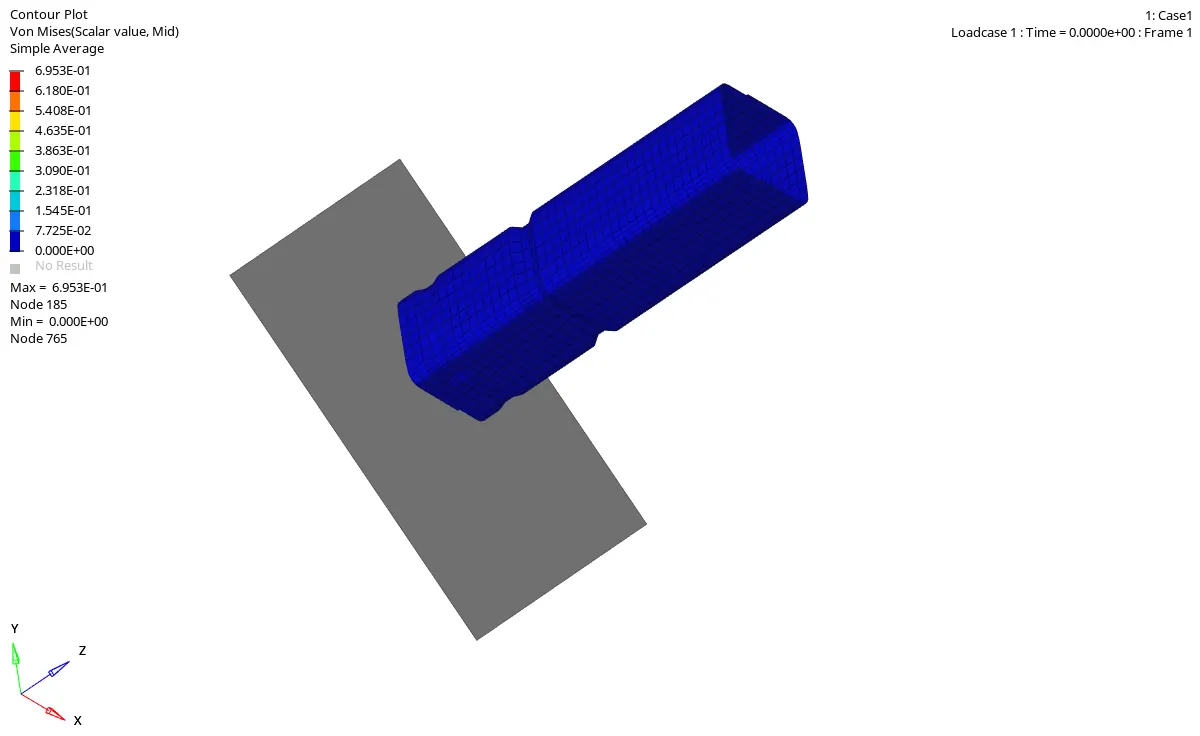
Case 1 :Run the crash tube model as it is.
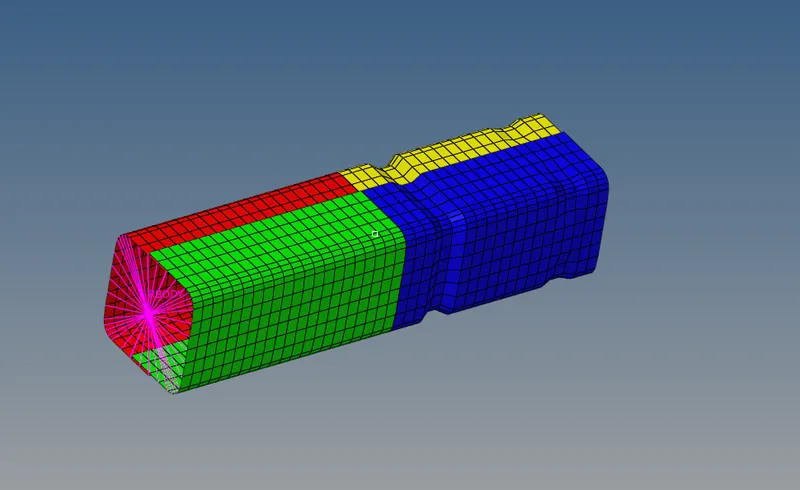
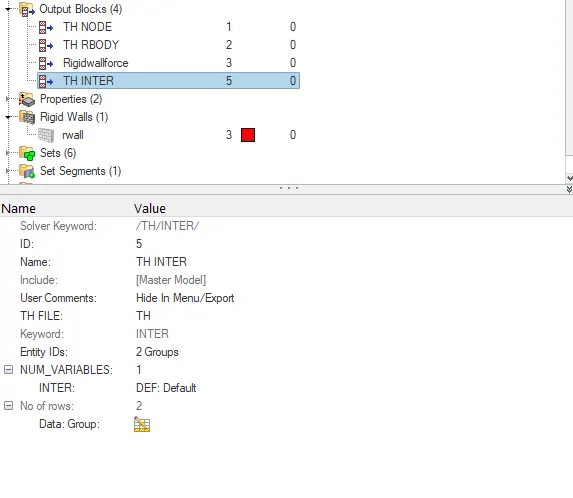
in order to see the self contact forces we need to arrange a history output for the self contact group.
Case 2:
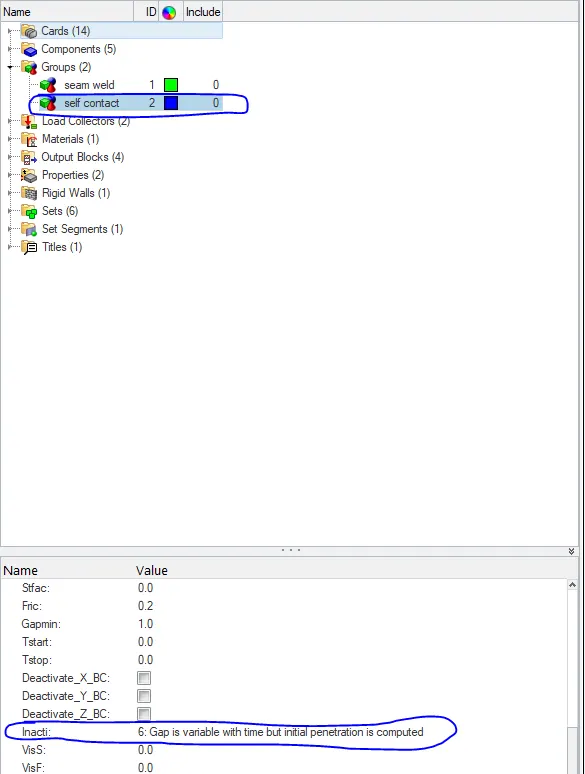
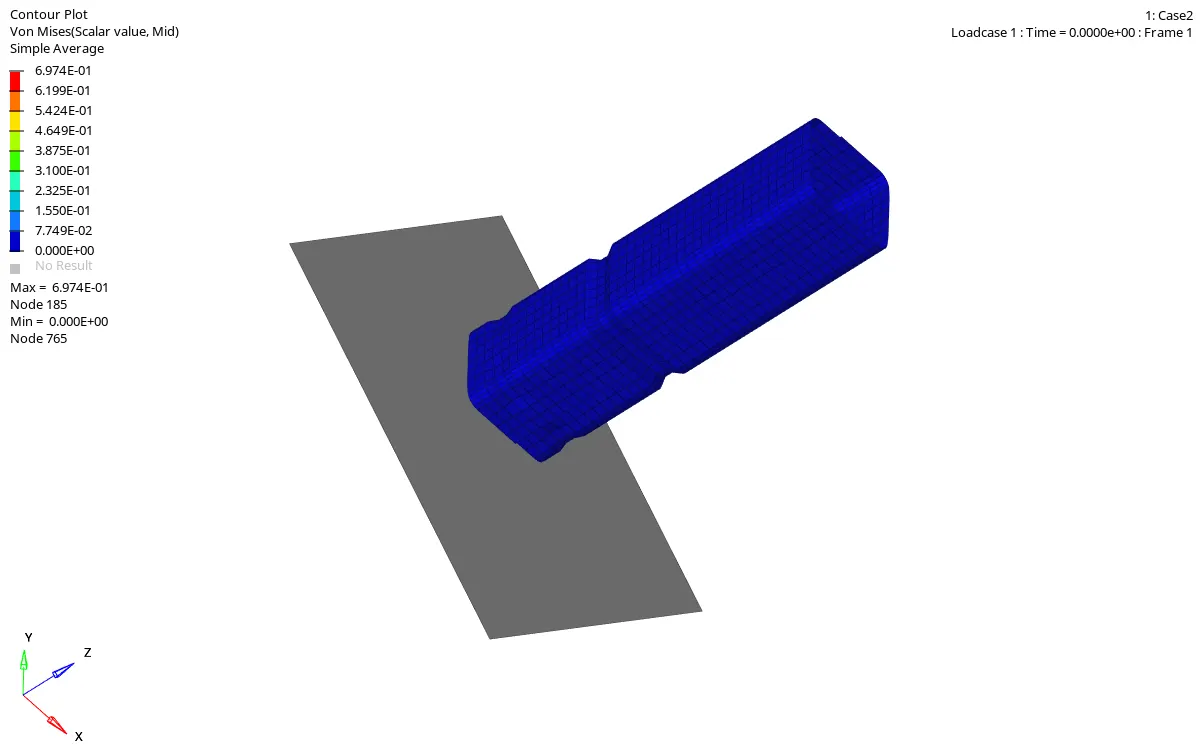
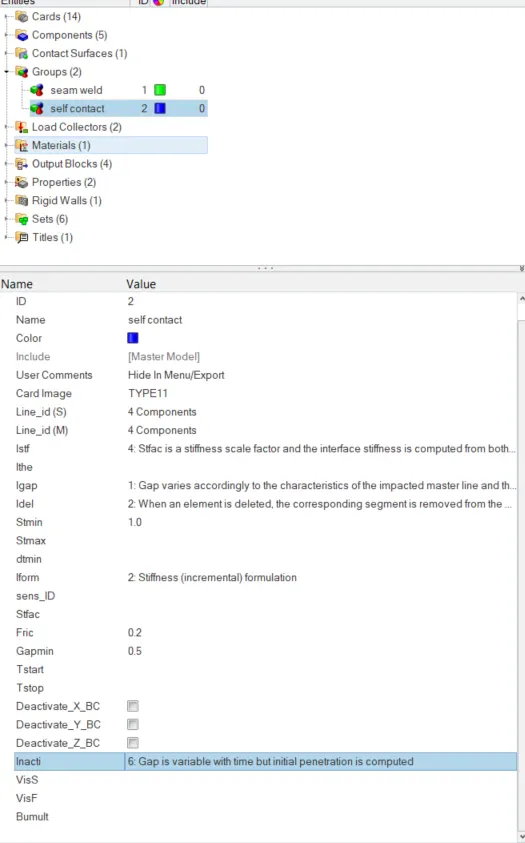
Changing the inacti to 6 and running the simulation again.
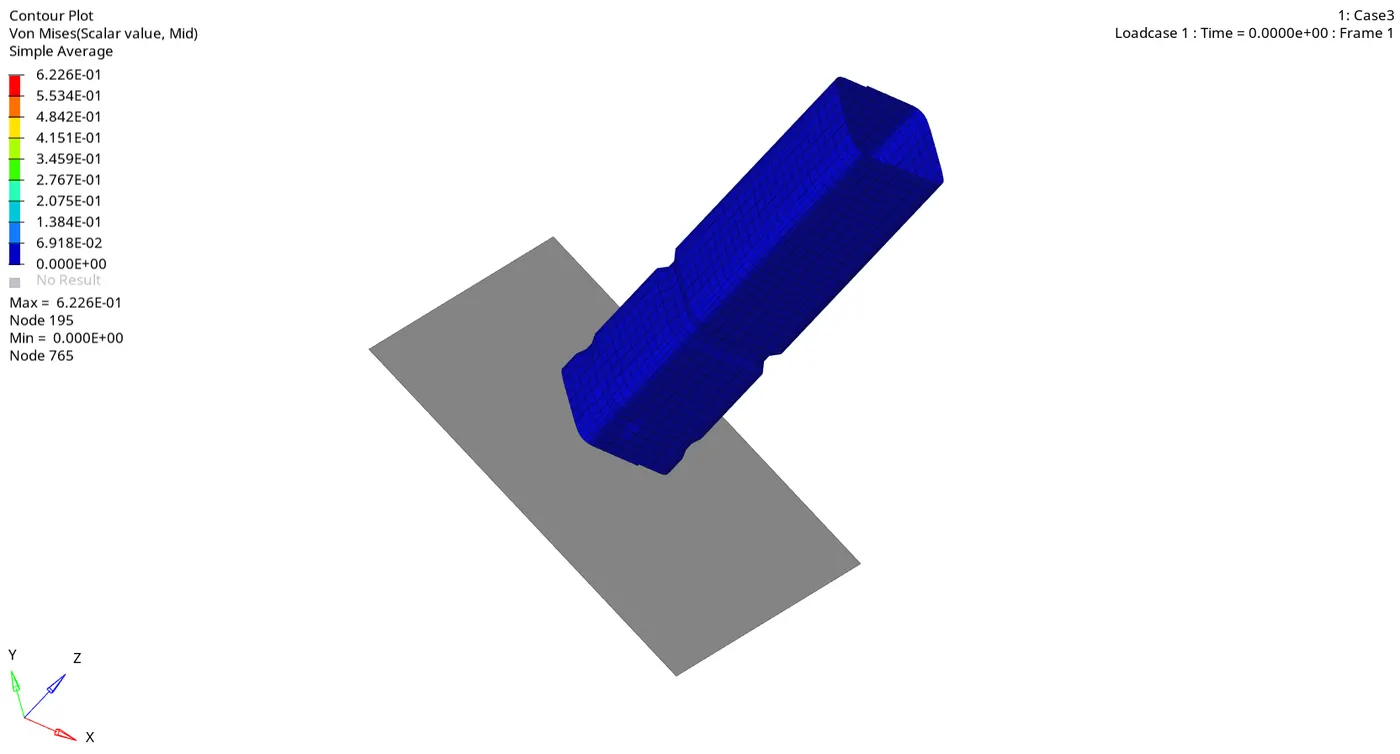
Case 3: Interface Type 11
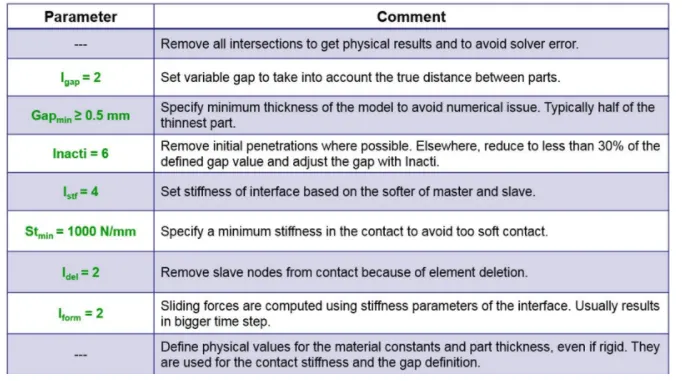
Recommended Parameter for Type 7 and 11 Interfaces
Case 4 :
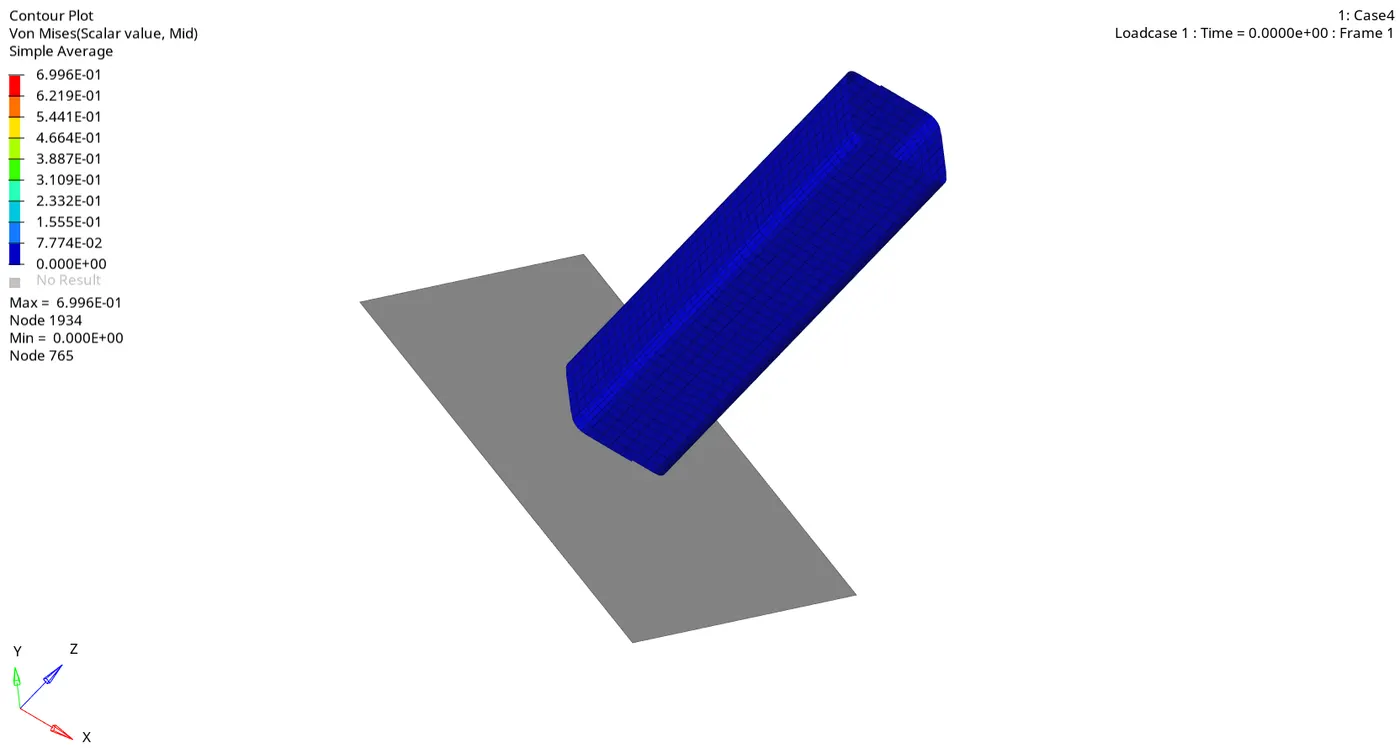
in this case we have to remove both notches and run the simulation again.
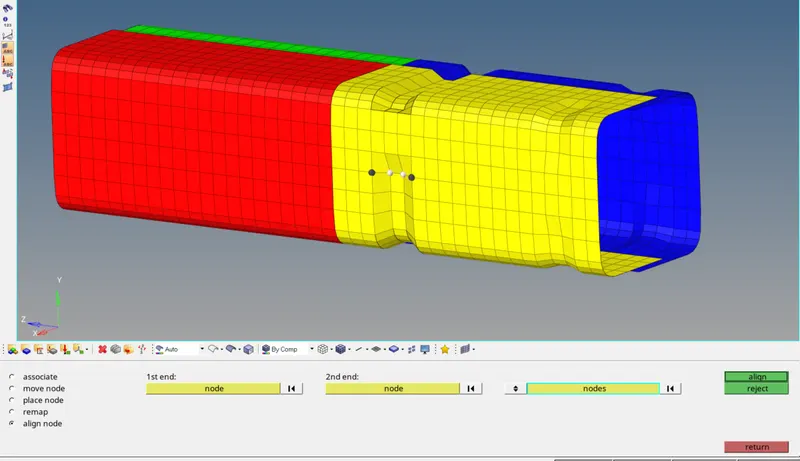
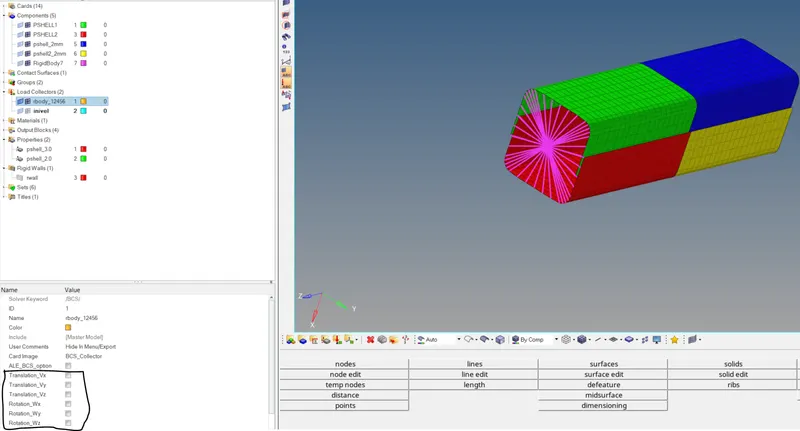
Notches are deleted and BC has been suppressed by givin degree of freedom in all directions
Case 5:
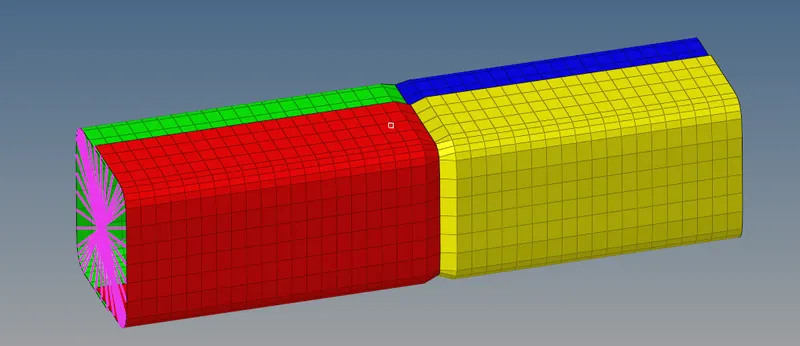
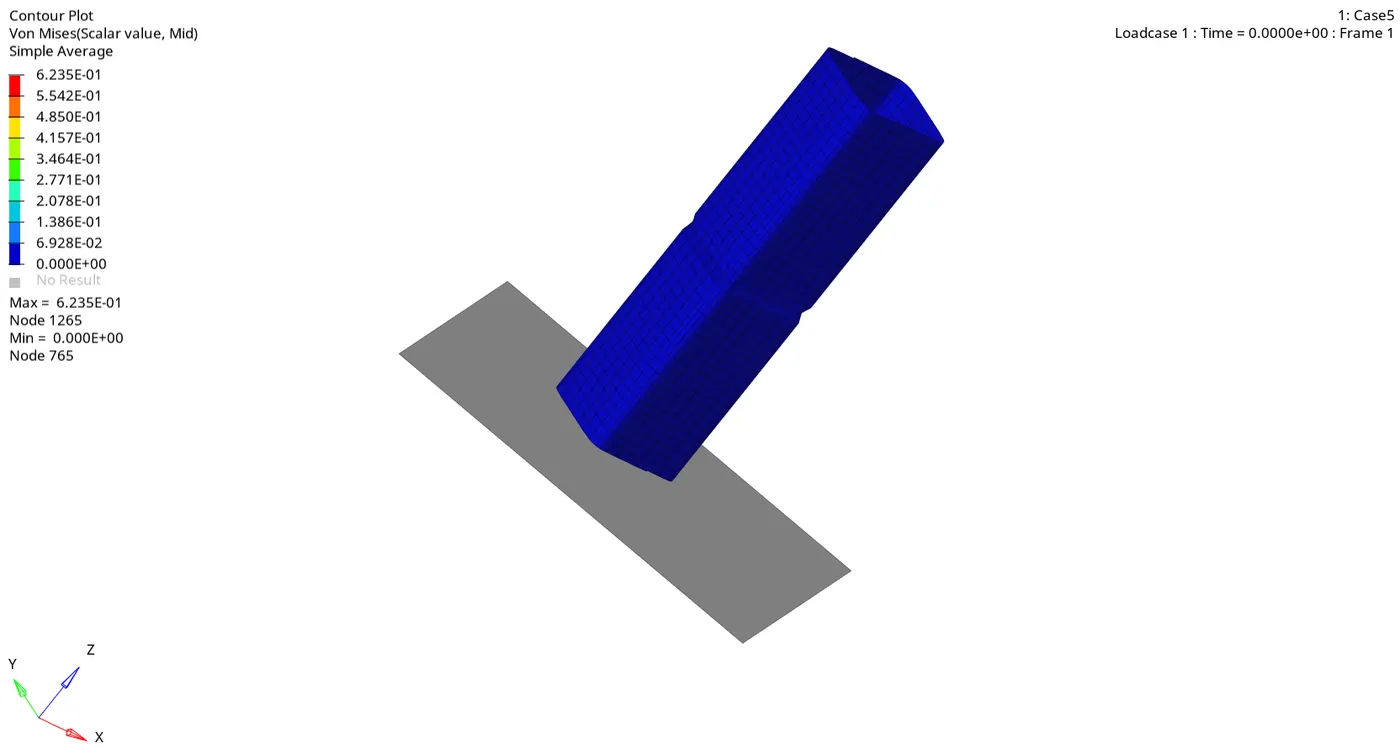
In the middle of the section a new notch is created.
Case 6:
New notches on both surfaces are created
Comparisons:
|
Case 1 |
Case 2 |
Case 3 |
Case 4 |
Case 5 |
Case 6 |
|
|
Definition |
Type 7 |
Type 7 |
Type 11 |
Type 11 |
Type 11 |
Type 11 |
|
Mass Error (%) |
0,00 % |
0,00 % |
0,00 % |
0,00 % |
0,00 % |
0,00 % |
|
Energy Error (%) |
-3,80 % |
-3,80 % |
-7,50 % |
-8,60 % |
-9,90 % |
-6,70 % |
|
Max von Mises Stress (MPa) |
695,3 |
697.4 |
622,6 |
699,6 |
623,5 |
618,4 |
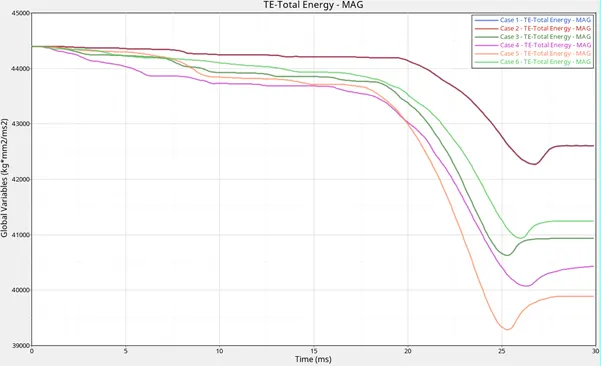
Case 1 and Case 2 are identical we see that changing Inacti to 6 doesn’t have any effect on the results because there is no initial interference in the mesh.
Total energy at t0 is equal to sum of contact energy, kinetic energy, internal energy and hourglass energy at t30. Such as down below from Case 1
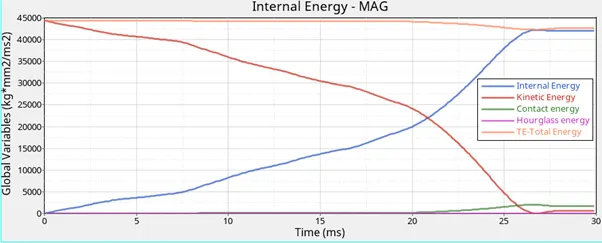
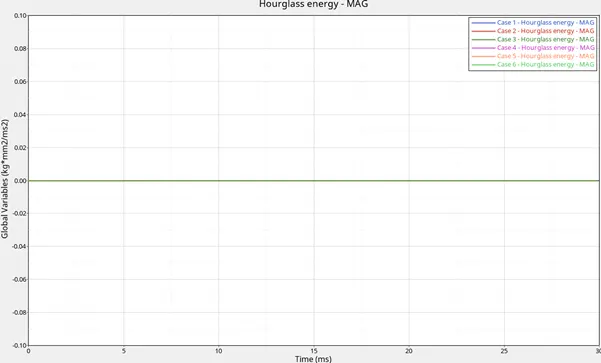
In all cases hourglass energy is 0 because we have appropriate property settings.
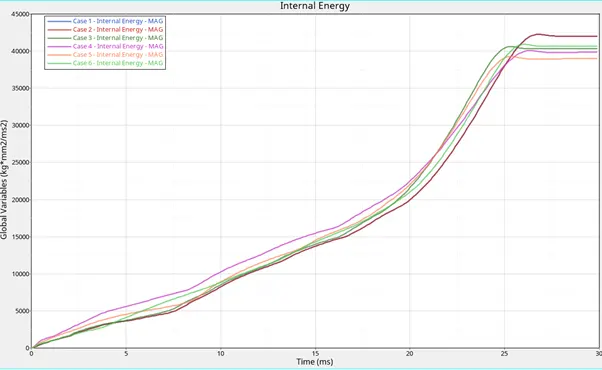
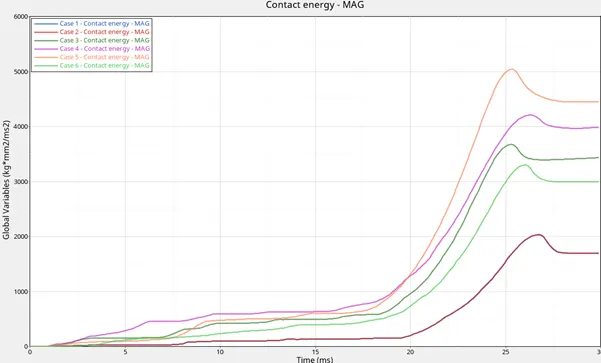
In this comparison again we see that Case 1 and Case 2 are identical.
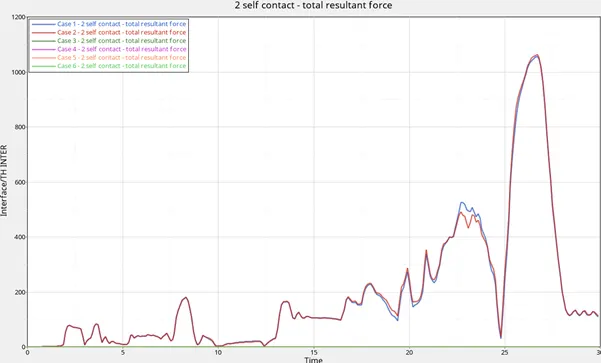
There is no significant change in self contact forces in all cases. Type 7 and Type 11 contact definitions cause small differences.
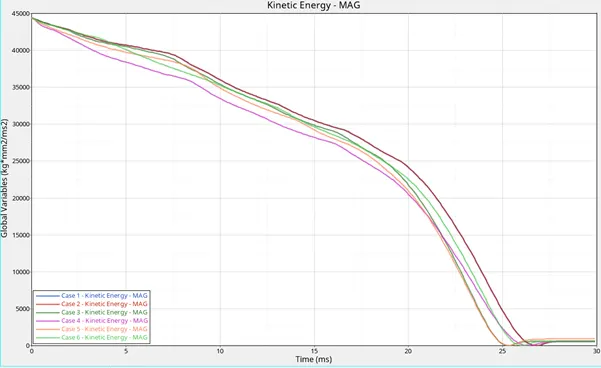
Kinetic energy levels shows us in case 5 velocity comes to 0 quicker than other cases which means higher G Force on the occupant. These energy levels are directly relevant to resultant velocity curves below
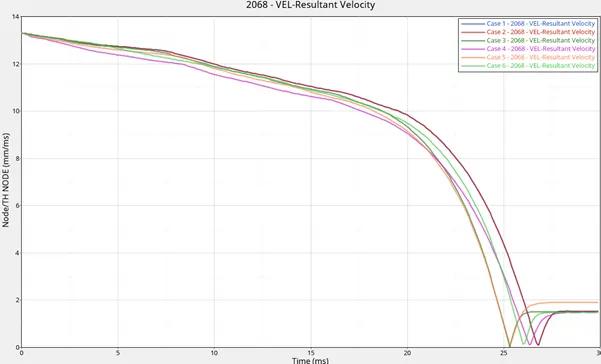
Resultant velocity graph shows us after reaching 0 mm/ms, crash box relaxes back with around 1-2 mm/ms velocity which is also visible in the animations.
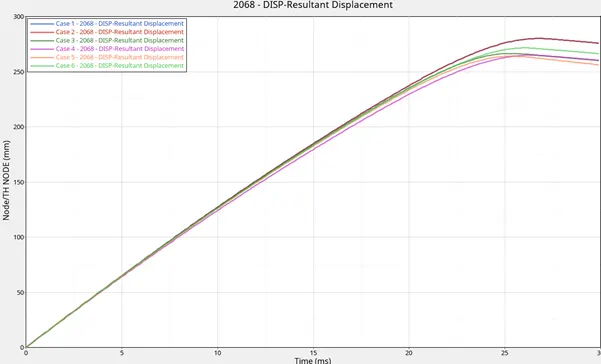
At the end of the crash we can see that all cases have similar displacement curves. The impact absorption and kinetic energy difference cause this small difference
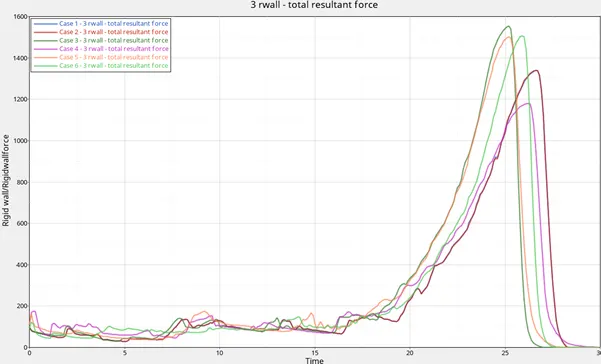
The biggest difference in cases we see in the rigid wall forces. Case 1 and Case 2 are again identical like in other graphs above. Changing from Case 5 to Case 6 (new notches) shifts the max force around 2 ms. They both reach the same force value. When we delete all the notches we see that rigid wall forces drop drastically. Here we see the effect of the notches very clearly.