Week 9 - Senstivity Analysis Assignment
AIM: To write a code to import all the reactions from GRI mechanism and to calculate 10 most sensitive reactions with respect to temperature parameter
Theoritical Background:
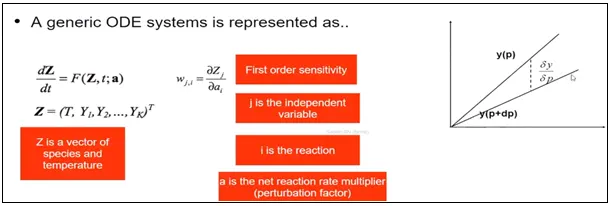
Sensitivity Analysis
It is the process to get relationship between the parameters and the output of the model. Sensitivity analysis investigates the effect of parameter change on the solution of mathematical models. In chemical kinetics, models are usually based on differential equations and the results are concentration-time curves, reaction rates, and various kinetic features of the reaction
"""
Program to perform sensitivity analysis on Methane combustion

"""

import numpy as np
import cantera as ct
import matplotlib.pyplot as plt

gas = ct.Solution("gri30.xml")
Temp = 1500
Pressure = ct.one_atm
gas.TPX = Temp,Pressure,{'CH4':1,'O2':2,'N2':7.52}

r=ct.IdealGasConstPressureReactor(gas, name='R1')
sim=ct.ReactorNet([r])
n = gas.n_reactions


for i in range(n):
	r.add_sensitivity_reaction(i)

# Set relative and absolute tolerances for solution and sensitivity analysis
sim.rtol = 1e-06
sim.atol = 1e-15


sim.rtol_sensitivity = 1e-06
sim.atol_sensitivity = 1e-06


states = ct.SolutionArray(gas, extra =['t'])

s_max = [0]*n

for t in np.arange(0,2e-3,5e-6):
	sim.advance(t)
	for i in range(n):
		s = sim.sensitivity('temperature',i)
		if(abs(s)>abs(s_max[i])):
			s_max[i] = s
	states.append(r.thermo.state, t = 1000*t)

# sorting top 10 reactions

N = 10

sen = [0]*n
sen_order = [0]*N
react_number = [0]*N

for i in range(N):
	for j in range(n):
		if(abs(np.min(s_max))>np.max(s_max)):
			sen_order[i] = np.min(s_max)
		else:
			sen_order[i] = np.max(s_max)
		react_number[i] = s_max.index(sen_order[i])
	s_max.remove(sen_order[i])

sens_react = [0]*N

print('Sensitivity index for the 10 most sensitive reactions')
for i in range(N):
	sens_react[i] = sim.sensitivity_parameter_name(react_number[i])
	print('s=',sen_order[i],'for reaction',sens_react[i])


plt.figure(1)
plt.barh(sens_react,sen_order)
plt.xlabel('Sensitivity')

plt.figure(2)
plt.subplot(2,2,1)
plt.plot(states.t,states.T)
plt.xlabel('Time(in ms)')
plt.ylabel('Temperature(in K)')


plt.subplot(2,2,2)
plt.plot(states.t,states('CH4').X)
plt.xlabel('Time(in ms)')
plt.ylabel('Mole fraction of CH4')

plt.subplot(2,2,3)
plt.plot(states.t,states('H').X)
plt.xlabel('Time(in ms)')
plt.ylabel('Mole fraction of H')

plt.subplot(2,2,4)
plt.plot(states.t,states('OH').X)
plt.xlabel('Time(in ms)')
plt.ylabel('Mole fraction of OH')

plt.show()
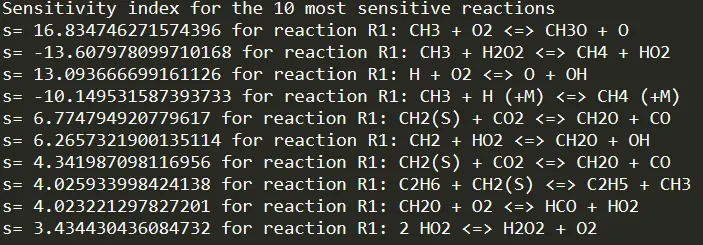
Results:
Plots
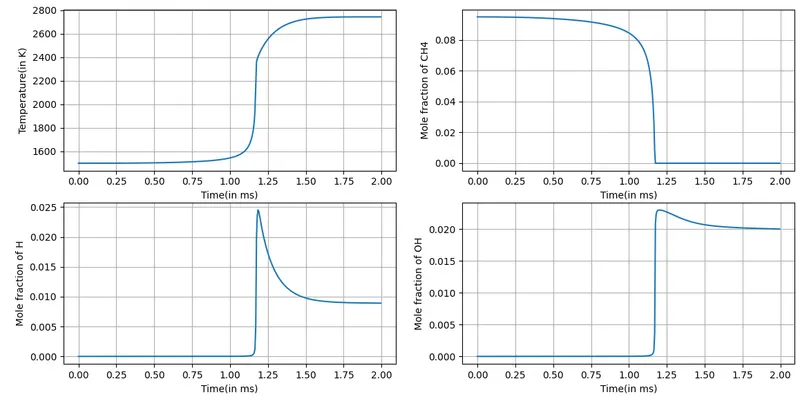
Variation of Temperature with respect to Molar Concentration for species like CH4, OH, H are observed in the above plots
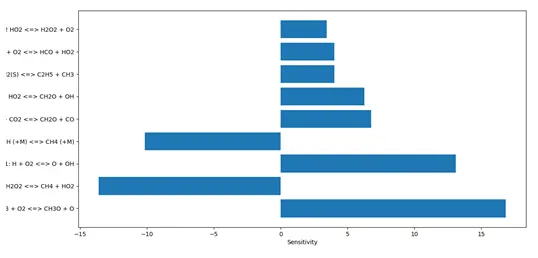
The most sensitive reaction from the above plot was found to be CH3 +O2 <=> CH3O + O. This reaction has a sensitivity coefficient of 16.83. The reaction occurs very faster and has shorter ignition period. If the sensitivity coefficient is Positive, which means reactions are becoming faster , that having a shorter ignition period. If the sensitivity coefficient is Negative means reaction is inhibiting the ignition delay.