Week 9 - Senstivity Analysis Assignment
Objective: To write the code which will take entire reactions of GRI mechanism 3.0 and take out the most sensitive top 10 reactions.
The main parameters are as follows:
- Write code to list out the top 10 most sensitive reactions from a list of all reactions from the GRI mechanism.
- The sensitivity parameters should be with respect to Temperature.
- Arrange those reactions string in order of greatest sensitivity to least sensitivity.
Theory:
Sensitivity Analysis
In combustion huge numbers of reactions participate in the reaction, some of them are very crucial to ignite the mixture for given thermodynamic operating conditions. Hence, to find out which reactions are more sensitive for a given parameter, the sensitivity analysis technique is useful to its understanding.
In a sensitivity analysis, we will basically try to find out which reactions are very much sensitive to a parameter and which are less sensitive based on that we tune the reactions to satisfy the need under certain operating conditions. It is a process to get a relationship between the parameter and the output of the model. The main aim of this process is to calculate the ignition delay in the combustion and sensitivity analysis will tell us which reaction causes more ignition delay and we can adjust the mechanism reaction tuning.
GRI mechanism: This is the mechanism that will participate in the combustion process in our reactor. It contains 325 nos. of reactions. The analysis we perform here is the sensitivity of reaction against temperature.
The transient implicit scheme is used to solve the whole mechanism.
Python code:
import numpy as np
import cantera as ct
import matplotlib.pyplot as plt
import os

# Constant pressure reactor with sensitivity analysis

gas = ct.Solution('gri30.xml')

# Initial Conditions
T= 1500
P= ct.one_atm
n= int(325) # nos.of reactions from GRI 3.0 mechanism
s_min= [0]*325
n_r=[]

gas.TPX= T,P,'CH4:1, O2:2, N2:7.52' # Methane as a fuel

r= ct.IdealGasConstPressureReactor()
r.insert(gas)

# To create a reactor network
sim= ct.ReactorNet([r])

# To add all reactions
for m in range(n):
	r.add_sensitivity_reaction(m)

# To set the tolerances for the solution and for the sensitivity coefficients
sim.rtol= 1e-6
sim.atol= 1e-16

sim.rtol_sensitivity= 1e-5
sim.atol_sensitivity= 1e-6

# To create a solution array to store evoluted data
states= ct.SolutionArray(gas, extra=['t'])

# time-step
for t in np.arange(0,2e-3,5e-7):
	sim.advance(t)

	for j in range(n):
		s= sim.sensitivity('temperature',j) # sensitivity of temerature, j represents nos. of reactions

		if np.abs(s) >= np.abs(s_min[j]): # Condition to choose high sensitive reactions at corrosponding time.
			s_min[j]= s

	states.append(r.thermo.state, t= 1000*t)

	print('%10.3e %10.3f %10.3f %14.6f'%(sim.time, r.T, r.thermo.P, r.thermo.u))

k = np.linspace(1,n,n)

sensitivity_list= (tuple(zip(k,s_min))) # to compile rection data and sensitive value
sensitivity_list_max= sorted(sensitivity_list, key=lambda sensitivity_list:-sensitivity_list[1]) # to sort the value in descending

# To select top 10 highly sensitive reactions.
names= []
sensitive_value= []


for l in range(10):
	n_r1= sensitivity_list_max[l]
	n_r2= int(n_r1[0])
	n_r.append(n_r2)
	n_r3= int(n_r1[1])
	sensitive_value.append(n_r3)

# To access to OS and take out reaction string from GRI 3.0 file
os.chdir('D:\C5_Python\cantera\data')

for i in (n_r):
	k= str(int(i))
	#k= str(155)

	file= open('gri30.cti','r')
	ct=1
	ct1=1
	j=0

	for line in file:

		if 'Reaction' in line:
			if k in line:
				j=ct
			ct= ct+1

	file = open('gri30.cti','r')
	for line in file:

		if 'reaction('in line:
			ct1= ct1+1
			if ct1 == j:
				names.append(line.split('"')[1])


#Plotting the results

fig, ax= plt.subplots(2,2)

ax[0,0].plot(states.t,states.T)
ax[0,0].set_title('Temperature and mole fraction in Reactor')
ax[0,0].set_xlabel('Time(ms)')
ax[0,0].set_ylabel('Temperature(K)')

ax[0,1].plot(states.t,states('OH').X)
ax[0,1].set_xlabel('Time(ms)')
ax[0,1].set_ylabel('OH mole fraction')

ax[1,0].plot(states.t,states('H').X)
ax[1,0].set_xlabel('Time(ms)')
ax[1,0].set_ylabel('H mole fraction')

ax[1,1].plot(states.t,states('CH4').X)
ax[1,1].set_xlabel('Time(ms)')
ax[1,1].set_ylabel('CH4 mole fraction')

fig.tight_layout()

x= np.linspace(0,9,10)
plt.figure(2)
plt.barh(x,sensitive_value)
plt.yticks(x,names)
plt.title('Sensitivities for GRI 3.0')

plt.grid('on')
plt.tight_layout()

plt.show()
Results:
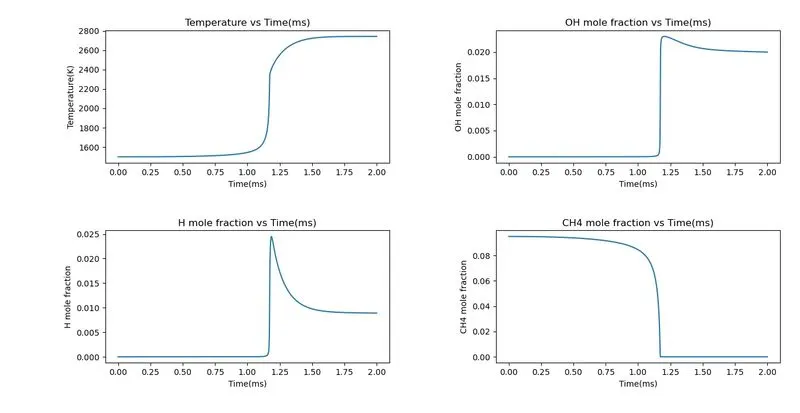
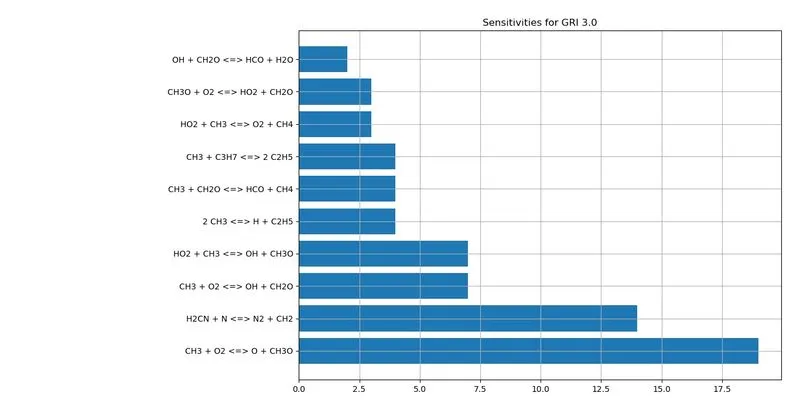
From the above graph, we can clearly see that, the reaction `CH_3+O_2->CH_3O+O` has a higher sensitivity coefficient, and the remaining 9 reactions show it has better control over which parameters to control to get desired results.