Week-6 Calculate the Stretch Ratio by comparing the ELFORM (-2,-1,1,2) with Ogden_Material Model.
OBJECTIVE :
1. To create a cubic block with size 10x10 with 10 solid elements in each direction.
2. To run the implicit simulation for the created block with different element forms i.e, ELMFORM 0,1,-1,1 simulating the tensile behaviour.
3. Plot the stress vs stretch ratio for different ELMFORM i.e, 1,2,-1,-2 and notice the difference.
CASE SET UP :
CASE 1 :
1. Creating the block
The block is created using the Shape mesh tool from the Element and Mesh toolbar. The size of the Box along with the no of meshes in each direction is entered.
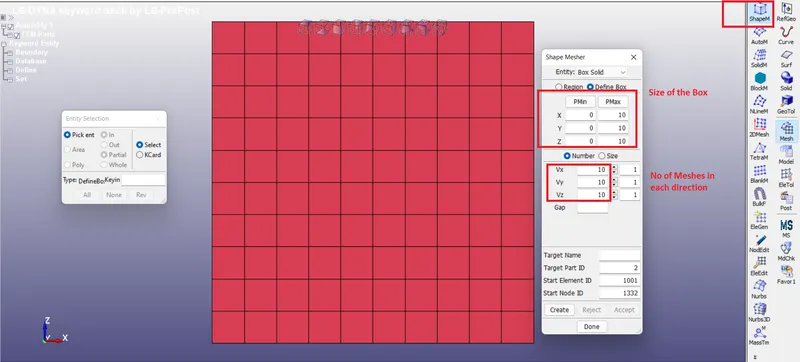
Fig 1 Creating the 10x10 Block mesh
2. Seting up the Boundary conditions
i. All the nodes nodes on one face of the block except the nodes at the centerlines in both horizontal and vertical direction are constrained in all directions except X and Z directions which are perpendicular to the direction of the application of the load. The nodeset is created for nodes.
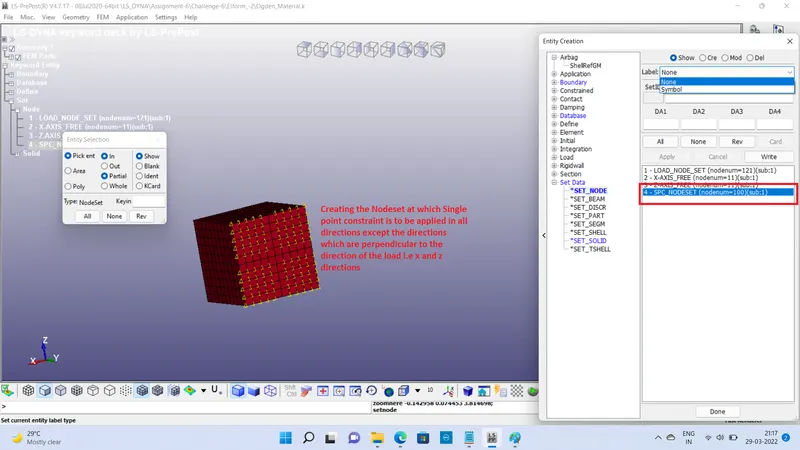
Fig 2 Creating the nodeset for Single Point Constraint in all directions except x and z directions
The newly created nodeset in assigned for Single point constraint in all directions except X and Z directions which are perpendicular to the direction of the application of the load.
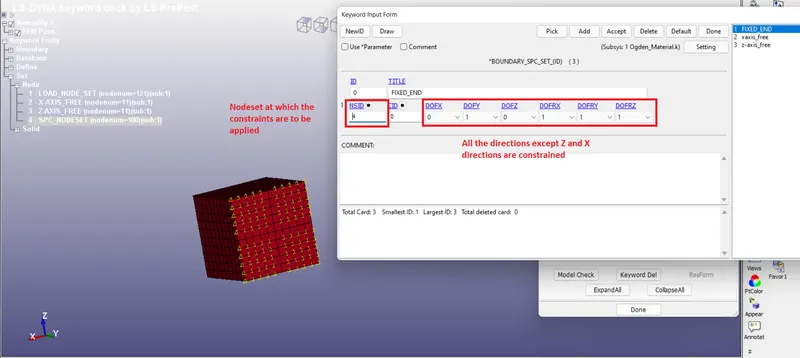
Fig 3 Applying the Single point constraint in all directions except Z and X directions
ii. Constraining the Nodes of the horizantal centerline in all the directions except in the x-direction.
In the SPC set card the nodeset of the nodes in the horizontal centerline are selected and they are constrained in all directions except in the x-direction.
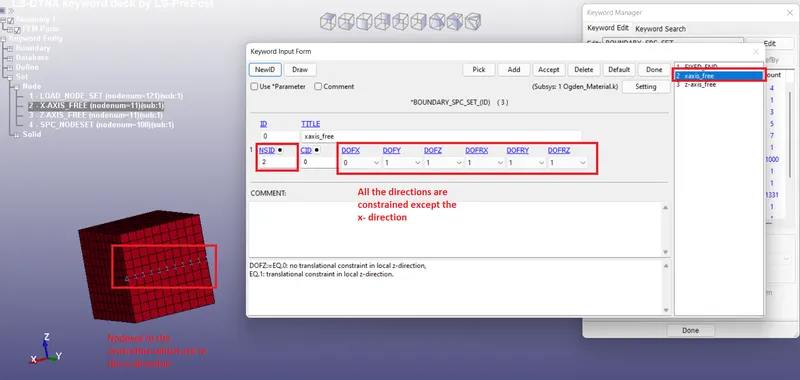
Fig 4 Constraining the X- direction centerline nodes
iii. Constraining the Nodes of the vertical centerline in all the directions except in the z-direction.
In the SPC set card the nodeset of the nodes in the vertical centerline are selected and they are constrained in all directions except in the z-direction.
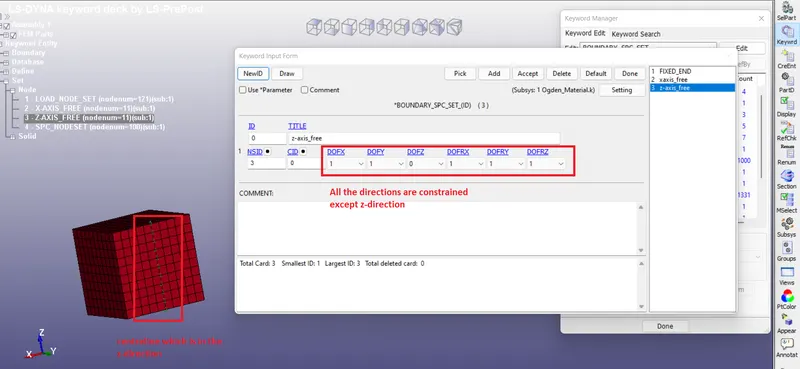
Fig 5 Constraining the Z- direction centerline nodes
iv. Applying the Prescribed motion set
The face opposite to the one where the SPC boundary condition is applied is subjected to Prescribed motion set. All the nodes of the face are made as the part of the nodeset and that nodeset is assigned a prescribed displacement. The Prescribed displacement is as per the curve shown below with the scale factor of -50.
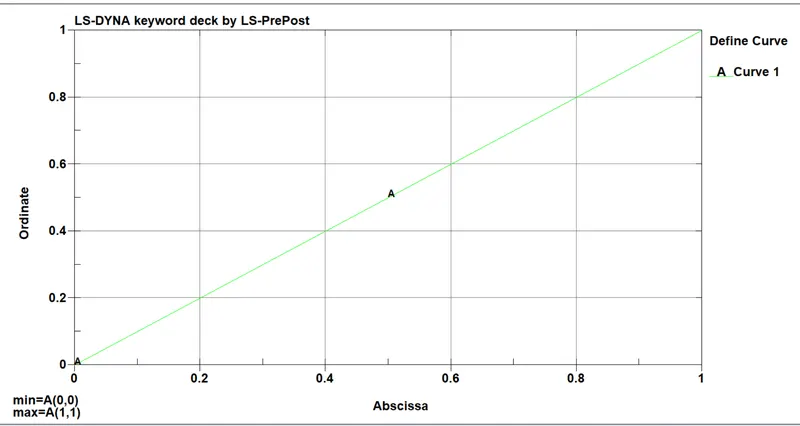
Fig 6 LCID plot for the Prescribed motion
The Degree of freedom is kept at 2 in the Prescribed motion set card since the displacement given is translational motion in y-direction. The VAD value is kept at 2 in the Prescribed motion set card since the prescribed motion is the Displacement.
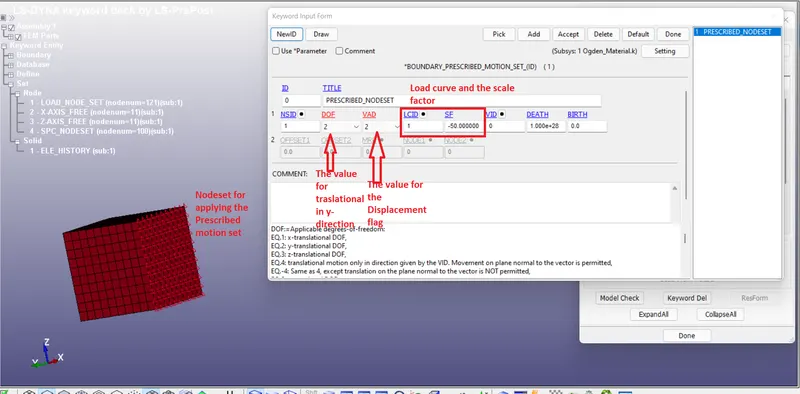
Fig 7 Creating the Prescribed motion set card
3. Creating the Section card
The Solid section card created with the Eleform=1 from the keyword manager. The element form chosen is constant stress solid element.
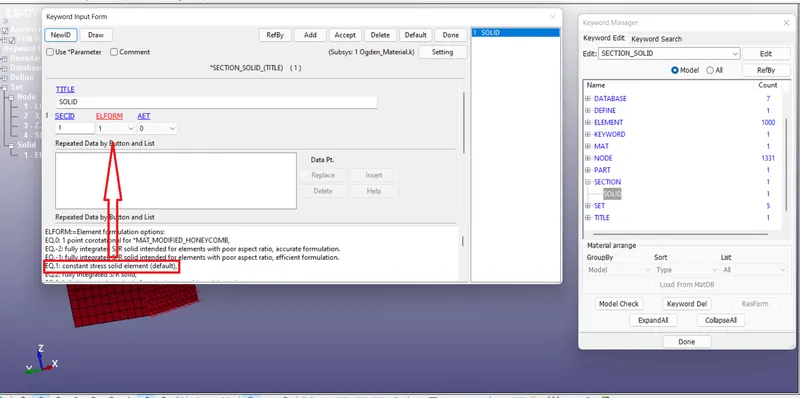
Fig 8 Creating the section card with the required elementform
4. Assigning the Material and the section card to the PartID
The Ogden Material card and the solid element card with the required element formulation is assigned to the PartID i.e, The Block mesh.
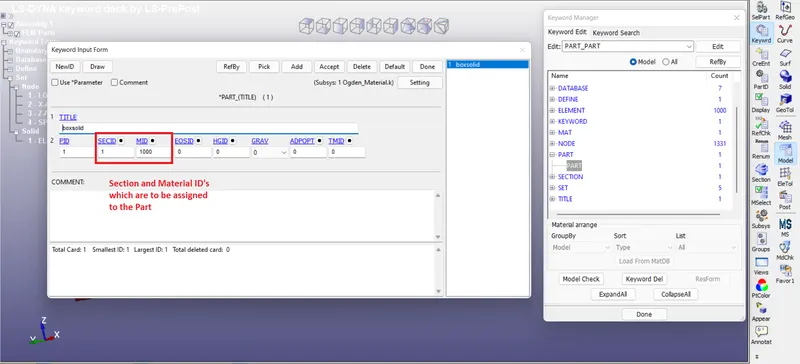
Fig 9 Assigning the Material and the section to the Part
5. Creating the database for the output
i. Creating the ASCII card
The ASCII card is created in the keyword manager with the options for the GLSTAT, MATSUM & ELEOUT being checked on. The timesteps at which these results must be plotted are also entered in the box for the DT.
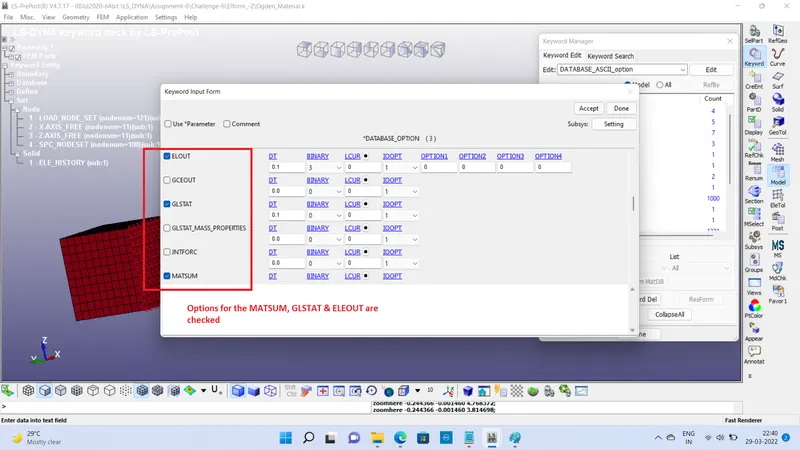
ii. Creating the binary D3Plot card for the animation output
The binary D3plot card with the timestep at which these outputs must be given out is mentioned in DT value.
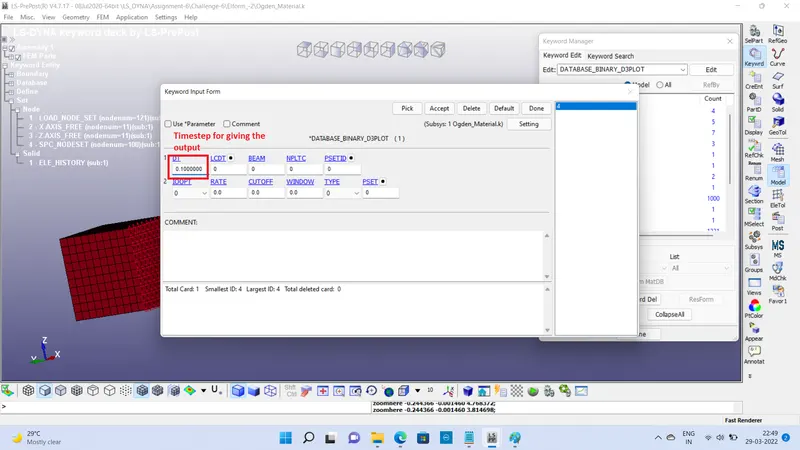
Fig 11 Creating the D3plot card for the animation output
iii. Creating the Binary_Extent card for the Strain output
The Extent_Binary card is created under the keyword *database in the keyword manager & the strainflag is made equal to one so that strain tensor data is written on the d3plot and the eleout.
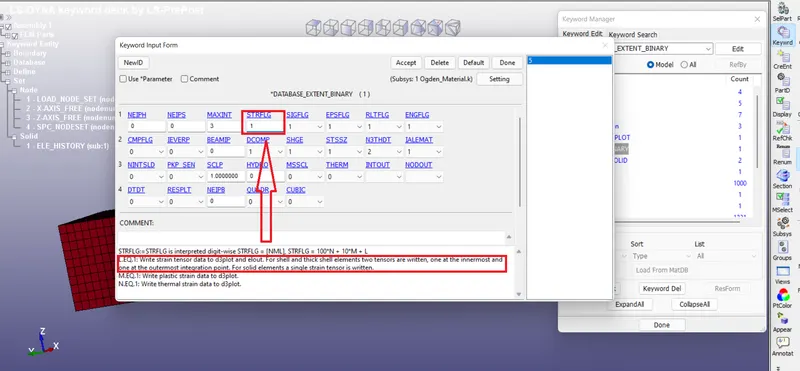
Fig 12 Creating the extent_binary card for strain tensor data
iv. Creating the History_Solid card for the ELEOUT
The History_solid card is created and one of the element is selected for Element output . The selected element ID is inserted in the card.
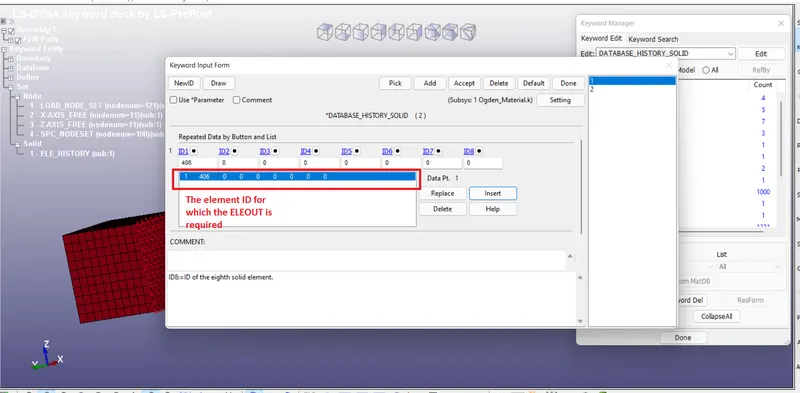
Fig 13 Creating the History_Solid card for ELEOUT
6. Creating the control cards for the Implcit analysis
i. Creating the IMPLICIT_GENERAL card
The IMPLICIT_GENERAL card is created for the Implicit analysis. The flag for the Implicit analysis is turned ON by entering the value "1".
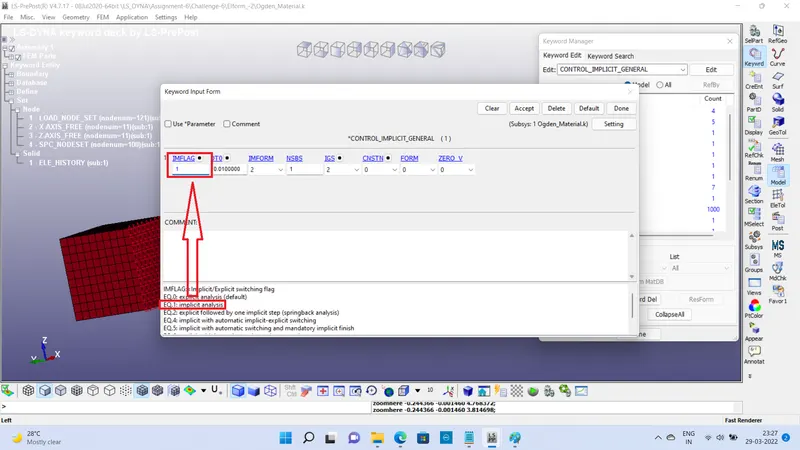
Fig 14 Creating the Implicit_general card for the Implicit analysis
ii.Creating the IMLICIT_AUTO card for automatic adjustment of timestep
The flag for the automatic adjustment of the timestep is turned ON by entering the value for AUTO in the IMPLICIT_AUTO card.
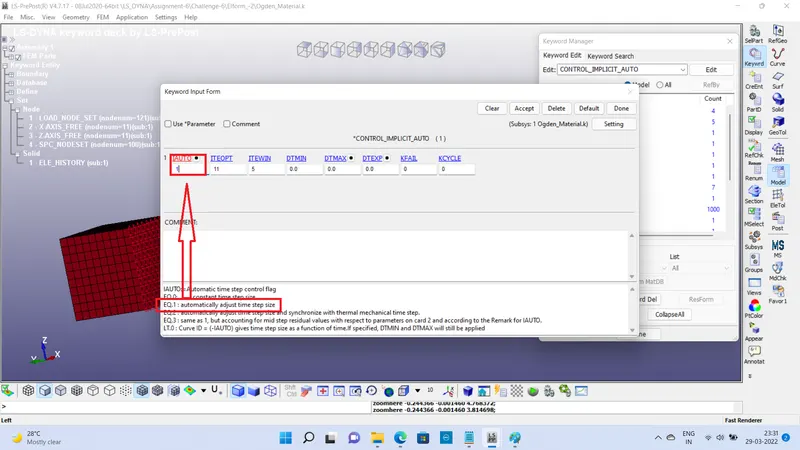
Fig 15 Creating the card Implicit_auto for automatic adjustment of the timestep
iii. Creating the IMPLICIT_SOLUTION card for setting the limit for the no of iterations and the tolerance limit for the displacement relative convergence .
The IMPLICIT_SOLUTION card is created for setting the limit for the no iterations at each timestep for convergance. In this card, the displacement realative convergance tolerance limit can also be set.
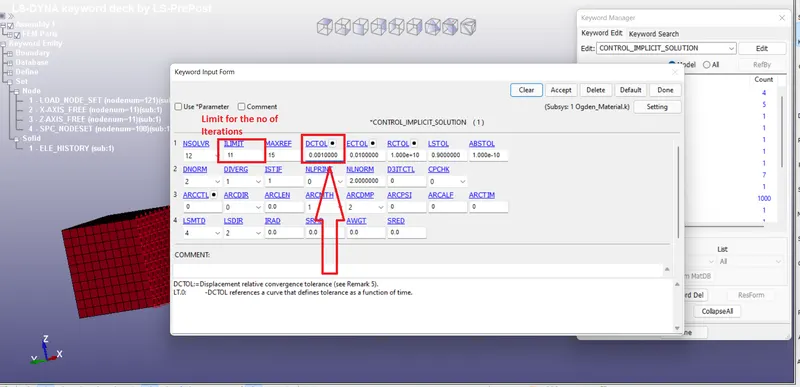
Fig 16 Creating the IMPLICIT_AUTO card for limiting the no of Iterations for each timestep and setting the tolerance limit for the displacement convergance
iv. Creating the IMPLICIT_SOLVER card
This an optional card which applies to implicit calculations. The linear equation solver performs the CPU-intensive stiffness matrix inversion.
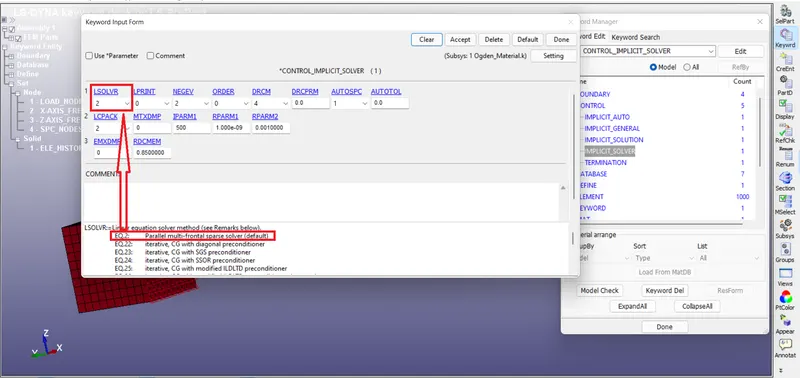
Fig 17 Creating the IMPLICIT_SOLVER card
CASE 2 :
All the steps are similar to CASE 1 except Step 3. In this step, the Elementform is changed from "1" to "2" which is fully integrated S/R solid.
CASE 3 :
All the steps are similar to CASE 1 except step3 . In this step, the Elementform is changed to "-1" which is fully integrated S/R solid intended for elements with poor aspect ratio & efficient formulation.
CASE 4 :
All the steps are similar to CASE 1 except step3 . n this step, the Elementform is changed to "-2" which is fully integrated S/R solid intended for elements with poor aspect ratio & accurate formulation.
EXECUTION:
All the above cases are saved as different keyword files and are run in the LS-RUN.
RESULTS:
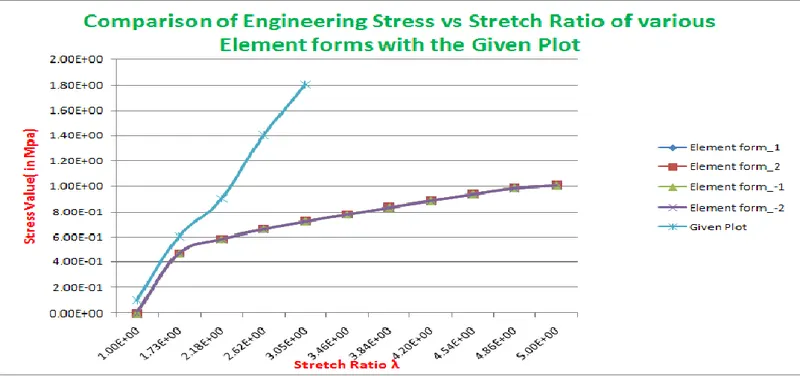
1. Plotting the Stress vs Stretch ratio for different elementforms and the comparison with given plot
Inference :
1. It can be seen from the graph that there isn't much difference between the Stress vs the Stretch ratio plot between various element forms since, the model is fairly a simple one and hence, the desierd accuracy could be achieved even with the reduced integrated elements.
2.It can be seen that there is a huge difference in the stress vs stretch ratio plots of various elementforms when compared with the given plot for the stretch ration upto 5. This could be due to the difference in the strain rates.
NOTE :
The excel sheet containing calculation of Stress/Strain and the Stretch Ratio for all the ELFORM has been attached seperately with the report.
CONCLUSIONS :
1.A cubic block with size 10x10 with 10 solid elements in each direction was created successfully.
2.The implicit simulation for the created block with different element forms i.e, ELMFORM 0,1,-1,1 simulating the tensile behaviour was run successfully.
3. The stress vs stretch ratio for different ELMFORM i.e, 1,2,-1,-2 were plotted succesfully and they were successfully compared with the given Uniaxial plot upto the stretch ration of 5.