Week 4 - Genetic Algorithm
AIM :
To optimize a stalagmite function and to find the global maxima using genetic algorithm .
THEORY:
Genetic algorithm:
Genetic algorithm is based on the mechanics of natural selection and natural genetics.It is based on the survival of the fittest theory.It simulates the process of evolution. It was developed by Prof. Holland , his colleagues and students at university of Michigan ,1995.
- Features of biological system :
- Expensive redisigns can be substantially reduced or even eliminated if systems can be made more robust.
- Flexibilty , robustness and efficiency of bilogical systems are amazing.
- Self repair , self guidance and reproduction is the rule in bilogical systems .
These features are not common in even sophisticated man made systems
If we come down to comparing living and artificial systems , then it boils down to a inference :
- If robustness is the main criteria then nature is the clear winner .
Robustness is the balance between efficiency and efficacy and it is nessecary for survival in different environmental conditions.
Goal of optimization is to keep improving the performance to reach a or some optimal points.
- Difference between genetic algorithm and traditional optimization methods :
- Genetic algorithm works with the coding of the parameter sets, not the parameters.
- Genetic algorithm search for population of points , not a single point.
- Genetic algorithm search for the objective function information and not the derivative or second derivative .
- Genetic algorithm use stochiastic transition rules , not the deterministic rule .
- How Genetic algorithm works?
The following outline summarizes how the genetic algorithm works:
-
The algorithm begins by creating a random initial population. This is the search space.
-
The algorithm then creates a sequence of new populations. At each step, the algorithm uses the individuals in the current generation to create the next population. To create the new population, the algorithm performs the following steps:
-
Scores each member of the current population by computing its fitness value. These values are called the raw fitness scores.
-
Scales the raw fitness scores to convert them into a more usable range of values. These scaled values are called expectation values.
-
Selects members, called parents, based on their expectation.
-
Some of the individuals in the current population that have lower fitness are chosen as elite. These elite individuals are passed to the next population.
-
Produces children from the parents. Children are produced either by making random changes to a single parent—mutation—or by combining the vector entries of a pair of parents—crossover.
-
Replaces the current population with the children to form the next generation.
-
-
The algorithm stops when one of the stopping criteria is met.
Syntax for genetic algorithm:
The basic syntax for genetic algorithm is as follows :
clear all
close all
clc
%defining the search space
x = linspace(0,0.6,150);
y = linspace(0,0.6,150);
% creating an 2D array from the 1D array
[xx,yy] = meshgrid(x,y);
%evaluating the stalagmite function
for i = 1:length(xx)
    for j = 1:length(yy)
        input_vector(1) = xx(i,j);
        input_vector(2) = yy(i,j);
        f(i,j)= stalagmite(input_vector);
    end
end

surfc(xx,yy,f)
shading interp
[x ,fval] = ga(@stalagmite,2)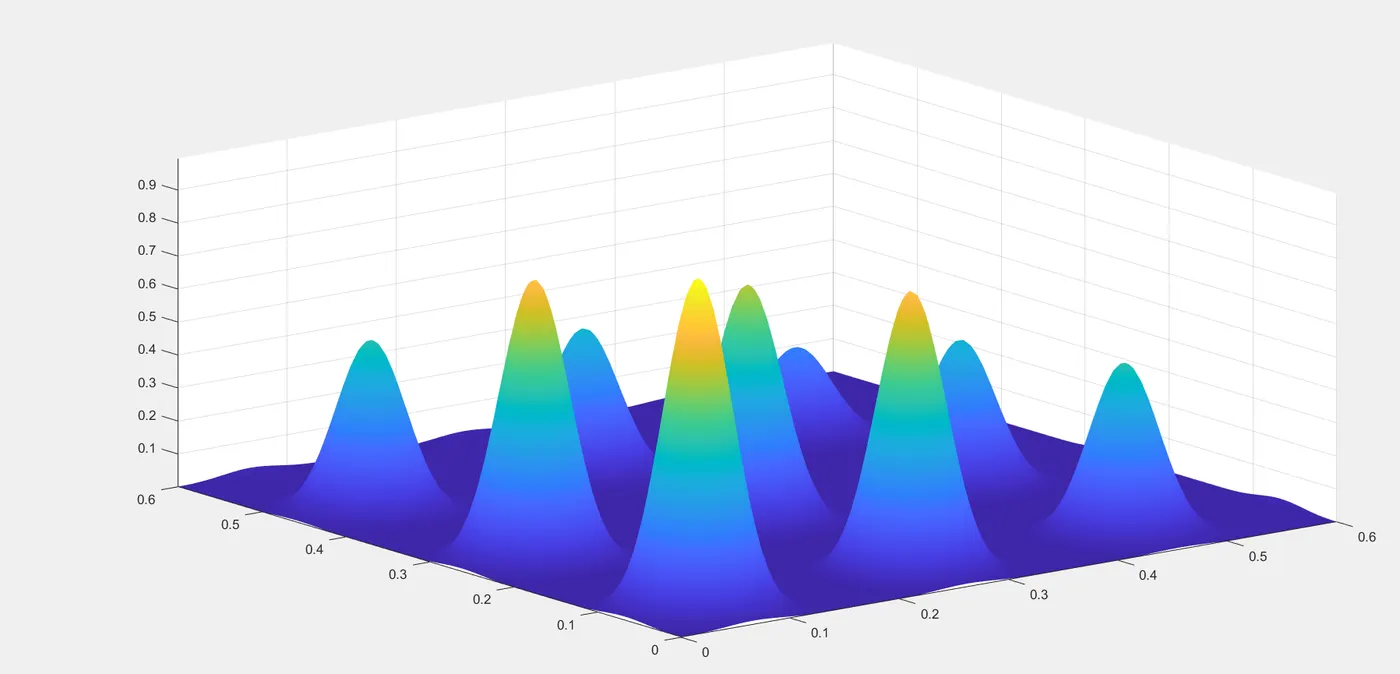
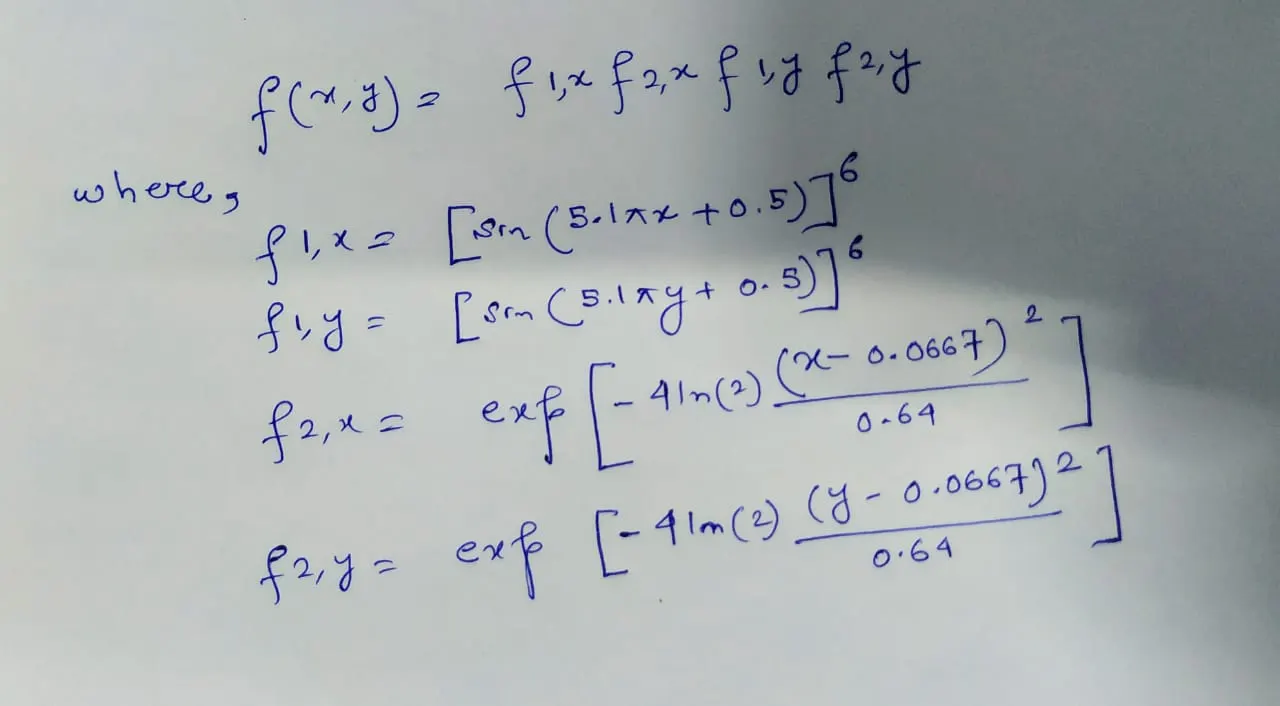
function [f] = stalagmite_g(input_vector)
x=input_vector(1);
y=input_vector(2);

f1 = (sin(5.1*pi.*x+0.5).^6);
f2 = (sin(5.1*pi.*y+0.5).^6);
f3 = exp(-4*log(2).*(x-0.0667).^2/0.64);
f4 = exp(-4*log(2).*(y-0.0667).^2/0.64);
f = -(f1.*f2.*f3.*f4);
endclear all
close all
clc
%defining the search space
x = linspace(0,0.6,150);
y = linspace(0,0.6,150);
%creating 2D array
[xx,yy] = meshgrid(x,y);
%evaluating the stalagmite function
for i = 1:length(xx)
for j = 1:length(yy)
input_vector(1) = xx(i,j);
input_vector(2) = yy(i,j);
f(i,j)= stalagmite_g(input_vector);
end
end
%study1_unbounded inputs
num_cases = 50 ;%setting the number of iterations to 50
tic
for i = 1:num_cases
[inputs,fopt(i)]= ga(@stalagmite_g,2);%stalagmite_g is the function
xopt(i) = inputs(1);
yopt(i) = inputs(2);
end
study_time = toc
%plotting
figure(1)
subplot(2,1,1)
surfc(xx,yy,f)
hold on
shading interp %hiding the mesh
plot3(xopt,yopt,fopt,'marker','o','markersize',5,'markerfacecolor','black')
title('Unbounded inputs')
subplot(2,1,2)
plot(fopt)
xlabel('Iteration')
ylabel('Function minimum value')
%study2_bounded inputs
tic
for j = 1:num_cases
[inputs,fopt(j)]= ga(@stalagmite_g,2,[],[],[],[],[0;0],[0.6;0.6]);%giving the upper and lower bounds
xopt(j) = inputs(1);
yopt(j) = inputs(2);
end
study_time = toc
figure(2)
subplot(2,1,1)
surfc(xx,yy,f)
hold on
plot3(xopt,yopt,fopt,'marker','o','markersize',5,'markerfacecolor','black')
title('bounded inputs')
shading interp
subplot(2,1,2)
plot(fopt)
xlabel('Iteration')
ylabel('Function minimum value')
%study3_increasing population
num_cases = 50; %setting the number of iterations to 50
options = optimoptions('ga');
options = optimoptions(options,'populationsize',200);
tic
for k = 1:num_cases
[inputs,fopt(k)]= ga(@stalagmite_g,2,[],[],[],[],[0;0],[0.6;0.6],[],[],options);
xopt(k) = inputs(1);
yopt(k) = inputs(2);
end
study_time = toc
figure(3)
subplot(2,1,1)
surfc(xx,yy,f)
hold on
plot3(xopt,yopt,fopt,'marker','o','markersize',5,'markerfacecolor','black')
title('bounded inputs with more population size')
shading interp
subplot(2,1,2)
plot(fopt)
xlabel('Iteration')
ylabel('Function minimum value')
CODING EXPLANATION:
- The function is coded separately by the name stalagmite_g . The matrices multiplication syntaxes is taken care of meticulously.
- The main part of the function is ;
By using the linspace command the search space is created for x and y . An array is created for the x and y values.
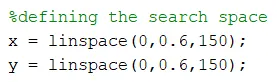
A 2D array is created using the meshgrid command ;

No of itaretions is set to 50 as num_cases = 50;
We use the tic and toc command to estimate the time taken for optimisation
A for loop is executed for running the optimization
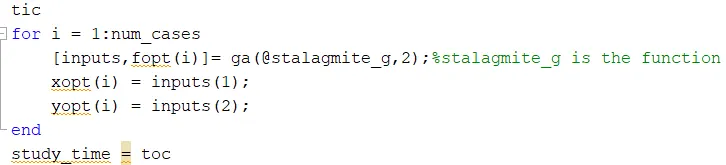
we call the stalagmite_g function coded ago and there are two variables. This is for the unbounded case study.
We create a separate figure, To have multiple plots inside the same figure we use the subplot command . surfc is used to create the surface .To hide the mesh, shading interp command is used. Plot 3 command is used to plot the xoptimum value, yoptimum value and the optimum value of the fitness function .
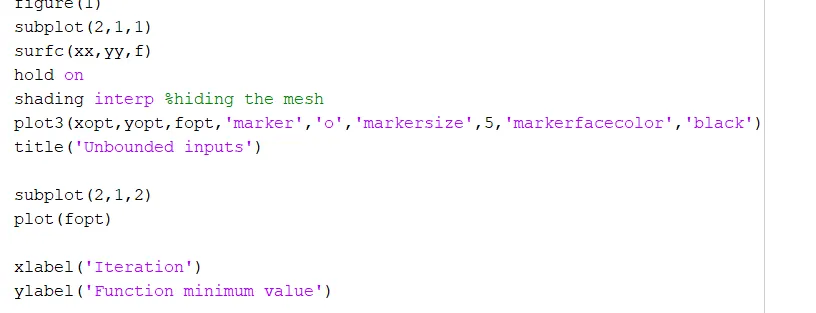
Same procedure is followed for the bounded inputs and the bounded inputs with more population size study, only difference is the bounds given.
- here fopt is the optimal value that the genetic algorithm predicts over the 50 studies. It helps to visualize how the algorithm is functioning .
- the second subplot is created to plot the optimum value of the function and how it is predicted as a function of iteration that is nothing but the num_cases
- For the bounded case , we want our results to be more specific .
OUTPUT :
The plot for the unbounded case is as below:
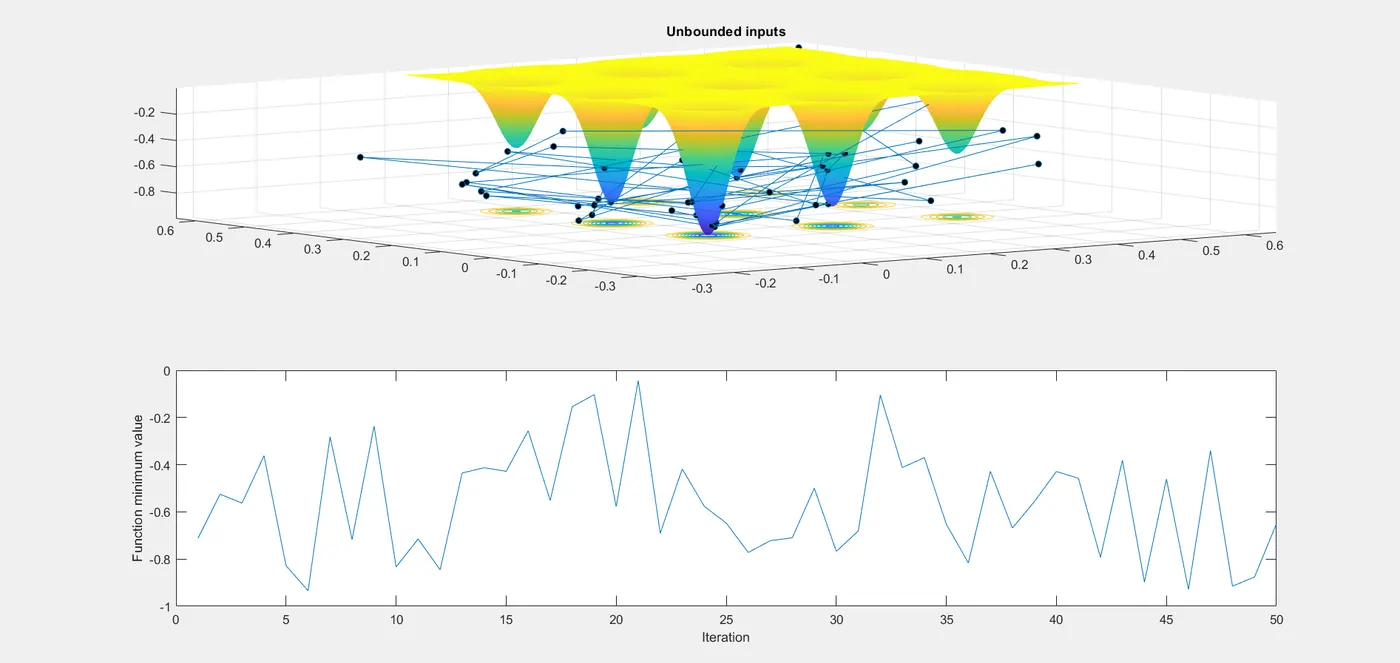
we see here our results are all over the place . It is not at all that helpful .
The plot for the bounded inputs case study is as follows :
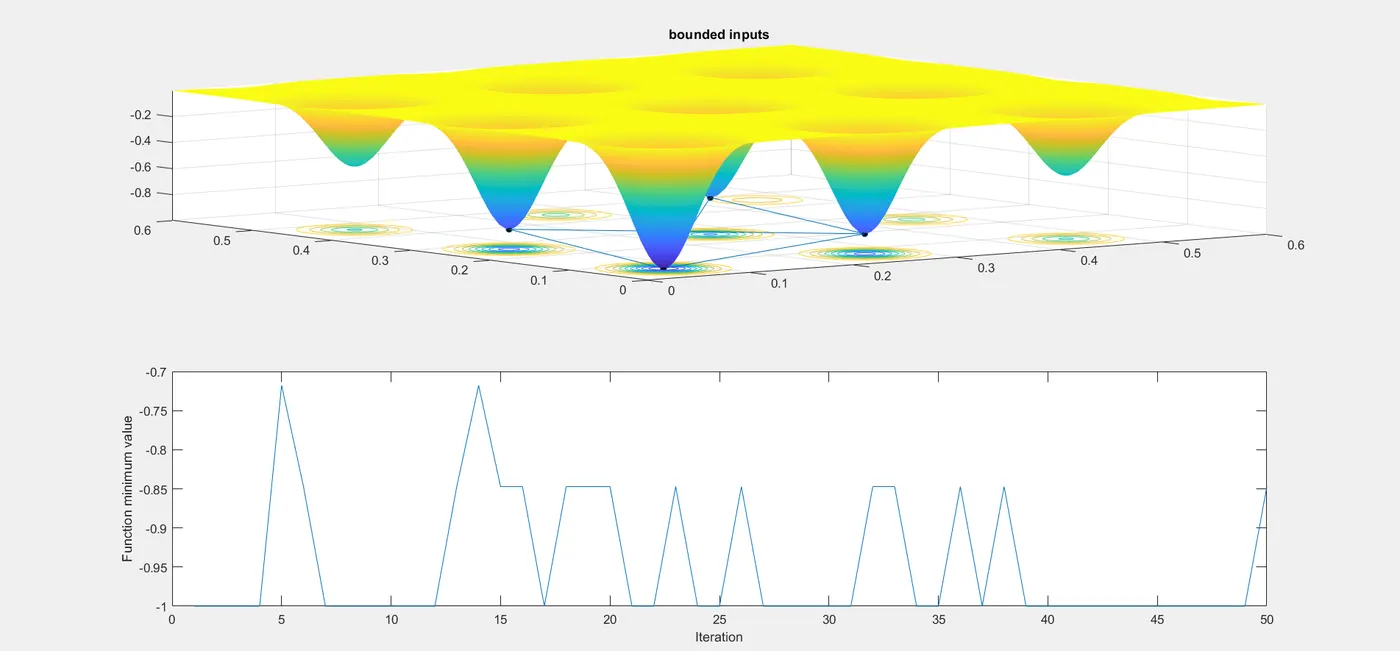
This time it is much more specific . but now we increase the population size .
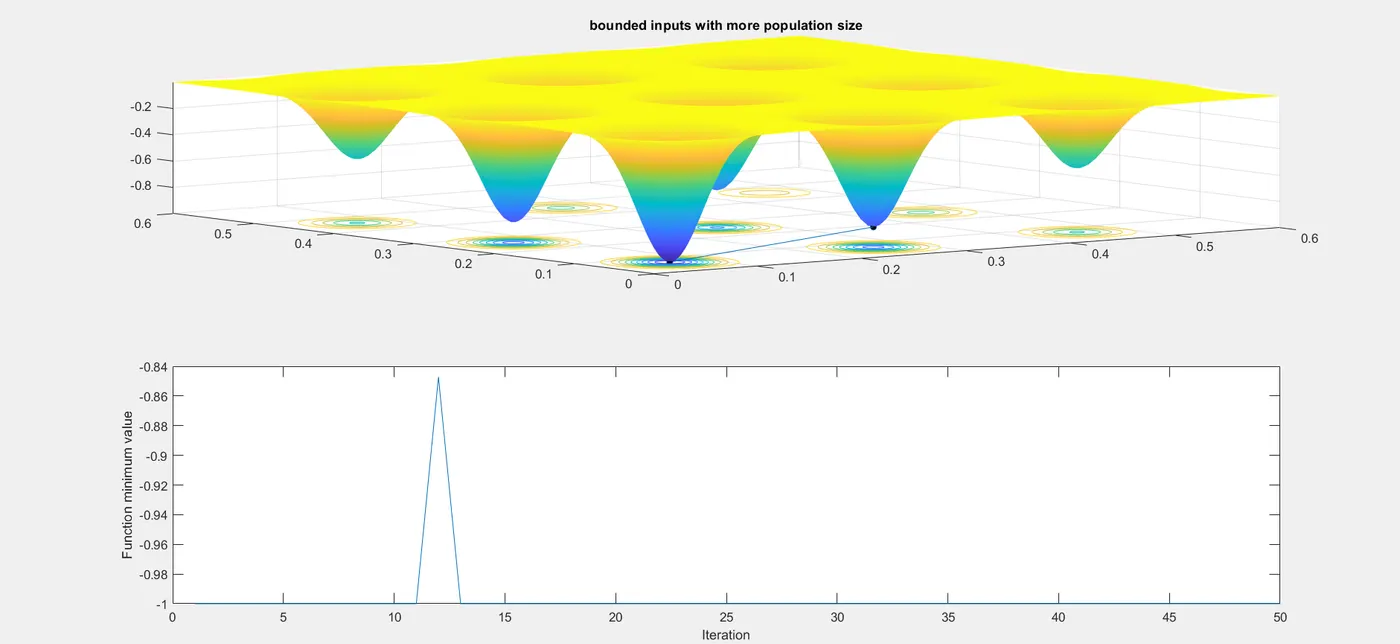
Now we can see it is more or less uniform with only one rise .
CONCLUSION:
- Genetic algorithm starts with an initial generation of candidates solution that are tested against an objective function. Subsequent generations evolve from the first generation.
- Genetic algorithm relies on probabilty .
REFERENCES: