Week-4 Challenge WOT Condition Part-2
1.What is the difference between the mapped and dynamic model of engine, motor, and generator? How can you change the model type?
MAPPED models:
Mapped models are used when the behavior of a particular model is not of our interest and can be modeled with predefined values in the form of lookup tables.
eg: mapped motor:
in the below model values are taken from experiments or old data
Implements a mapped motor and drive electronics operating in torque control mode. we have to specify electrical torque range with a torque-speed envelope or maximum motor power and torque. Output torque tracks a torque reference demand and includes a motor and drive response time constant. Also have to Specify electrical losses as a single operating point that estimates loss across the operating range, measured loss, or measured efficiency.
DYNAMIC model:
Dynamic models are used when the internal response to a model with respect to its components is needed.
eg. motor model:
in the below model, motor components such as inverter, phase controller, feedback circuits are also modeled.
CHANGING the model type in EV powertrain blocks:
we can use the variant manager in the modeling tab to find the variant systems we have.
right-click on the model you want and use set as Label mode active choice.
In summary,
-
Mapped Models: Mapped models are used when you can represent a system's behavior with predefined values in lookup tables. These tables are typically based on experimental or historical data. For example, a mapped motor model would specify electrical torque ranges, torque-speed envelopes, or maximum motor power and torque based on measured data. This approach simplifies the model but may not capture detailed internal dynamics.
-
Dynamic Models: Dynamic models are used when you need to simulate the internal response of a system and its components. In a dynamic motor model, components like inverters, phase controllers, and feedback circuits are explicitly modeled. This provides a more detailed and accurate representation of the system's behavior but is computationally more intensive.
2.How does the model calculate miles per gallon? Which factors are considered to model fuel flow?
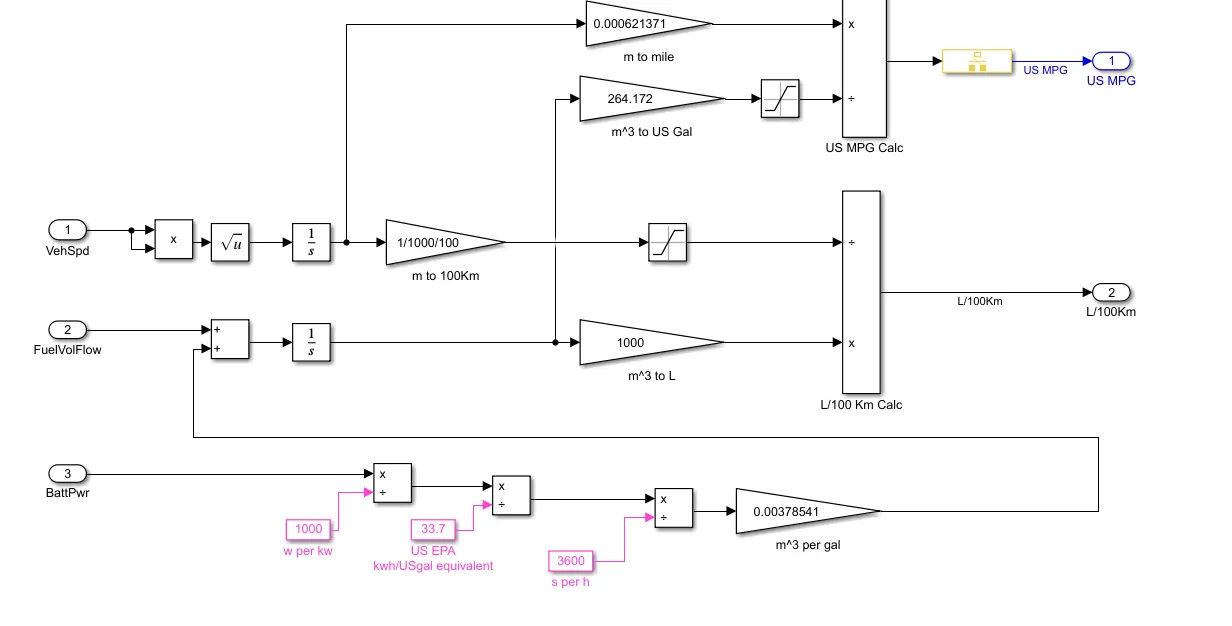
Simulink block to calculate miles per gallon.
- vehicle speed data is used to calculate the distance traveled in meters which is then converted to miles
- Battery power data is used to find power used in kWh which is then converted to gasoline-equivalent using US EPA value by dividing with 33.7
- note: As per the US environmental protection agency(EPA) 1 gallon of gasoline is equal to 33.7 kWh
- Dividing distance traveled in miles by the number of gallons, we can get miles per gallon.
- For HEV this gallon(gasoline-equivalent of battery power) is added with gallon used by IC engine then miles per gallon is calculated.
3.Run the HEV ReferenceApplication with WOT drive cycle. Change the grade and wind velocity in the environment block. Comment on the results.
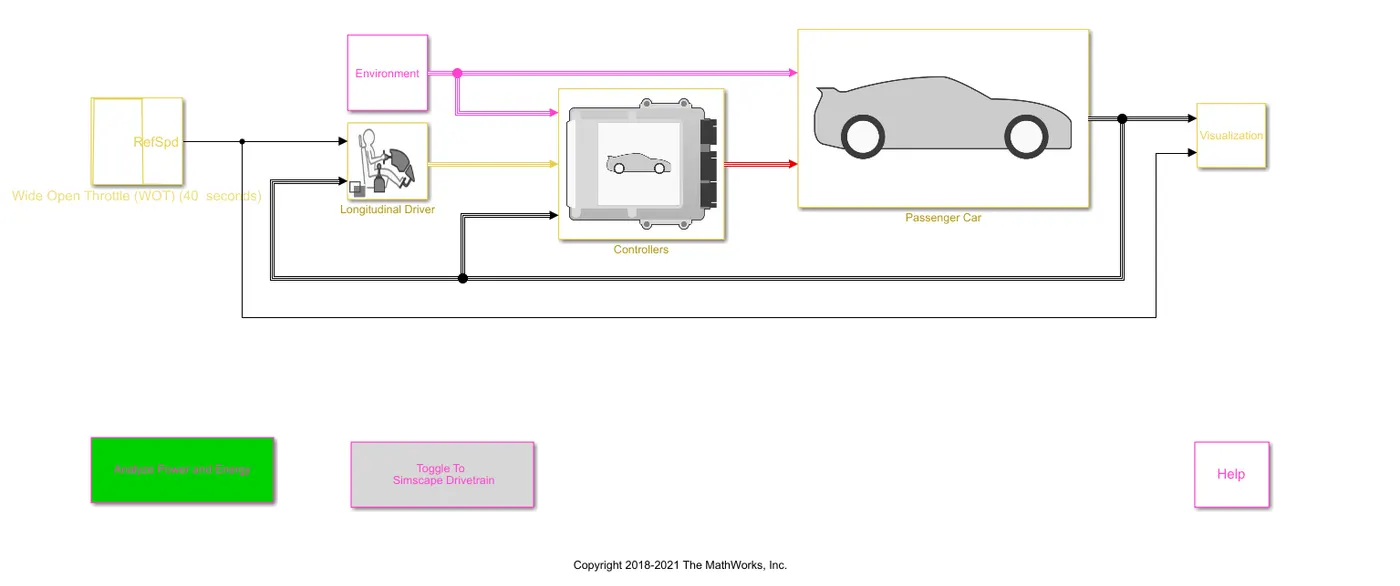
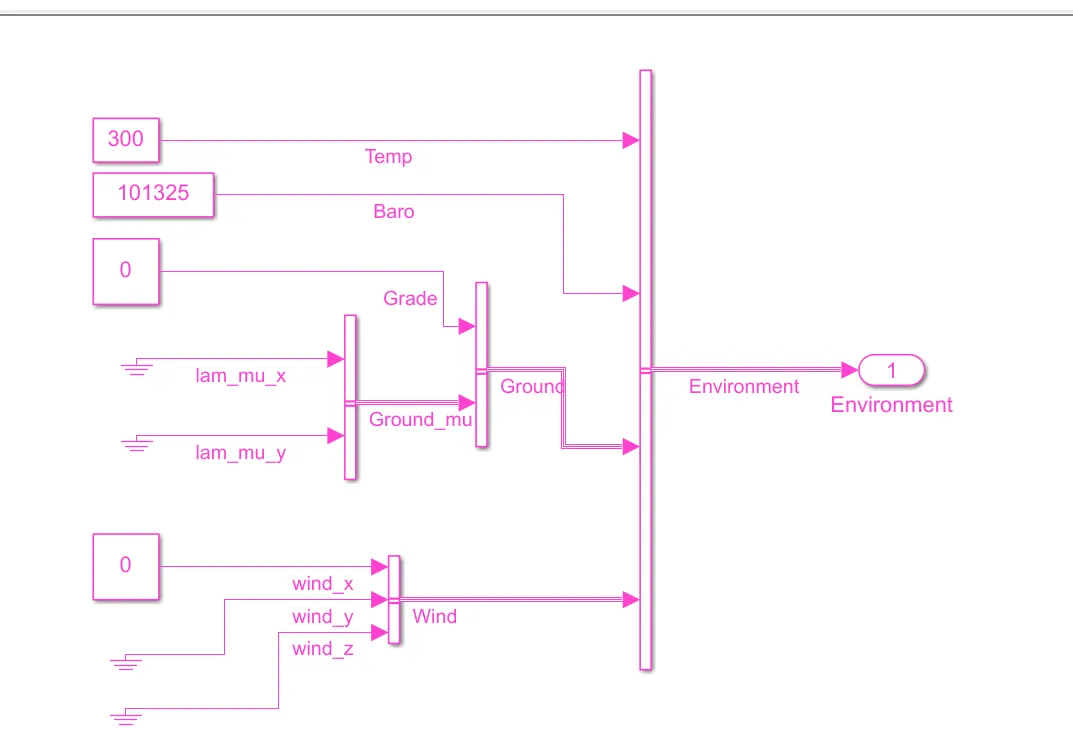
Grade - 0, wind velocity 0m/s
Grade - 5, wind velocity 10m/s
Grade - 15, wind velocity 30m/s
RESULTS:
with the increase in grade and wind velocity,
- peak velocity achieved is reduced as gradient force and aerodynamic force becomes dominant.
- fuel economy is also reduced because the distance traveled is reduced due to external forces.
- deceleration time is reduced so batter recharging capacity is also reduced.
- Battery SOC at the end of WOT acceleration is similar but during deceleration battery is charged more is the grade and wind velocity is less.
Impact of Grade and Wind Velocity on HEV Performance:
-
Grade 0, Wind Velocity 0m/s: This represents ideal conditions with no external forces. The vehicle performs optimally, achieving peak velocity and better fuel economy.
-
Grade 5, Wind Velocity 10m/s: As the grade (gradient) increases and wind velocity becomes a factor, the vehicle faces additional resistance. This results in reduced peak velocity, decreased fuel economy, and less battery recharging during deceleration.
-
Grade 15, Wind Velocity 30m/s: With even steeper grades and higher wind velocity, the external forces become dominant. The vehicle struggles to achieve peak velocity, leading to poorer fuel economy and reduced battery recharging during deceleration.
4.Keeping all other parameters the same, compare the simulated results of hybrid and pure electric powertrains.
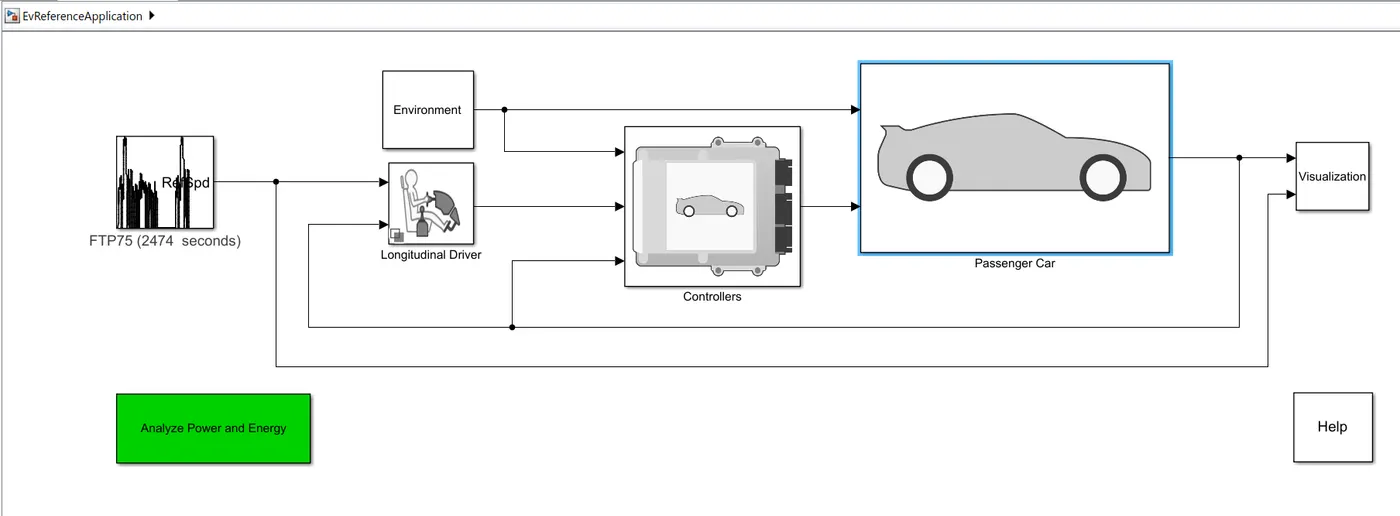
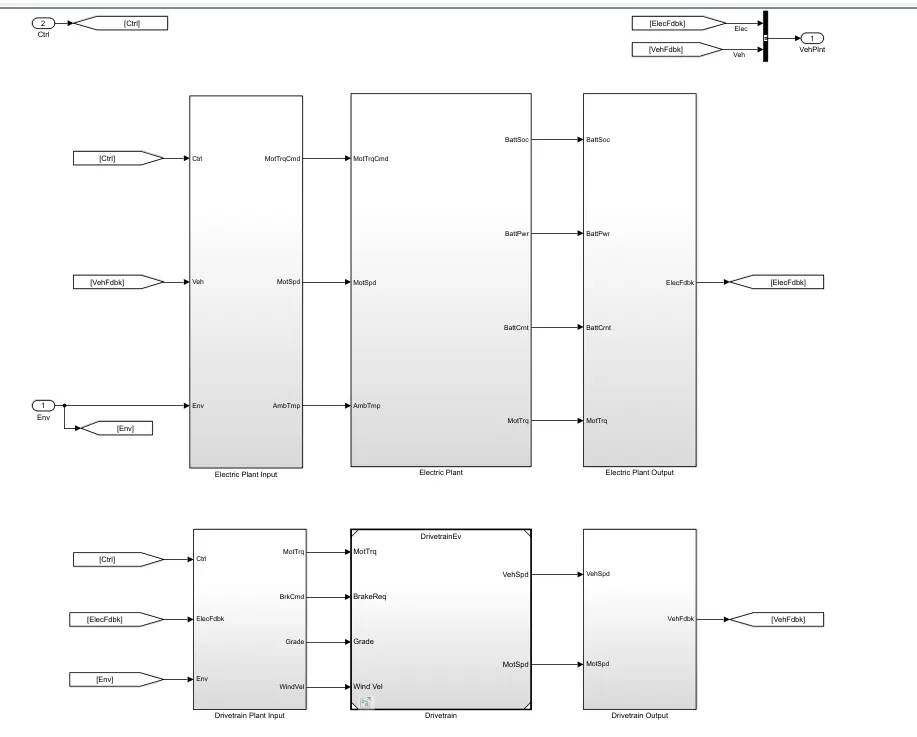
Simulation conditions:
simulation is done for 50 seconds and the 40 seconds WOT drive cycle is used with wot acceleration for 0-30 seconds achieving a max speed of 26.8m/s and decelerates for 10 seconds (30-40).
EV model powertrain configuration:
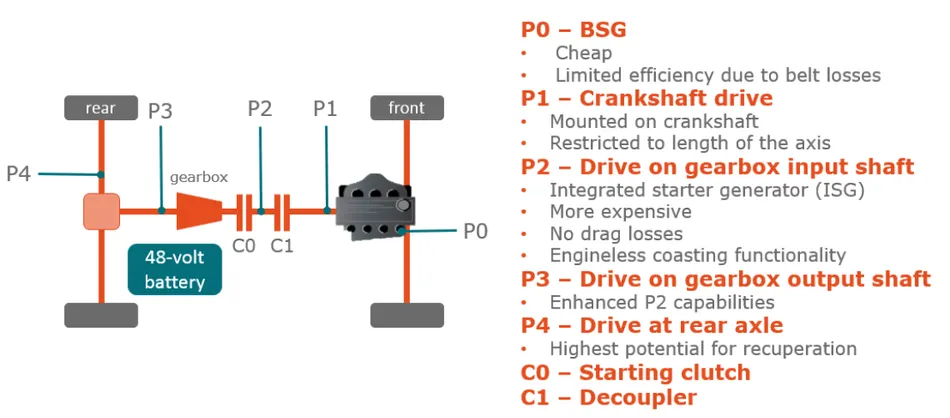
HEV p2 model:
HEV p2 model is chosen because the configuration is similar to our EV model
Results:
1.EV model
2.HEV P2 Model
Comparison of Hybrid (HEV) and Pure Electric (EV) Powertrains:
-
Time to Peak Velocity: HEV achieves peak velocity faster than EV, likely due to the combined power sources (IC engine and electric motor) in the HEV.
-
Deceleration Time: HEV has a longer deceleration time due to more moving frictional parts. EV, with fewer moving parts, decelerates more quickly.
-
Fuel Economy: EV tends to have better fuel economy compared to HEV because it relies solely on the electric motor, which has fewer frictional losses and higher efficiency.
In summary, the choice between HEV and EV depends on factors like desired acceleration performance, energy efficiency, and the availability of charging infrastructure. EVs are more efficient and better suited for environments with frequent deceleration, while HEVs can provide faster acceleration and have longer deceleration times due to the combination of power sources.