Week-11 Challenge: Braking
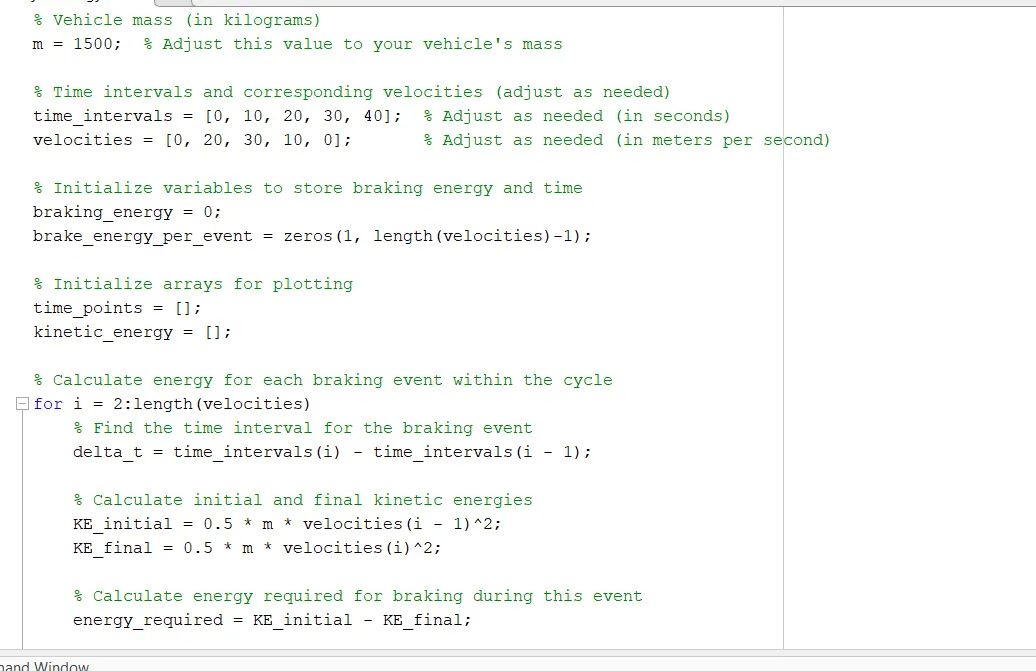
- For a defined driving cycle, calculate the energy required for braking.
-
Calculate Kinetic Energy: The kinetic energy (KE) of a moving vehicle can be calculated using the following formula:
KE = 0.5 * m * v^2
Where:
- KE is the kinetic energy (in joules)
- m is the mass of the vehicle (in kilograms)
- v is the velocity of the vehicle (in meters per second)
Calculate the kinetic energy of the vehicle at the beginning and end of each braking event in the driving cycle.
-
Calculate Energy Difference: To find the energy required for braking during each event, subtract the initial kinetic energy from the final kinetic energy:
Energy Required for Braking = KE_initial - KE_final
Repeat this calculation for each braking event in the driving cycle.
-
Sum Up the Braking Energies: Add up the energy required for braking for all the braking events in the driving cycle to get the total energy required for braking over that cycle.
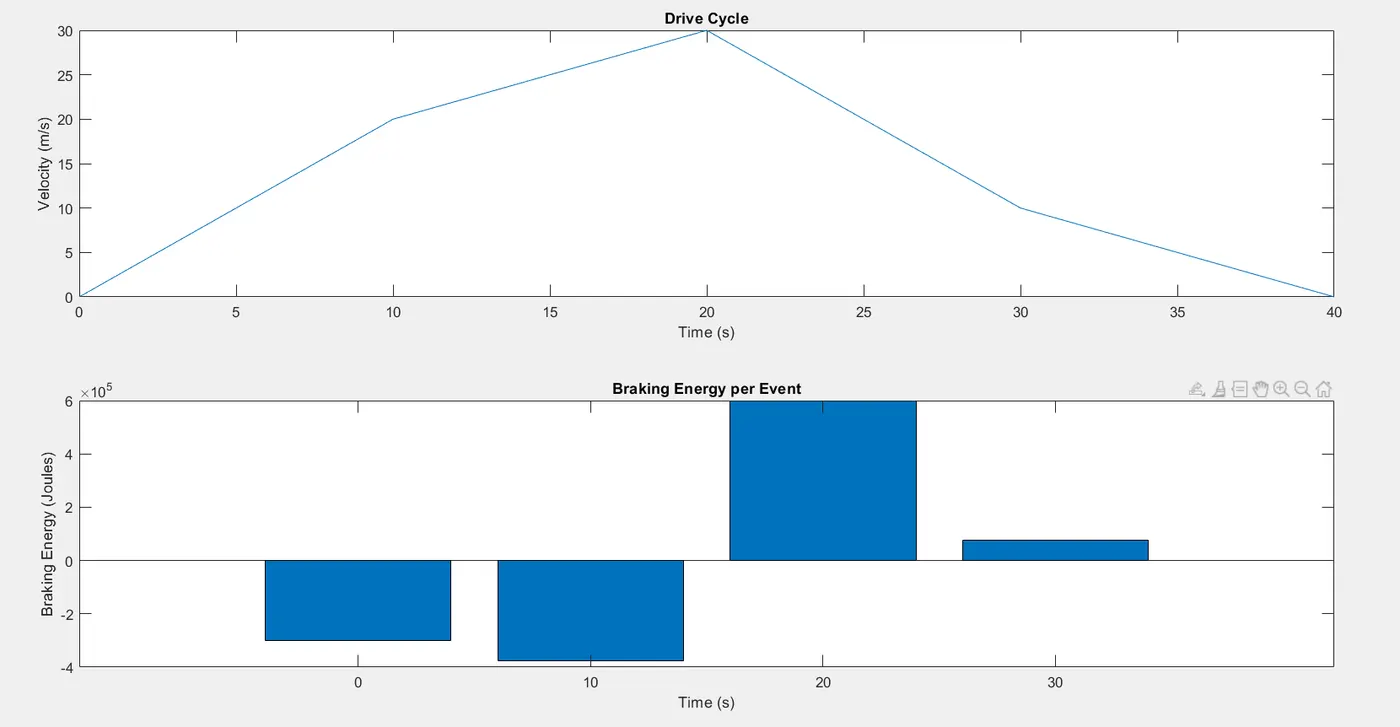
Calculation done in matlab for assumed drive cycle. m file attached
- Why electric motor can’t develop braking torque at high speed similar to starting? How electric and mechanical brakes are coordinated?
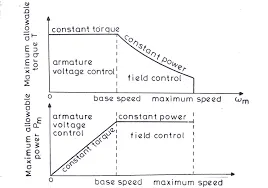
Speed-Torque Characteristics:
Electric motors, including DC motors, exhibit specific speed-torque characteristics. These characteristics illustrate how the motor performs at different speeds and torque levels. In the explanation, two key regions are mentioned:
-
Constant Torque Region: At low speeds, the motor can provide a constant level of torque. This region is typically encountered during starting or acceleration, where the motor needs to overcome inertia and provide sufficient torque to accelerate a vehicle, for example.
-
Constant Power Region: Beyond a certain critical speed, the motor enters a region where the torque it can deliver decreases as speed increases. This is often referred to as the constant power region. In this region, the motor can still provide power but at the expense of reduced torque. This region is relevant during high-speed operation.
Acceleration vs. Deceleration:
The explanation highlights the difference between acceleration (positive torque) and deceleration (negative torque or braking). During acceleration, the motor operates in the constant torque region, providing high torque at low speed to accelerate the vehicle. However, during deceleration or braking, the motor operates in the constant power region. Here, it has lower torque capabilities at high speeds.
The key point is that the motor's ability to provide torque is limited at high speeds during braking. It cannot generate the same level of torque at high speed as it does during acceleration because it's operating in the constant power region. This phenomenon is due to the motor's design and limitations and is a fundamental characteristic of electric motors.
the difference between acceleration (positive torque) and deceleration (negative torque or braking). During acceleration, the motor operates in the constant torque region, providing high torque at low speed to accelerate the vehicle. However, during deceleration or braking, the motor operates in the constant power region. Here, it has lower torque capabilities at high speeds.
The key point is that the motor's ability to provide torque is limited at high speeds during braking. It cannot generate the same level of torque at high speed as it does during acceleration because it's operating in the constant power region. This phenomenon is due to the motor's design and limitations and is a fundamental characteristic of electric motors.
Coordination of Electric and Mechanical Brakes:
To manage the braking process effectively, electric vehicles (EVs) often use a combination of regenerative braking (electric) and mechanical braking (friction brakes like disc brakes). There are two main strategies for coordinating these braking systems:
-
Series: In this strategy, the brakes are applied one after the other, either using regenerative braking first and then mechanical braking or vice versa. It's a sequential approach where one type of brake is used at a time.
-
Parallel: In the parallel strategy, both regenerative and mechanical brakes are applied simultaneously, providing maximum braking force. This approach aims to capture as much energy as possible through regenerative braking while also ensuring strong deceleration with the mechanical brakes.
Regenerative braking is an energy-saving feature in electric and hybrid vehicles that converts kinetic energy back into electrical energy and stores it in the vehicle's battery. The control strategy for regenerative braking is a critical aspect of optimizing its effectiveness. Here's a complete regenerative braking control strategy:
1. Driver Input Detection:
The control strategy begins by monitoring the driver's input through the brake pedal and/or throttle position. The system needs to determine whether the driver is intending to slow down or stop the vehicle.
2. Vehicle Speed and State of Charge (SOC) Monitoring:
The vehicle's speed and the state of charge (SOC) of the battery are continuously monitored. These parameters are crucial for determining the optimal level of regenerative braking.
3. Regenerative Braking Engagement:
When the control system detects that the driver intends to slow down or coast (by releasing the throttle or pressing the brake pedal), it engages regenerative braking.
4. Regenerative Braking Level Control:
The control system modulates the level of regenerative braking based on several factors:
-
Driver's Brake Input: If the driver presses the brake pedal lightly, the regenerative braking system may initially engage at a lower level. A stronger brake pedal application results in a higher regenerative braking level.
-
Battery SOC: The control system considers the state of charge of the battery. If the battery is almost fully charged, the regenerative braking level may be limited to avoid overcharging.
-
Vehicle Speed: Regenerative braking levels are adjusted based on the vehicle's speed. At higher speeds, more regenerative braking can be applied.
-
Road Conditions: Some systems use information about road conditions and terrain to adjust regenerative braking. For example, if the vehicle is descending a steep hill, more regenerative braking may be applied.
5. Transition to Mechanical Brakes:
As the vehicle slows down and the regenerative braking becomes less effective (e.g., at very low speeds or when the battery is fully charged), the control system smoothly transitions to using mechanical (friction) brakes to bring the vehicle to a complete stop if necessary. This transition should be imperceptible to the driver.
6. Energy Management:
The control strategy also involves energy management. Excess energy generated during regenerative braking is converted to electrical energy and stored in the battery. The system optimizes this process to avoid overcharging and maximize energy efficiency.
7. Regenerative Braking Off:
Regenerative braking is disengaged when the driver accelerates or when it's not needed, such as during constant-speed cruising.
8. Integration with Other Vehicle Systems:
Regenerative braking is integrated with other vehicle systems, including the motor controller, battery management system (BMS), and braking control unit. These systems work together to ensure safe and efficient operation.
9. Regenerative Braking Feedback:
Some vehicles provide feedback to the driver, such as through regenerative braking indicators on the dashboard or haptic feedback through the brake pedal, to inform them of the regenerative braking level and the amount of energy being recovered.
Overall, a well-designed regenerative braking control strategy is essential for maximizing energy efficiency in electric and hybrid vehicles while providing a smooth and seamless driving experience for the driver.
Electric Driven Intelligent Brake (EDIB):
Nissan has developed a practical brake strategy called "ELECTRIC DRIVEN INTELLIGENT BRAKE" (EDIB), which is used in the Nissan Leaf and likely other Nissan electric vehicles. EDIB is designed to optimize braking performance and energy regeneration. It achieves this by controlling the regenerative brake and friction brake simultaneously, allowing for natural braking force that corresponds to the driver's input while maximizing energy regeneration.
In summary, the explanation highlights the speed-torque characteristics of electric motors, the difference between acceleration and deceleration torque, and the coordination of electric and mechanical brakes in electric vehicles. EDIB represents an advanced brake control strategy used by Nissan to enhance braking performance and energy efficiency in their electric vehicles.
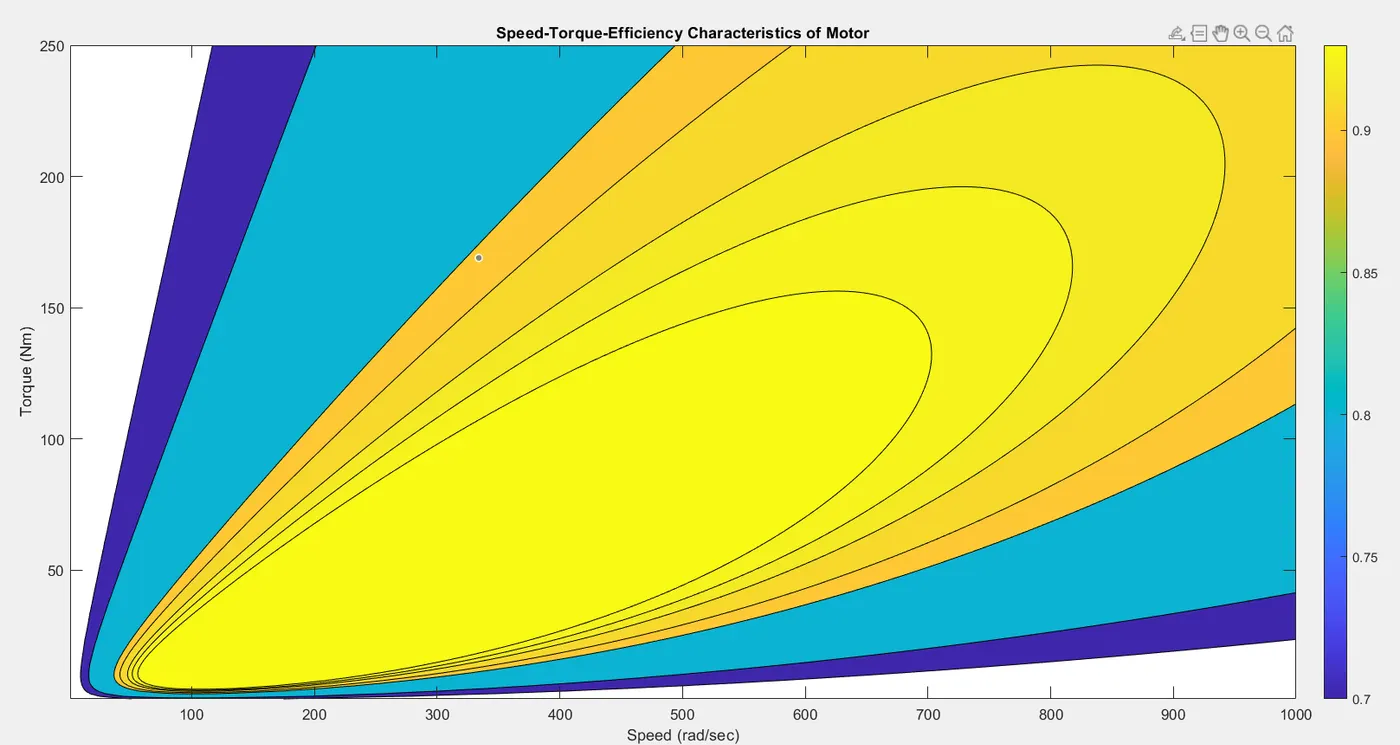
3. Make a MATLAB program which plots contour of given motor speed, torque and efficiency values. Attach the code as a .m file attach a screenshot of all the plots.
The MATLAB code provided generates a speed-torque-efficiency contour plot for an electric motor, which is a valuable visualization for understanding how the motor's efficiency varies with different torque and speed combinations.
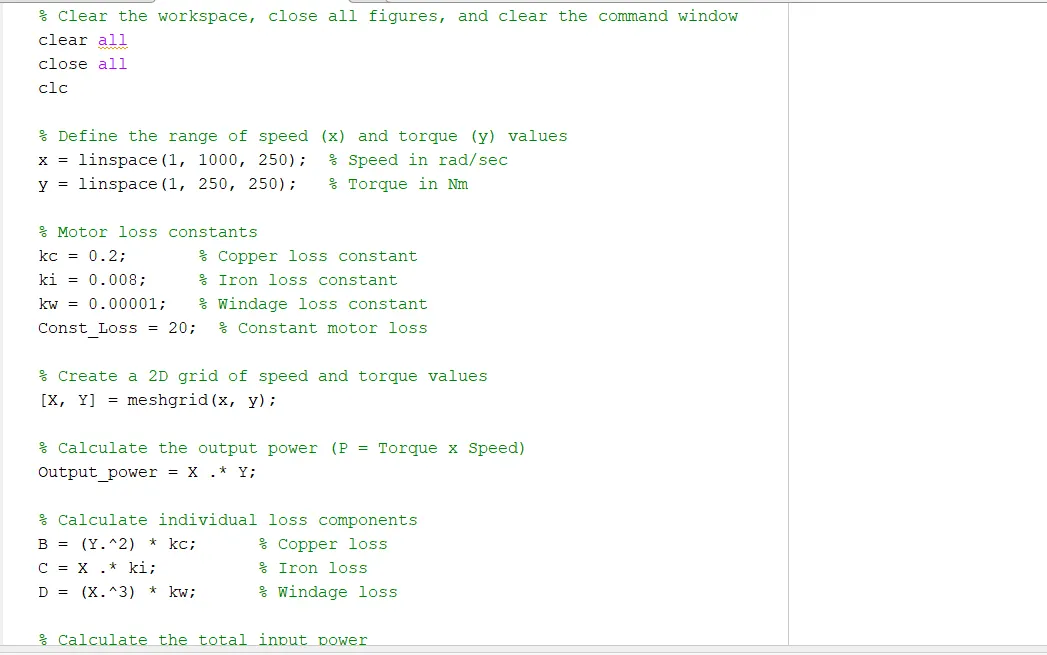
% Clear the workspace, close all figures, and clear the command window
clear all
close all
clc
�fine the range of speed (x) and torque (y) values
x = linspace(1, 1000, 250); % Speed in rad/sec
y = linspace(1, 250, 250); % Torque in Nm
% Motor loss constants
kc = 0.2; % Copper loss constant
ki = 0.008; % Iron loss constant
kw = 0.00001; % Windage loss constant
Const_Loss = 20; % Constant motor loss
% Create a 2D grid of speed and torque values
[X, Y] = meshgrid(x, y);
�lculate the output power (P = Torque x Speed)
Output_power = X .* Y;
�lculate individual loss components
B = (Y.^2) * kc; % Copper loss
C = X .* ki; % Iron loss
D = (X.^3) * kw; % Windage loss
�lculate the total input power
Input_power = Output_power + B + C + D + Const_Loss;
�lculate motor efficiency
Efficiency = Output_power ./ Input_power;
�fine efficiency levels to be plotted
V = [0.70, 0.80, 0.90, 0.91, 0.92, 0.925, 0.93];
% Customize the plot appearance
box off; % Turn off plot box
grid off; % Turn off grid lines
% Create a filled contour plot of efficiency with specified levels
contourf(X, Y, Efficiency, V);
�dacolorbar to the plot
colorbar;
% Set plot title and axis labels
title('Speed-Torque-Efficiency Characteristics of Motor');
xlabel('Speed (rad/sec)');
ylabel('Torque (Nm)');