Week-4 Challenge WOT Condition Part-2
1- What is the difference between mapped and dynamic model of engine, motor and generator? How can you change model type?
|
Difference Between Mapped and Dynamic Model |
|
|
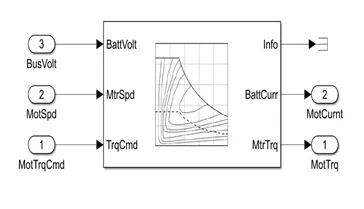
Mapped model: · In this model the data regarding the components are preloaded in the lookup tables. · Mapped model represents macro behavior as set of lookup tables. · Mapped model is easy to construct. · Gathering information to load in look up table is difficult. |
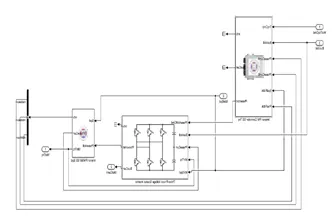
Dynamic Model: · Dynamic model decomposes behavior in to several individual components that results in analyzing and designing of the components. · In this Dynamic model we can find out the performance of each component. · Gathering different physical model is difficult compared with mapped or simple dynamic models. |
 |
 |
|
Advantages: If the data of the components are available with us periorly its easy to simulate models. The mapped model is also known as gobal based model |
Advantages: The detail analysis of the component is done accordingly. Performance of the component can be developed and it can be improved further. The dynamic model is also known as real time based model. |
|
Disadvantages: Gathering information about each and every parameter of the model is difficult |
Disadvantages: Difficult to construct the mathematical model. |
|
Motor: Data like torque power, torque range, speed data has to be provided to do simulation. |
Motor: The simulation for the component done as per the real world Component. the inputs for the permenant magnet synchonus Machine(PMSM) controller,three phase invertor and PMSM are has to give to simulalte the component. |
|
Engine: The data like rpm,power,etc. should be entered in to the lookup table to get symulation. |
Engine: Physical model of the component get installed with required input data provided.
|
|
Generator: Specification for the battery current, rotor torque, etc. data should be given to get simulated. |
Generator: inputs for the each component of Generator should mentiond. The components are physical simscape models. Not every data provided should be correct in this case, Some assumptons should be considered. |
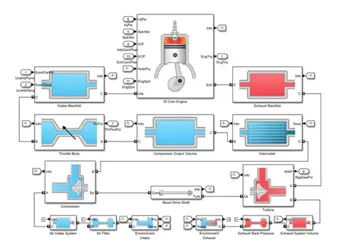
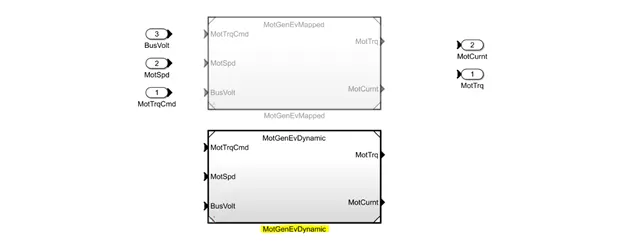
The two models mapped and dynamic models are given but only one of them are considered to simulate the entire model.
Types of Models in This Mathematical Model are:
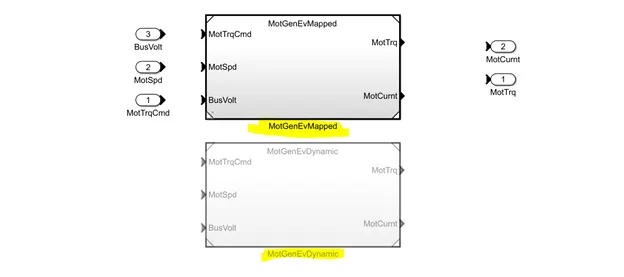
In above image it is shown that the both models like mapped and dynamic models, but the mapped is activated/considered to be simulated.
To change the model type in this mathematical model we need to follow some steps.
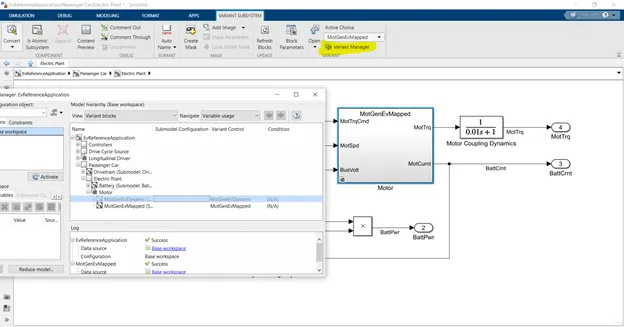
As shown in the above picture we have to go into variant manager to change the priority.
Variant manage->left click on MotGen-Dynamic->click on Set as label model active
The above steps should be followed to set as dynamic model.
2- How does the model calculate miles per gallon? Which factors are considered to model fuel flow?
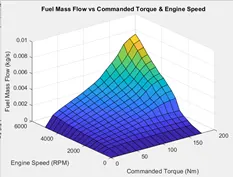
Volume of fluid flow when increase in the engine speed and torque is shown in above image, in this every data is mapped one, so we need to know the data to simulate the model.
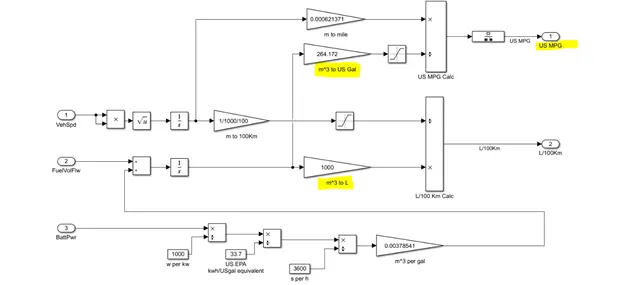
In this mathematical model 246.172 gallons of fuel is taken to drive vehicle
If we convert the above gallons of fuels into liters
1 gallon of fuel=3.785liters
246.172 gallons of fuel = 1000 liters of fuel
In the above picture it is shown that rate of fuel flow/volume of fuel is converted into liters of fuel
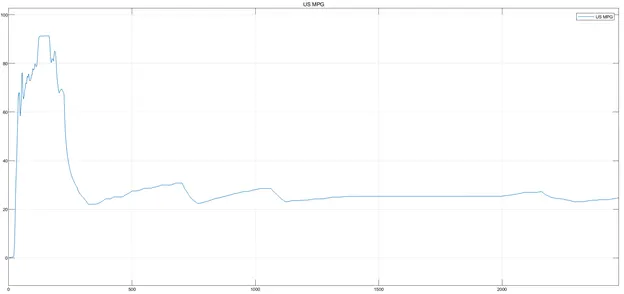
The above image shows the distance travel by the vehicle with required liters of fuel, The final fuel efficiency is calculated by keeping in consideration of the battery output.
3- Run the HEV Reference Application with WOT drive cycle. Change the grade and wind velocity in the environment block. Comment on the results.
HEV Reference Application with WOT drive cycle:
Parameters consider in WOT drive cycle:
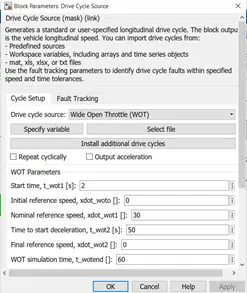
In the below image explained about the Fuel Economy, Battery State of Charge, Battery Current, Trace Velocity, Engine speed, Engine torque.
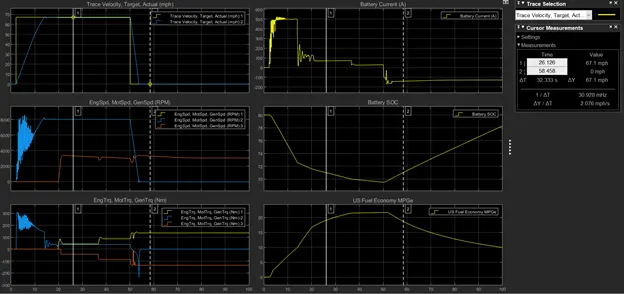
Layout 1:
In this plot it shows vehicle reached to max speed of 67mph and actual velocity of the vehicle meets the trace velocity at 67mph but with some time difference.
Actual velocity of the vehicle does not follow the path of trace velocity of the vehicle.
Layout 2:
Engine speed is shown in plot 2, this plot gives detailed analysis about engine and motor speed in form of Rpm.
The max speed reached by the engine is 8360Rpm.
Layout 3:
This gives the detailed analysis about the engine torque, motor torque and generation torque. We know that the product of Rpm and torque results the Power of the vehicle.
Where it tells when the torque is going negative and positive, this information tells when the battery power is getting regenerated.
Layout 4:
This gives the detailed analysis about the battery current. In this plot it shows how much current it provides during acceleration, constant and deceleration phases undergone by the vehicle.
Layout 5:
This gives the detailed analysis about the Battery state of charge.
Layout 6:
This gives information about the fuel economy of the vehicle at each speed.
Change the grade and wind velocity in the environment block:
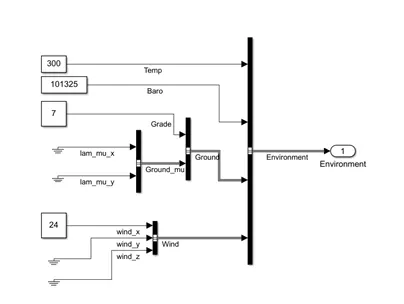
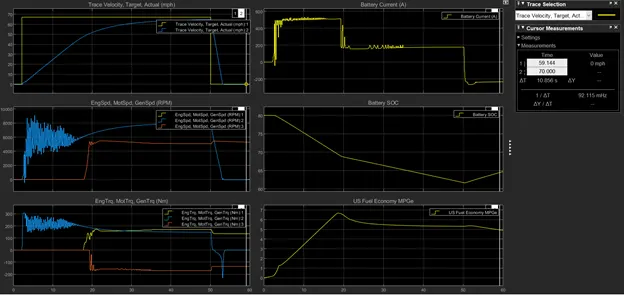
In this mathematical model the gradeability is changed from 0-7 rad and the wind speed is changed from 0-24m/s
In this model the main changes are shown in battery Soc, battery current and fuel economy.
The fuel consumption of the vehicle is more compared with the 0 rad gradeability.
Discharge of the battery is more due to change in the gradeability and wind flow.
4- Keeping all other parameters same, compare the simulated results of hybrid and pure electric powertrains.
Simulated results of Electric vehicle:
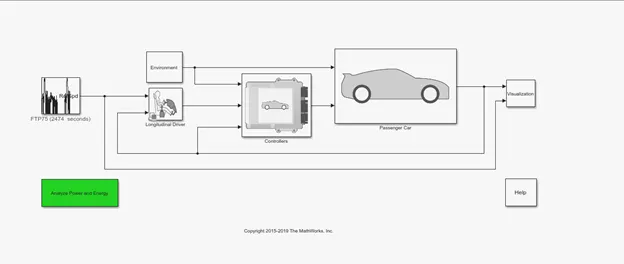
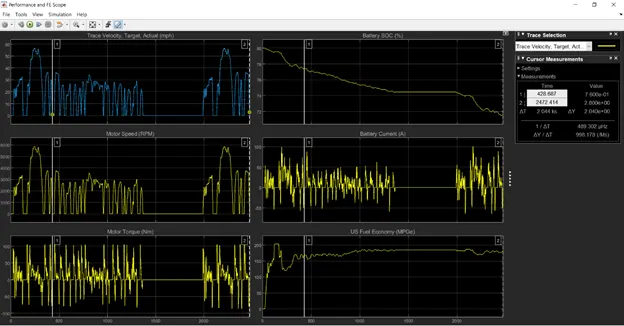
In this above shown image the simulation of Electric-Vehicle has done. We can see the scope results of EV.
In this simulation FTP (Federal Test Procedure) drive cycle is used to find out the battery Soc and Efficiency of the vehicle.
The increase and decrease of the motor torque and battery currents are observed.
Simulated results of Hybrid Electric-vehicle:
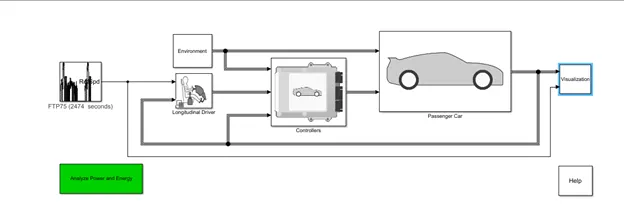
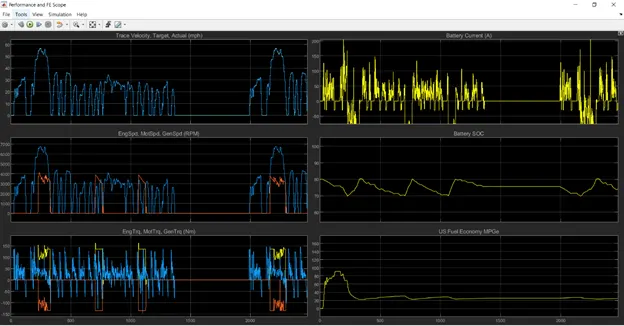
In this simulation FTP (Federal Test Procedure) drive cycle is used to find out the battery Soc and Efficiency of the vehicle.
The above shown simulation is Series- Parallel hybrid vehicle with CI/SI Engine. From the results of EV and HEV we conclude that the HEV has better Battery SOC compared with EV Battery Soc.
Obviously Electric vehicle has better fuel economy than the Hybrid electric vehicle.