Week-4 Challenge WOT Condition Part-2
WEEK - 4 CHALLENGE WOT CONDITION PRT 2
- 1) WHAT IS THE DIFFERANCE BETWEEN MAPPED AND DYNAMIC MODEL OF ENGINE, MOTOR AND GENERATOR HOW YOU CAN CHANGE THE MODEL.
SOL:-
MAPPED MODEL:
Mapped motor block implements a mapped motor and drive electronics operating in torque control mode
It uses steady state tables to look up tables to characterize engine performance
The model takes engine or motor speed and torque inputs and generates the required output torque based on the lookup table, without considering the real time condition.
The output values generated are stored for the corresponding input values
It takes very less time for simulation and results are not accurate
DYNAMIC MODEL:
This model not only takes the inputs but also takes feedback from the generated output. So that the demand power is achieved. Thus the model generates output as demanded considering the real time conditions as well
It takes long time for simulation and results are accurate
It contains, interior PM controller, three phase voltages source inverter and internal permanent magnets synchronous machine all combination gives EV dynamic
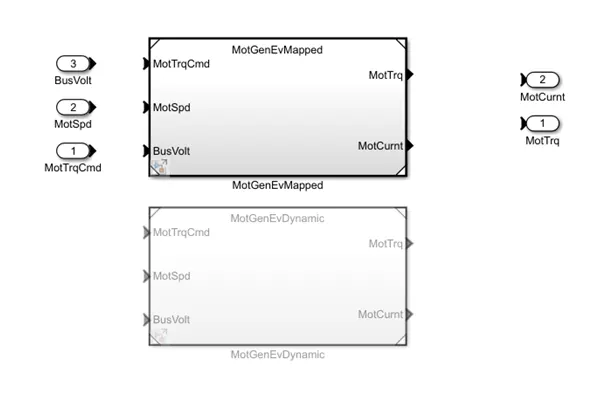
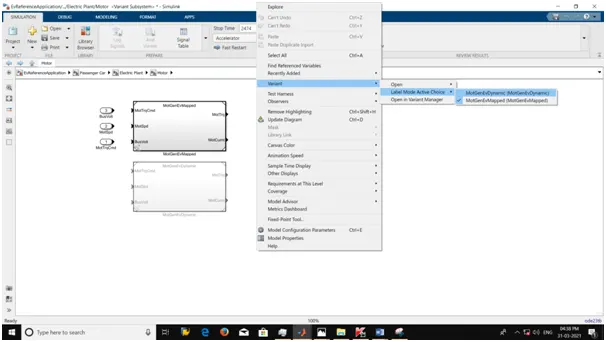
Changing of model type as shown in below:
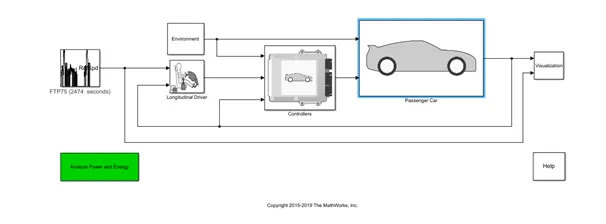
Open electric vehicle reference Simulink model
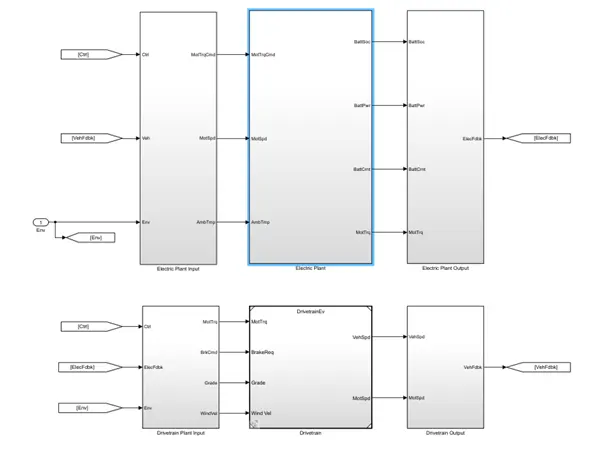
Open passenger car subsystem in that it contains drive train, electric train plant input and output block
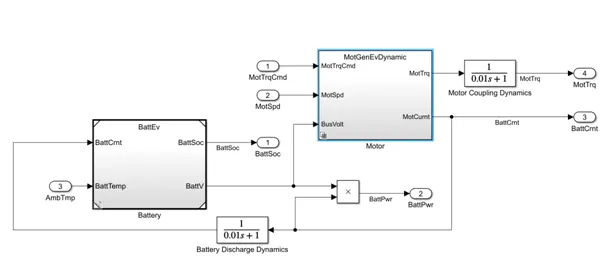
Open electric plant that contains battery, motor and other components
In that, select mapped motor

2) HOW DOES MODEL CALUCCALATE METERS PER GALLON? WHICH FACTORS ARE CONSIDERD TO MODEL FUEL FLOW?
SOL:-
MILLES PER GALLON.
Miles per gallon. Miles per gallon (MPG) is a distance measured in miles fuel economy rating determined by how how far a car can travel on a gallon of gasoline or diesel.
It is the primary measurement of cars fuel efficiency
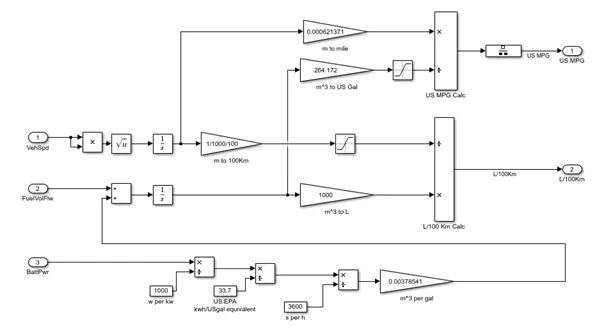
Here, three inputs are taken into consideration
- Vehicle speed
- Fuel flow
- Battery power
To calculate the fuel flow, vehicle speed & battery power are taken into consideration.
The above MPG calculations are for hybrid electric vehicle which means it contains both fuel & battery energy
The vehicle speed inputs are in m/s which is converted into miles by multiplying with 0.000621371
The kilogram fuel is converted into cubic metre by multiplying 1/(1000*0.739)
The cubic metre is now converted into gallons by multiplying it with 264.172 the mile value and gallon value is used to find MPG of the vehicle
We will get battery power in watts which is converted in Kwatts afterwards converted into kwh
Then it is converted into US gallon equivalent energy by dividing it by standard value 33.7 then it is converted into US gallon per second
It is multiplied by standard value 0.00378541 to get the volume in metre cube per gallon & it is added to fuel flow for total value as its HEV further metre cube is converted into US gallon
Finally, MPG is calculated by dividing US gallons by miles
3) RUN THE HEV REFERENCE APPLICATION WITH THE WOT DRIVE CYCLE. CHANGE THE GRADE AND WIND VELOCITY IN THE ENVIONRMENT BLOCK.
SOL:-
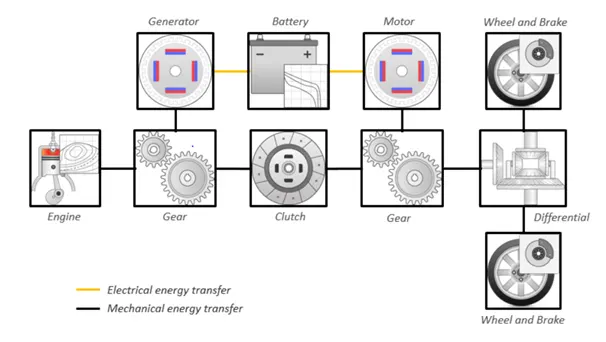
Open HEV Reference Application Model with WOT:-
Open Simulink Model for HEV:-
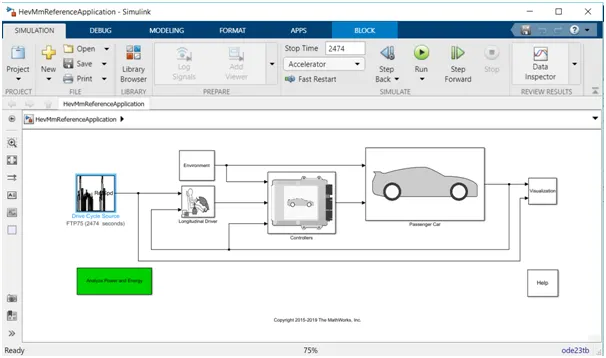
Simulation: I
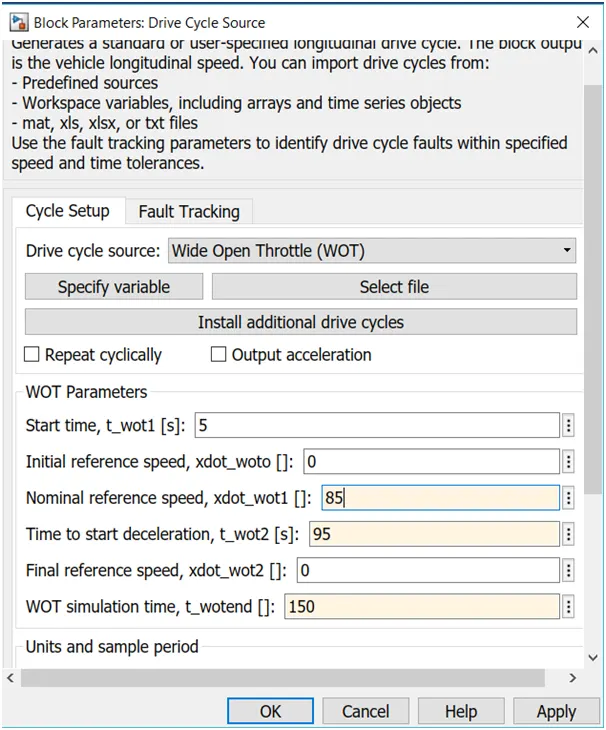
Change the Drive Cycle Source to wide open Throttle (WOT)
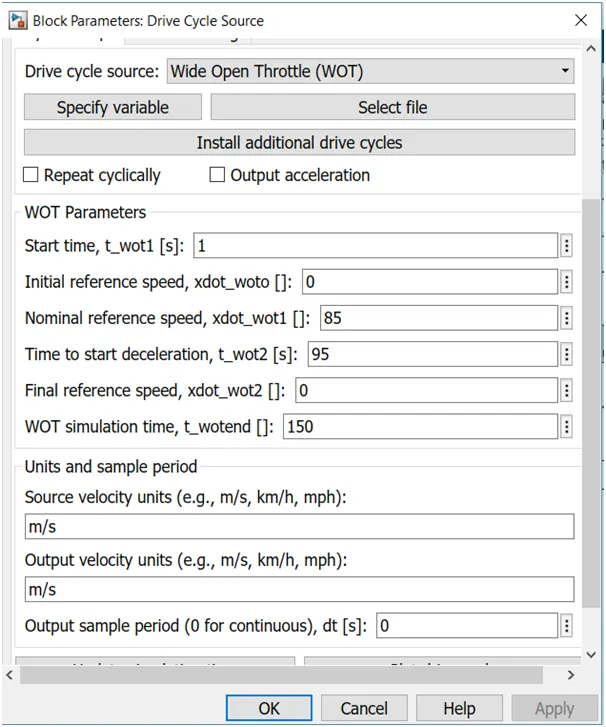
In wide open Throttle condition change parameters as shown below
- Total cycle time = 150 seconds
- Total speed of the vehicle = 85 mph
- Time to start deceleration = 95 seconds
- The Grade angle = 0 degrees
- Wind velocity = 0 m/s
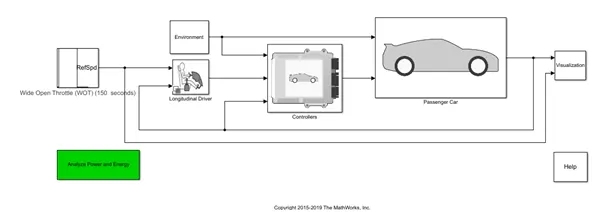
Now run the Simulation
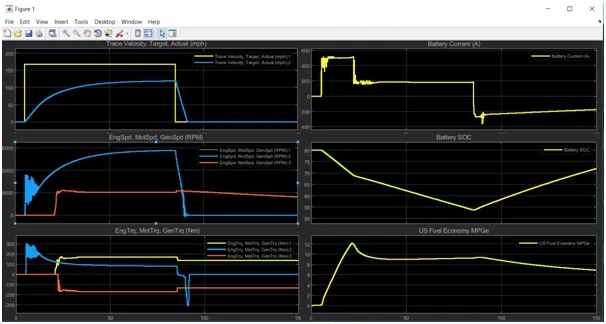
Results of simulaton I
Simulation: II
- Total cycle time = 150 seconds
- Total speed of the vehicle = 85 mph
- Time to start deceleration = 95 seconds
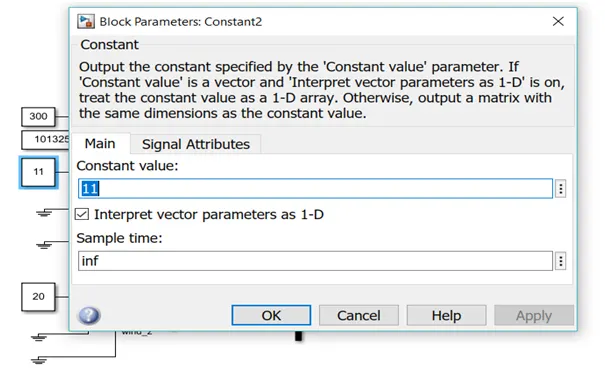
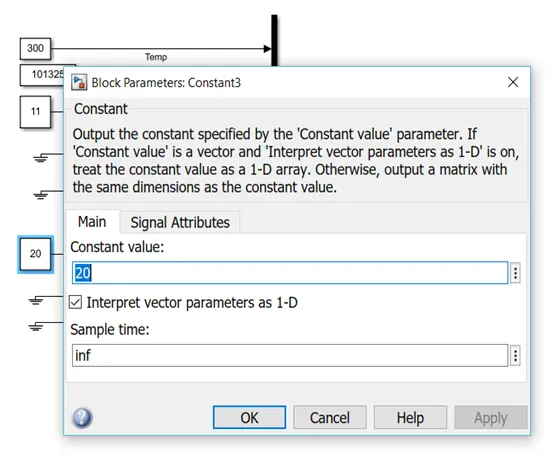
- The Grade angle = 11 degrees
- Wind velocity = 20 m/s
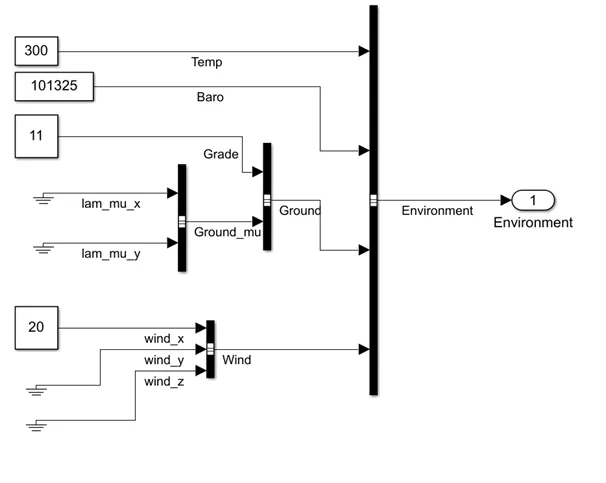
Change the grade angle and wind velocity in the Environment block as shown in below
Now run the simulation
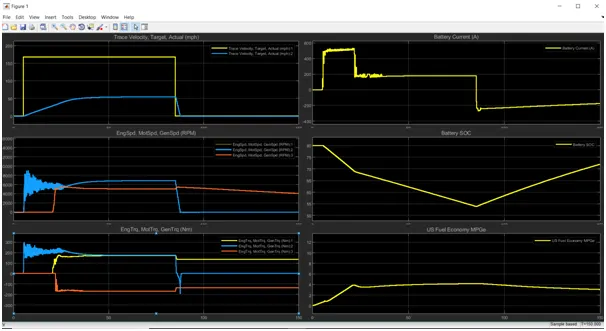
Results of simulation II
Results:
From above results, we can see difference between simulation I & simulation II
Vehicle parameters and drive cycle condition is same but for simulation II we have made changes in environment block
Observations:
By changing the grade angle, value and wind velocity the smooth performance of the vehicle is not achieved.
There is a change in vehicle speed it could not achieve its top speed by changing the parameters in the environment block i.e. grade angle and wind velocity
Fuel economy is to decreased to half of the simulation I in simulation I it is near to 9 and in simulation II it value is 4
Engine speed is gone up to nearly 14000 rpm in simulation I condition and in simulation, II its valve is 6800 rpm due grade angle
As battery is used to start, torque will also be at maximum position for the motor until vehicle reaches its maximum position once vehicle reaches its constant speed so torque requirement will reduce. When there is deceleration torque, value becomes negative and battery is going to charge
4) KEEPING ALL THE PARAMETERS THE SAME, COMPARE THE SIMULATED RESULTS OF HYBRID AND PURE ELECTRIC POWER TRAINS
SOL:-
Open EV Reference Application Model with WOT
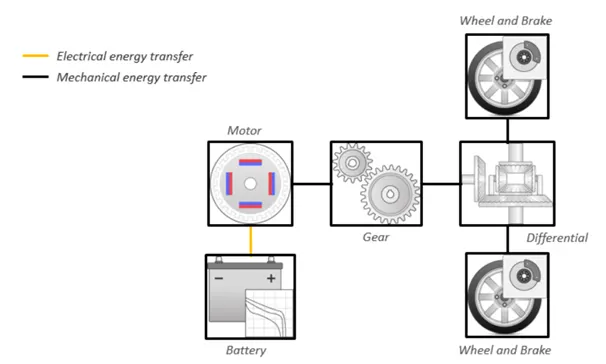
Open simulink model of EV
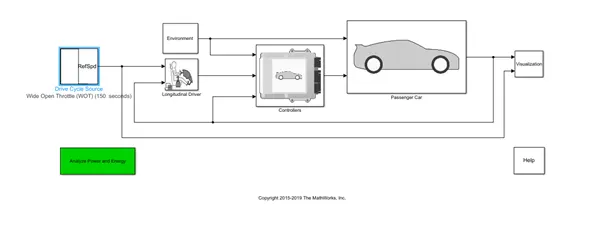
Go to Drive Cycle Source and change it to wide open Throttle (WOT) & Change the block parameters as following
- Total cycle time = 150 seconds
- Total speed of the vehicle = 85 mph
- Time to start deceleration = 95 seconds
Open Environment block
Change the grade angle and wind velocity in the Environment block as shown in below
- The Grade angle = 11 degrees
- Wind velocity = 20 m/s
Now run the simulation
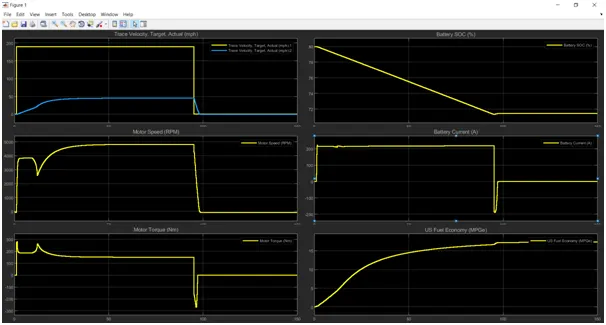
Simulated results of EV
As reference to solution 3 keeping the same parameters of HEV
- Total cycle time = 150 seconds
- Total speed of the vehicle = 85 mph
- Time to start deceleration = 95 seconds
- The Grade angle = 11 degrees
- Wind velocity = 20 m/s
Simulated results of HEV:-
All the input parameters kept same for both Hybrid electric vehicle and pure electric vehicles
Observation:
Speed of Hybrid electric vehicle is higher as compared to pure electric vehicle
Higher fuel economy is achieved by pure electric vehicle
The battery capacity of pure electric vehicle is higher as compared to hybrid electric vehicle
Motor speed RPM is also less as compared to hybrid electric vehicle
Motor torque is almost equal to hybrid electric vehicle
CONCLUSION:
1 differance between mapped and dynamic model engine, motor and generator is explained and changing of model is explained.
2 Caluclation and factors of miles per gallon is explained.
3 WOT drive cycle model of HEV reference is explained along with change in grade angle and wind velocity.
4 comparisation between hybrid electric vehicle and pure electric vehicle is done.