Week 4.1 - Genetic Algorithm
Aim :- Write a program to optimise the stalagmite function using genetic algorithm in matlab.
Objective:-
- Write a program to optimise the stalagmite and find the global maxima of function.
- Explain the concept of genetic algorithm and also the syntax for “ga” in matlab.
- Plot graphs for all 3 studies and for F maximum vs no. of iterations.
THEORY :-
Optimization:-
- It is a procedure which is executed iteratively by comparing various solutions till an optimum or a satisfactory solution is found. These include maximizing factors such as productivity, strength, reliability, efficiency, utilization, etc.
- Optimization is the process of making something better. In any process, we have a set of inputs and a set of outputs as shown in the following figure.
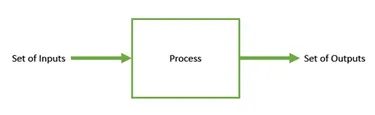
- Optimization refers to finding the values of inputs in such a way that we get the “best” output values. The definition of “best” varies from problem to problem, but in mathematical terms, it refers to maximizing or minimizing one or more objective functions, by varying the input parameters.
- The set of all possible solutions or values which the inputs can take make up the search space. In this search space, lies a point or set of points which gives the optimal solution. The aim of optimization is to find that point or set of points in the search space.
Genetic Algorithm (GA):-
- Genetic Algorithm is a search-based optimization technique based on the principles of Genetics and Natural Selection. It is frequently used to find optimal or near-optimal solutions.
- Genetic algorithm is a search heuristic that is inspired by Charles Darwin’s theory of natural evolution. This algorithm reflects the process of natural selection where the fittest individuals are selected for reproduction in order to produce offspring of the next generation.
- The process of natural selection starts with the selection of fittest individuals from a population. They produce offspring which inherit the characteristics of the parents and will be added to the next generation. If parents have better fitness, their offspring will be better than parents and have a better chance at surviving. This process keeps on repeating and at the end, a generation with the fittest individuals will be found.
- In this way we keep “evolving” better individuals or solutions over generations, till we reach a stopping criterion.
Genetic Algorithms are sufficiently randomized in nature, but they perform much better than random local search (in which we just try various random solutions, keeping track of the best so far), as they exploit historical information as well. - You can apply the genetic algorithm to solve problems that are not well suited for standard optimization algorithms, including problems in which the objective function is discontinuous, nondifferentiable, stochastic, or highly nonlinear.
- It is frequently used to solve optimization problems, in research, and in machine learning.
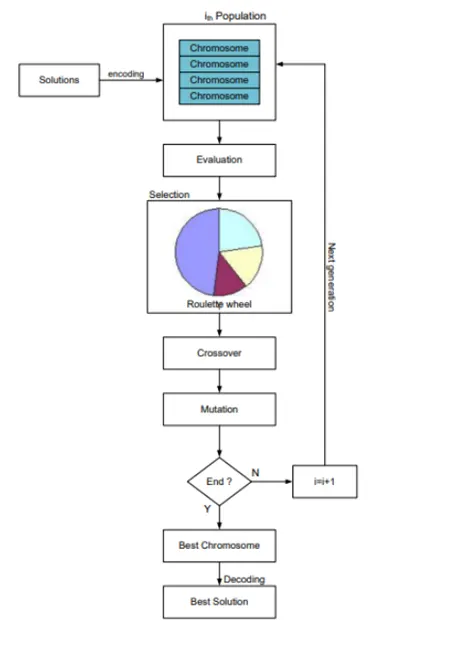
Fig. Flowchart of working of Genetic Algorithm
The following outline summarizes how the genetic algorithm works:
- Initialisation :-
The algorithm begins by creating a random initial population. In the initialisation, first we have to decide the population size. Higher the population size, we will get more combinations, hence we get more accurate results.Population is the number of sample data points taken to perform the genetic algorithm operation.
- Fitness Function:-
Fitness function measures how good your solution is. Fitness function takes the solution as input and produces the
suitability of the solution as the output. This evaluates how close the solution is to the optimal solution of the desired problem.
- Selection:-
The idea is to give preference to the individuals with good fitness scores and allow them to pass there genes to the successive generations. The fitness value of the given function will be computed, the fittest value will have the most probability in the Roulette wheel as shown below.
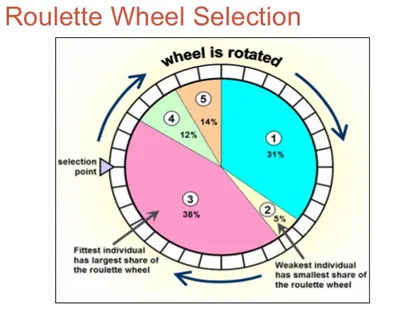
In a roulette wheel selection, the circular wheel is divided with respect to the Fitter individual. A fixed point is chosen on the wheel circumference as shown and the wheel is rotated. The region of the wheel which comes in front of the fixed point is chosen as the parent. For the second parent, the same process is repeated. In this way, Fitter individual have a higher chance of mating and propagating their feature to the next generation.
- Crossover :-
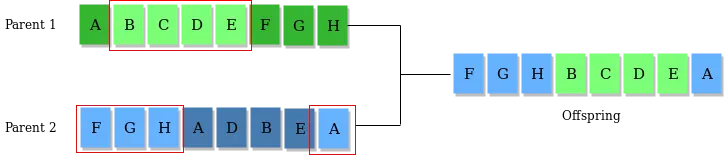
This represents mating between individuals. Two individuals are selected using selection operator and crossover sites are chosen randomly. Then the genes at these crossover sites are exchanged thus creating a completely new individual (offspring).
It is the process of taking two parents and producing the childs from them by interchanging the genes.
eg.
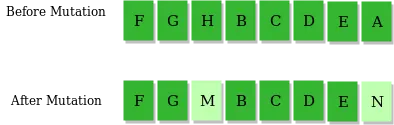
- Mutation:-
Mutation is carried out to maintain the genetic diversity from one generation of a population of chromosomes to the
next. In this process, the genes will be replaced by some random integers.
If mutation is not performed, the chromosomes will become to similar to each other,convergence takes place soon and results in local minima.
eg.
- Stopping Criteria:-
The algorithm terminates if the population has does not produce offspring which are significantly different from the
previous generation. Then it is said that the genetic algorithm has provided a set of solutions to our problem.
OPTIMISATION OF STALGAMITE FUNCTION WITH USAGE OF SYNTAX OF 'ga' :-
Stalgamite function is carried out in three different studies. They are listed below;
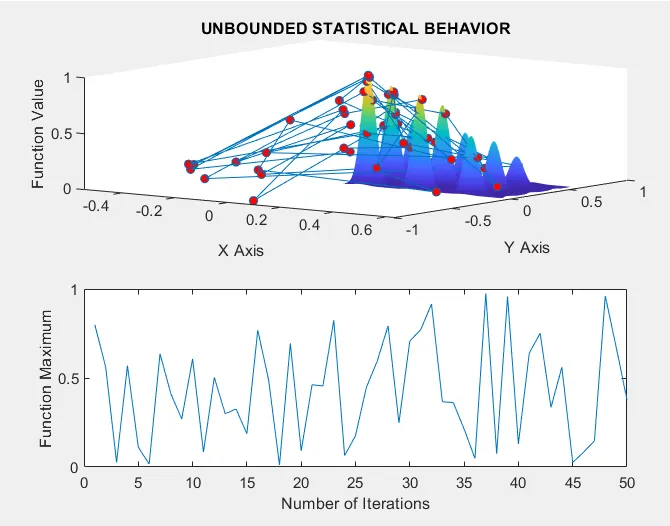
Study 1 : Caliberation under UNBOUNDED STATISTICAL BEHAVIOUR
The range of the genetic algorithm is unbounded and hence the values of global maxima along with the values of x & y are
defined out of the search space.
Syntax:- [x,y] = ga(fun,nvars)
[inputs, fopt1(i)] = ga(@stalagmite,2) -------(% Syntax used in the program)
In the program x & y represents [input, fopt(i)]
fun - The function to be optimised (i.e) stalagmite
navrs - The no.of variables present (i.e. 2 (since x & y there are two variables))
Study 2 : Caliberation under BOUNDED STATISTICAL BEHAVIOUR between upper bounds and lower bounds
The range of the genetic algorithm is bounded by introducing the values of lower & upper bounds and hence the global maxima along with values of x & y is defined within search space.
Syntax:- [x,y] = ga(fun,nvars,A,b,Aeq,beq,lb,ub)
In the program x ,y ,fun ,nvars is same as study 1
A = Linear inequality constraints
b = Linear inequality constraints
Aeq = Linear equality constraints
beq = Linear equaltiy constraints
lb = Lower bounds
ub = Upper bounds
(NOTE : For the above syntax A, b, Aeq, beq '[]' is used in place of them since there are no values for them.
Therefore, syntax used in the program is ga(@stalagmite,2,[],[],[],[],[0;0],[1;1])
Study 3 : Caliberation under BOUND STATISTICAL BEHAVIOUR WITH OPTIMISED OPTIONS BY INCREASING THE NUMBER OF ITERATIONS
To improve accuracy the command optimoptions is introduced for increasing the population. Apart from which everything is
similar to study 2.
Syntax :- [x,y] = ga(fun,nvars,A,b,Aeq,beq,lb,ub,nonlon,IntCon,options)
In the program x ,y ,fun ,nvars ,A ,b ,Aeq ,beq ,lb ,ub is same as study 1 & 2
nonlcon = Non-Linear constraints
intCon = Integer variables
options = Optimisation options (Syntax : options = optimoptions(SolverName))
(NOTE : For the above syntax A, b, Aeq, beq '[]' is used in place of them since there are no values for them same as study 2.
Therefore, syntax used in the program is ga(@stalagmite,2,[],[],[],[],[0;0],[1;1],[],[],options)
Significance of Iterations:-
- The purpose of iteration in GAs is to introduce diversity into the sampled population. They are used in an attempt to
avoid local minimaby preventing the population of chromosomes from becoming too similar to each other, thus slowing or even stopping convergence to the global optimum. - This reasoning also leads most GA systems to avoid only taking the fittestof the population in generating the next
generation, but rather selecting a random set with a weighting toward those that are fitter.
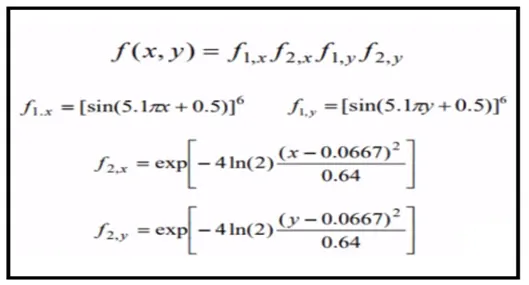
STALAGMITE FUNCTION :-
It is a mathematical function which helps us in determining the Global minima & maxima by implementing a 3D model.
Function for determining the global maxima & minima is given as under;
Program for determining stalagmite function:-
function [f] =stalagmite(input_vector)

x = input_vector(1);
y = input_vector(2);

f1 =(sin(5.1*pi*x + 0.5)).^6;
f2 =(sin(5.1*pi*y + 0.5)).^6;
f3 = exp(-4*log(2)*((x-0.0667).^2)/0.64);
f4 = exp(-4*log(2)*((y-0.0667).^2)/0.64);

f = -(f1*f2*f3*f4);
end
Main Code :-
% To evaluate global maxima and statistical behaviour of stalagmite function using genetic algorithm

clear all;
close all;
clc;

% Creating and storing the data in an array
x = linspace(0,0.6,150);
y = linspace(0,0.6,150);

% Running the code for number of iterations/repeatation
no_of_iterations = 50;

%Creating the 2D mesh array
[xx,yy] = meshgrid(x,y);

% Evaluating the stalagmite function
for i = 1:length(xx)
for j = 1:length(yy)
inputvector(1) = xx(i,j);
inputvector(2) = yy(i,j);
f(i,j) = stalagmite(inputvector);
end
end

surf(xx,yy,-f);
xlabel('X Axis');
ylabel('Y Axis');
zlabel('Function Value');
title('Stalagmite Function');
shading interp;
[x_output, fval] = ga(@stalagmite,2);

%%Study 1 - Caliberation under UNBOUND STATISTICAL BEHAVIOR

tic;  % tic command for calculating iteration time
for i = 1:no_of_iterations
[inputs, fopt1(i)] = ga(@stalagmite,2);
xopt1(i) = inputs(1);
yopt1(i) = inputs(2);
end

study_time_1st_case = toc;

%Plotting
figure(2);
subplot(2,1,1);
hold on;
surf(x,y,-f);
shading interp;
xlabel('X Axis')
ylabel('Y Axis')
zlabel('Function Value')
hold on;
plot3(xopt1, yopt1, -fopt1, 'marker', 'o', 'markersize', 5, 'markerfacecolor', 'r')
title('UNBOUNDED STATISTICAL BEHAVIOR');
subplot(2,1,2);
plot(-fopt1);
xlabel('Number of Iterations');
ylabel('Function Maximum');

%%Study 2 - Calibaration under BOUNDED STATISTICAL BEHAVIOR

tic;
for i = 1:no_of_iterations
[input, fopt2(i)] = ga(@stalagmite,2,[],[],[],[],[0;0],[1;1]);
xopt2(i) = input(1);
yopt2(i) = input(2);
end

study_time_2_2nd_case = toc;

%Plotting
figure(3);
subplot(2,1,1);
hold on;
surf(x,y,-f);
shading interp;
xlabel('X Axis');
ylabel('Y Axis');
zlabel('Function Value');
hold on;
plot3(xopt2, yopt2, -fopt2, 'marker', 'o', 'markersize', 5, 'markerfacecolor', 'r')
title('STATISTICAL BEHAVIOR WITH UPPER AND LOWER BOUNDS');
subplot(2,1,2);
plot(-fopt2);
xlabel('No. of Iterations');
ylabel('Function Maximum');


%%Study 3 - Calibaration under BOUND STATISTICAL BEHAVIOR WITH OPTIMISED OPTIONS
tic;
options = optimoptions('ga');
options = optimoptions(options,'populationsize',250);

for i = 1:no_of_iterations
[input, fopt3(i)] = ga(@stalagmite,2,[],[],[],[],[0;0],[1;1],[],[],options);
xopt3(i) = input(1);
yopt3(i) = input(2);
end

study_time_3rd_case = toc;

%Plotting
figure(4);
subplot(2,1,1);
hold on;
surf(x,y,-f);
shading interp;
xlabel('X Axis');
ylabel('Y Axis');
zlabel('Function Value');
hold on;
plot3(xopt3, yopt3, -fopt3, 'marker', 'o', 'markersize', 5, 'markerfacecolor', 'r');
title('BOUNDED STATISTICAL BEHAVIOR WITH OPTIMISED OPTIONS BY INCREASING ITERATIONS');
subplot(2,1,2);
plot(-fopt3);
xlabel('No. of Iterations');
ylabel('Function Maximum');
Explanation of the code:-
- clear all, close all, clc is executed for smooth working of the program by having a fresh start.
- Values of x & y have been assigned along with no. of iterations. Both the 1 dimensional array is converted into the 2
dimensional array by using the command meshgrid assigned to value xx & yy. - 'for loop' has been used in program the iteration of every single value of xx & yy and writing the input values for the
determined known function 'stalagmite', with the values of i & j. - Now the values of xx, yy & -f are plotted using surf command which generates a 3D plot which is given below in the output section under figure 1.
- Since we need Global Maxima, '-f' has been used instead of 'f' which generates Global Minima.
- Command shading interp is written for smoother looking plot.
- Genetic algorithm 'ga' function is used here fro calculating the values for the stalagmite function predetermined.
Study 1 is now performed with the known syntax of ga explained before in the "THEORY" section. - ga is assigned under for loop which iterates each and every value of the function.
- tic toc command is used to estimate the time taken for the study to calculate and plot the graph.
- plot3 command is used to plot the co-ordinates in 3D space and marker is used to locate those co-ordinates.
- The same xx, yy, -f are plotted with surf command as well as 3plot.
- subplot command is used for printing both the plots in the same figure window.
Now the same part is executed for study 2 & study 3 as well with a small alteration regarding the syntax of ga for both the studies. - Syntax for all the studies have been explained before in the THEORY section.
- All the plots are now plotted for different values of xopt, yopt & fopt.
Output :-
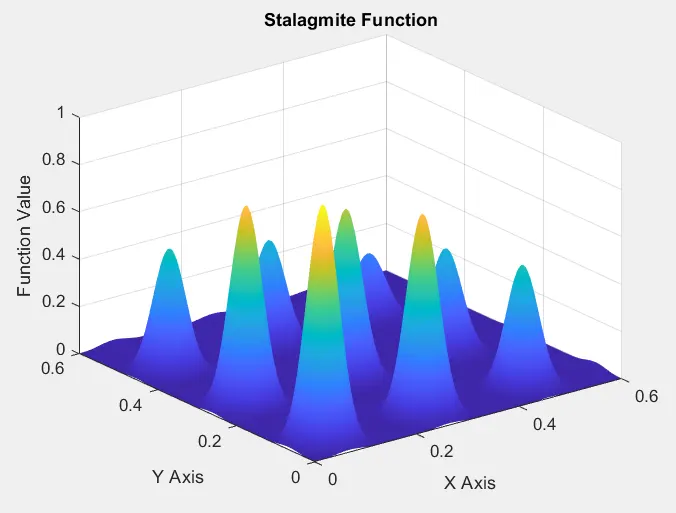
figure 1
Study 1:- Caliberation under UNBOUNDED STATISTICAL BEHAVIOUR
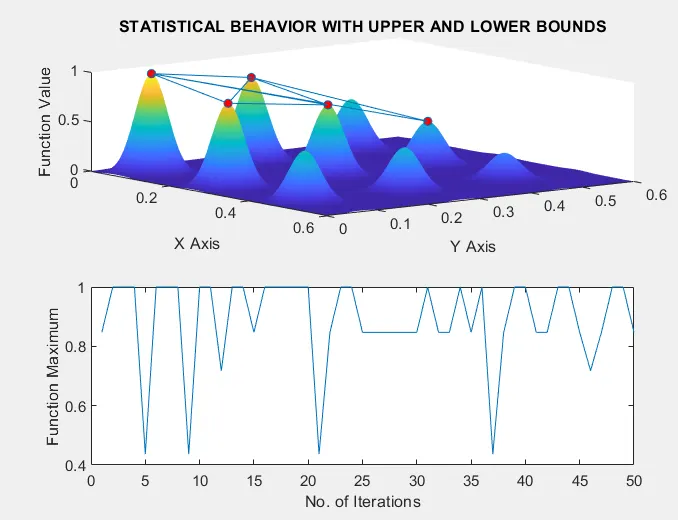
Study 2:- Caliberation under STATISTICAL BEHAVIOUR WITH UPPER AND LOWER BOUNDS
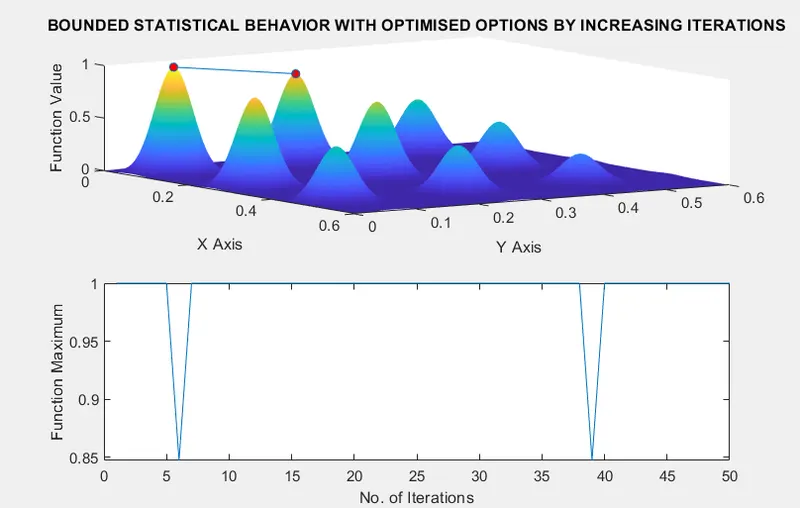
Study 3:- Caliberation under BOUNDED STATISTICAL BEHAVIOUR WITH OPTIMISED OPTIONS BY INCREASING ITERATIONS
Workspace :-
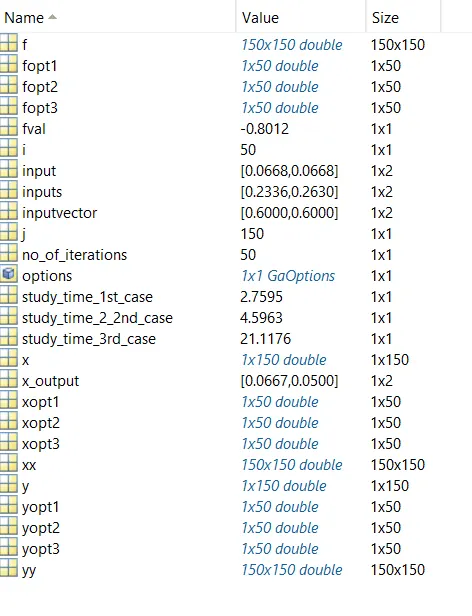
Results of all the 3 studies along with the main stalagmite function and output values in workspace is shown above.
In study 1, 2 & 3
Top Plots : Here the surf command with location of global maxima with respect to each iteration for each studies is shown.
Bottom Plots : The value of Global Maxima varying over different Iterations is plotted for each study.
RESULTS:-
By re-running the program the results of studies 1 & 2 varied unlike study 3 which was ideal for every run.
So from the above results, in order to find the Global maxima, population has to be increased to get the desired output, so
we can conclude that study 3 is the most accurate one.
Study 2 & 1 is followed by that in decreasing order.
Time Taken for Study 1 = 2.7595
Time Taken for Study 2 = 4.596283200000000
Time Taken for Study 3 = 21.117639200000000
REFERENCES:
1.https://in.mathworks.com/discovery/genetic-algorithm.html
2. https://in.mathworks.com/help/gads/genetic-algorithm.html
3. https://in.mathworks.com/help/gads/how-the-genetic-algorithm-works.html