Week 12 - Final Project - Modelling and Analysis of a Datacenter
Objective:
- Use macros to create computer room air conditioning units (CRACs), server cabinets, power distribution units (PDUs), and perforated floor tiles in the data center.
- Organize the model using groups.
- Include effects of gravity and turbulence in the simulation.
- Define object-specific meshing parameters.
- Create contours, particle traces, iso-surfaces to better understand the airflow patterns and temperature stratification within the datacenter space.
Theory:
A data centre is a building, a dedicated space within a building, or a group of buildings used to house computer systems and associated components, such as telecommunications and storage systems.
Since IT operation are crucial for business continuity, it generally includes redundant or backup components and infrastructure for power supply, data communication connections, environmental controls (e.g., air condition, fire suppression), and various security devices. A large data center is an industrial-scale operation using as much electricity as a small town.
Geometry:
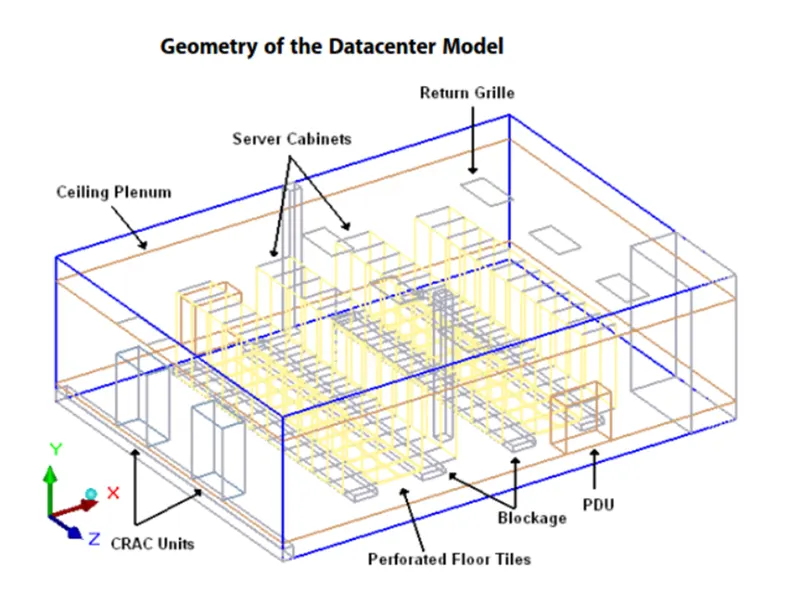
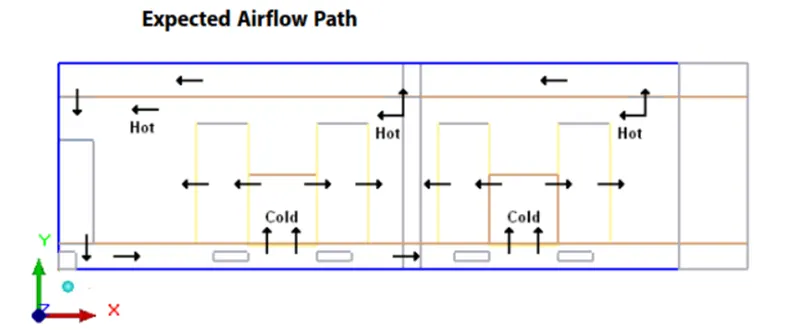
This tutorial considers a 1200 sq. ft. data center with a slab to slab height of 12 ft. The data center consists of a 1.5 ft underfloor plenum and a 2 ft ceiling plenum. The CRACs discharge cold air into the underfloor plenum. The cold air enters the main data center space mainly through the perforated floor tiles and returns back to the air conditioning units. The cooling load, as summarized as below. Size and Capacity of Heat Sources in Data center corresponds to the heat output from the server cabinets and the PDUs. A PCB board, library files and traces are imported to create the model. The model is first solved for conduction only, without the components and then solved using the actual components with forced convection.
|
Heat Source |
Size |
Power |
|
Server Cabinet |
2 ft x 3 ft x 7 ft |
3000 W |
|
High Density |
2 ft x 3 ft x 7 ft |
7000 W |
|
PDU |
4 ft x 2 ft x 5 ft |
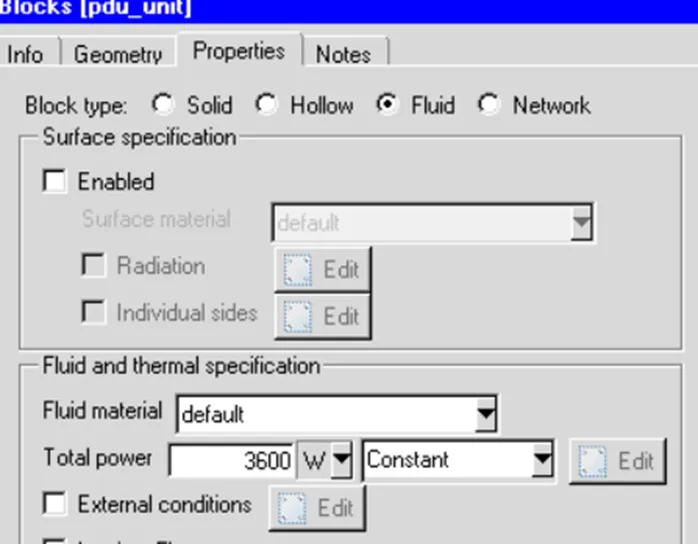
3600 W |
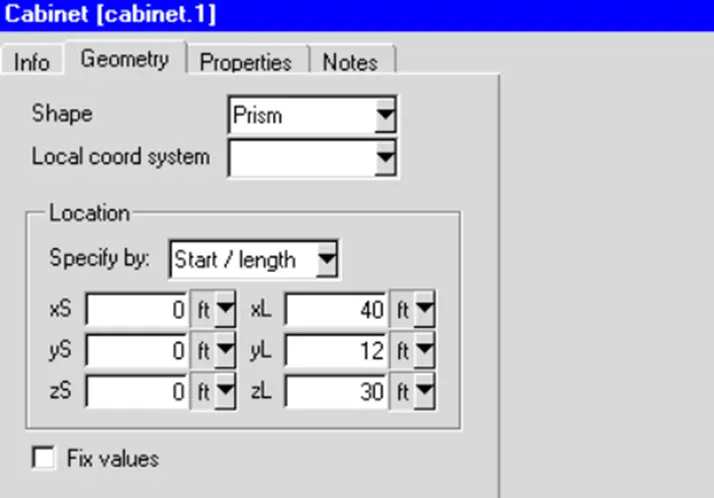
Cabin modelling:
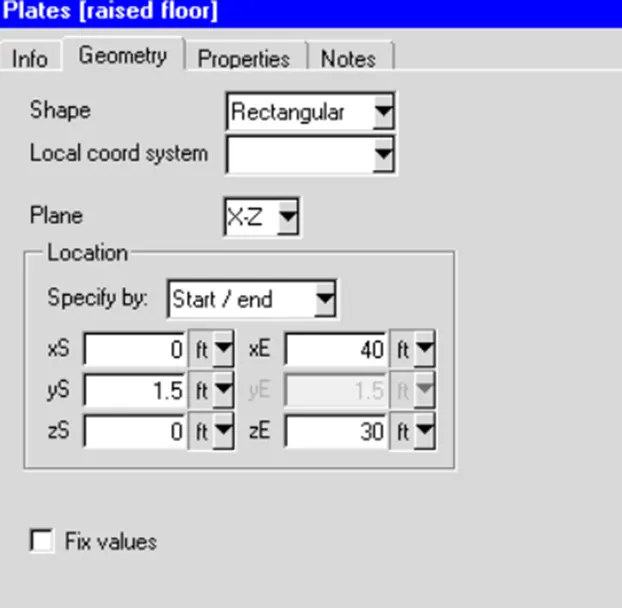
Raised floor modelling:
CRAC unit modelling:
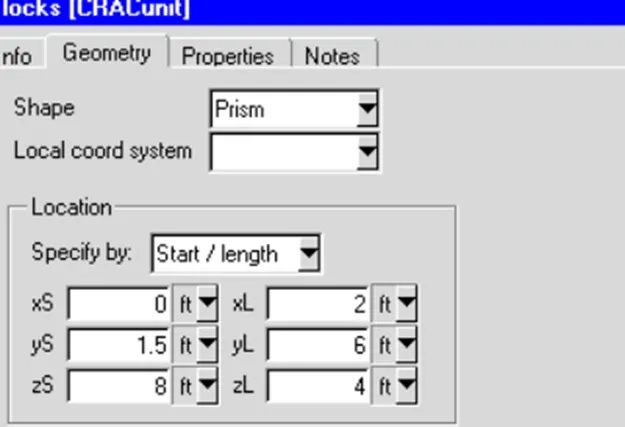
Select crac module from data centre macros.
Flow direction -y
Mass flow 15.9lbm/s
Temp 55F
Create group name crac and translate the entire group in z direction of 10ft
RACK modelling:
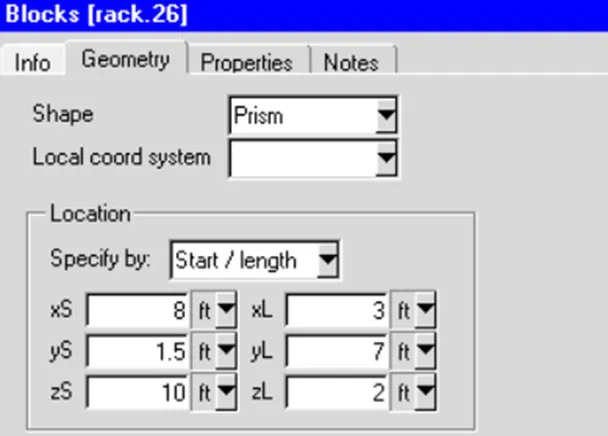
Flow direction x axis
Heat load 3000W
Volume flow 450cfm
No of racks 11
HD racks modelling:
Flow direction x axis
Heat load 7000W
Volume flow 100cfm
TILE modelling:
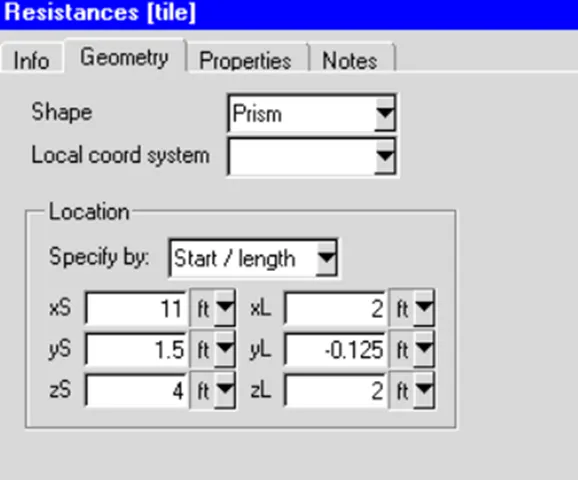
No of tiles 11
Create similar tiles at 2ft and 14 ft
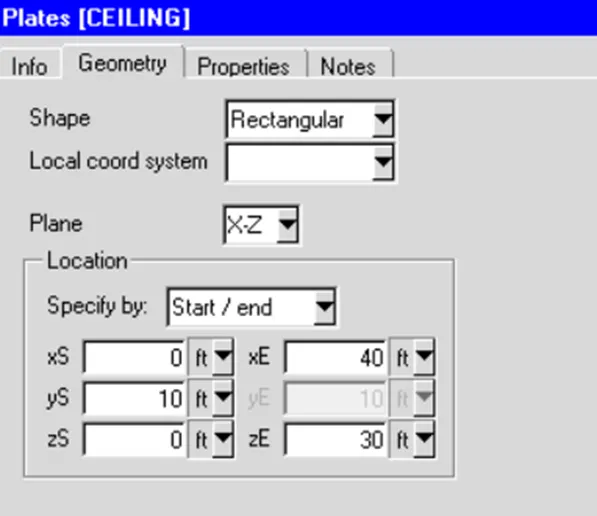
Ceiling modelling:
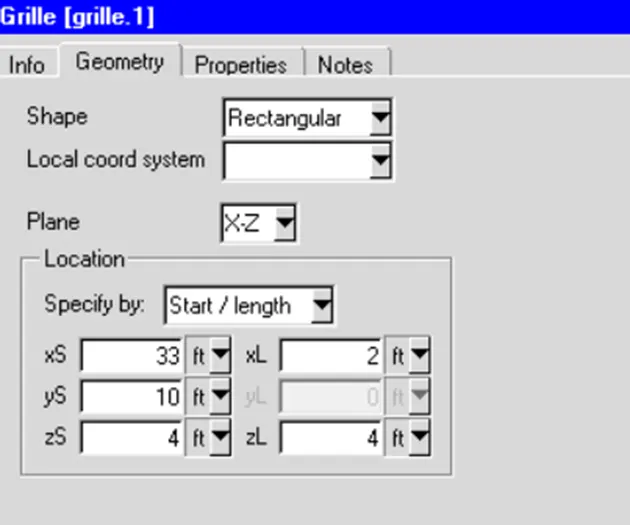
Grille modelling:
Free air ratio:0.5
Create 2 copies of grille at location of 9ft in z axis
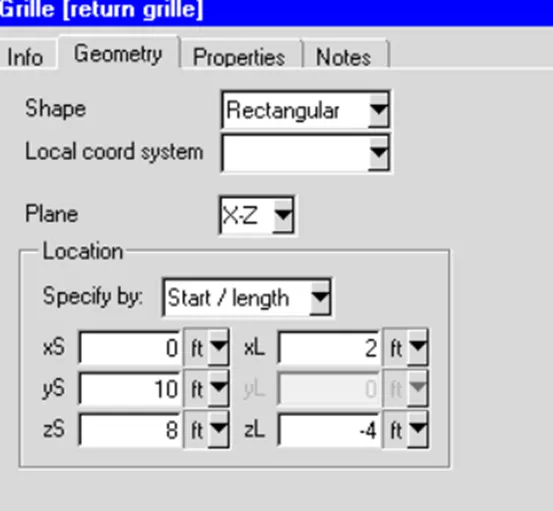
Return grille modelling:
Free air ratio:0.5
Create 1 copy of grille at location of 10ft in z axis
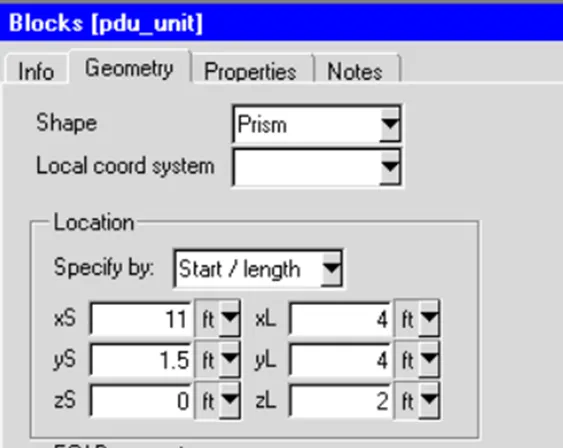
PDU modelling:
Select PDU from data centre macros
Create a copy of PDU translating at x by 14ft and z by 28 ft
Pipe modelling:
Type- hollow
Group blockage
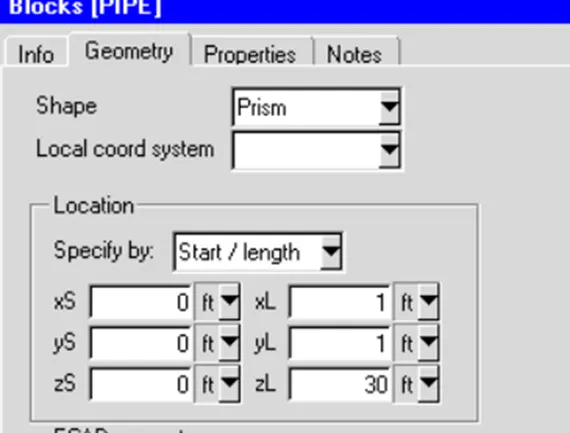
Create another blockage with the given dimensions below
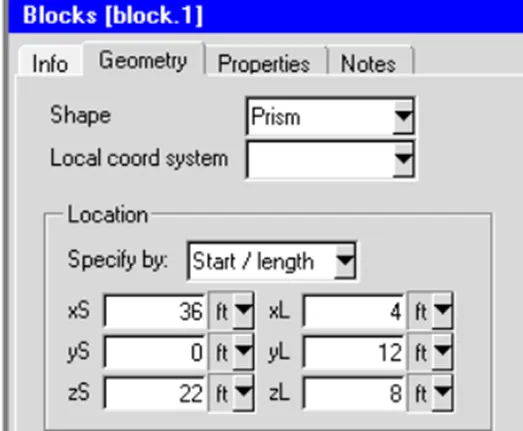
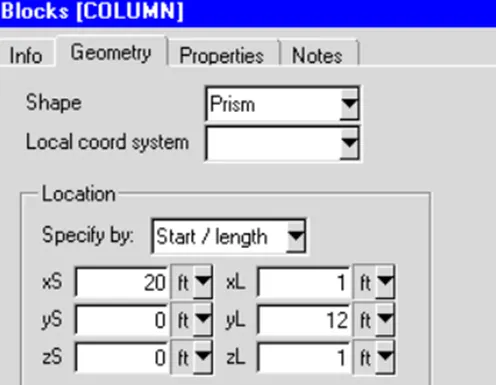
Column modelling:
Copy a part of this column at z axis by 20ft
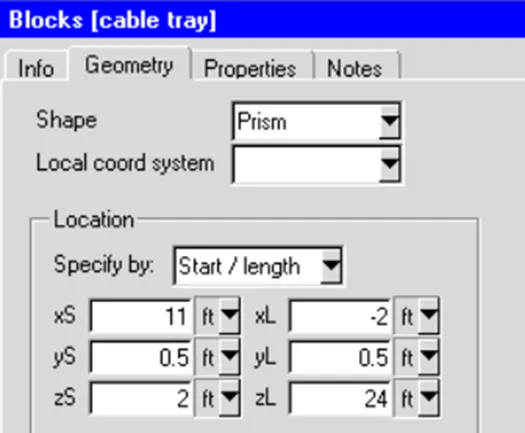
Cable trays modelling:
Create a copy at x by 6ft and z by 14 ft
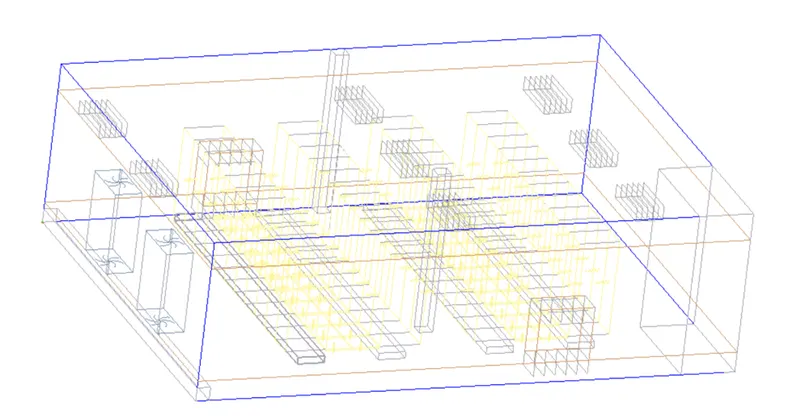
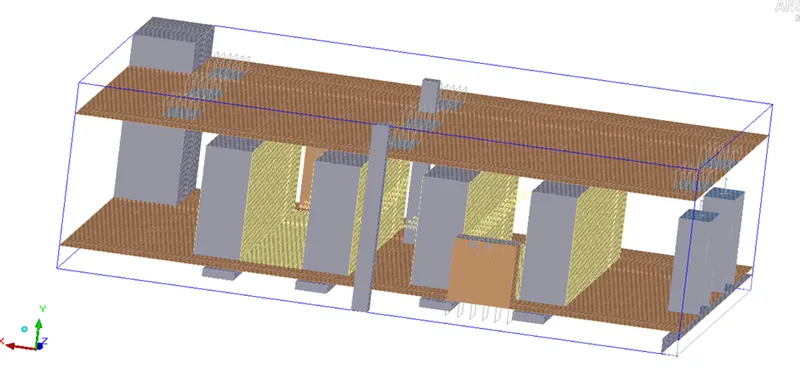
3d model of data centre:
Meshing:
Meshing assemblies is separately done to obtain non conformal meshing.
Multi-level meshing is done to reduce the mesh counts.
Create local object parameter for the following objects
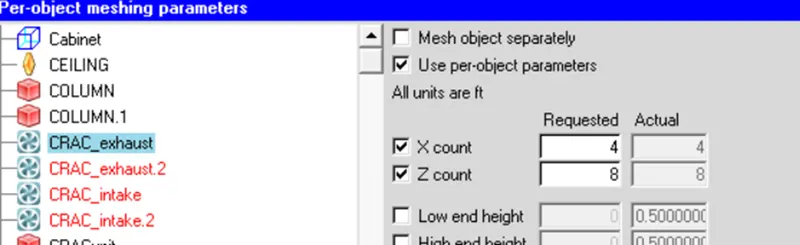
CRAC exhaust and intake x count as 4 and z count as 8
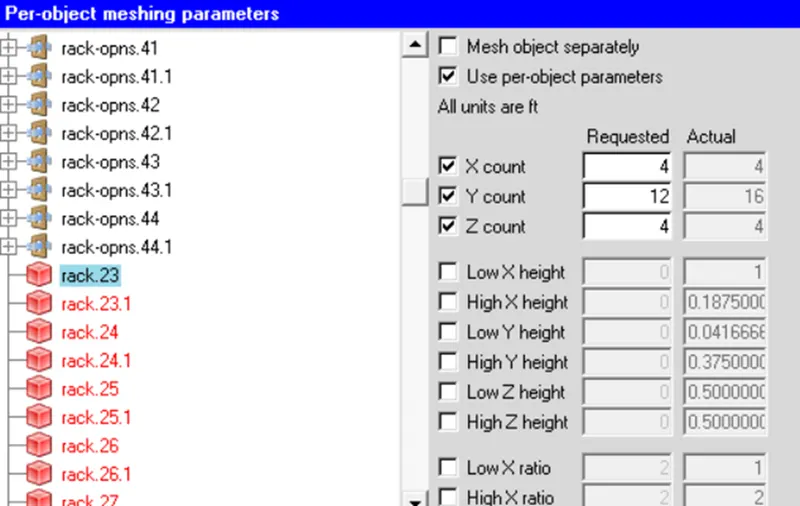
Rack with x count as 4, y count as 12 and z count as 4
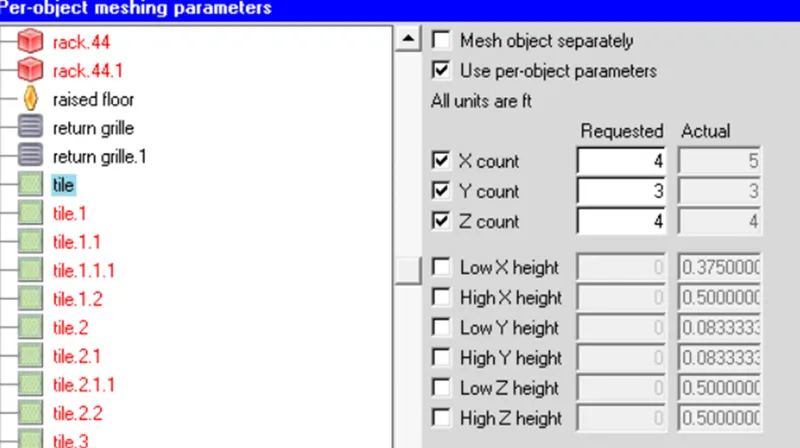
Tiles with x count as 4, y count as 3 and z count as 4
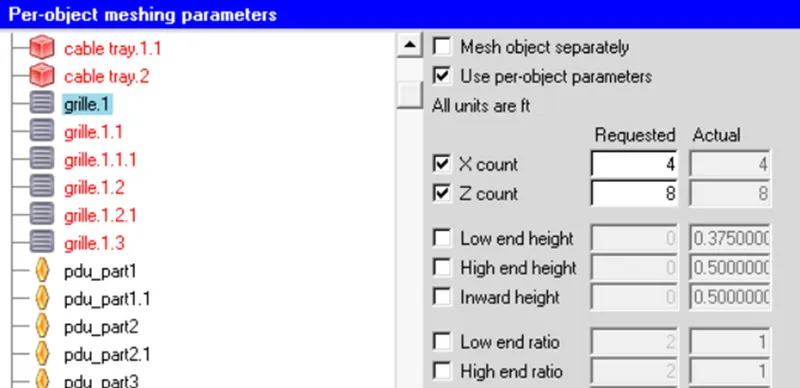
Grille with x count as 4 and z count as 8
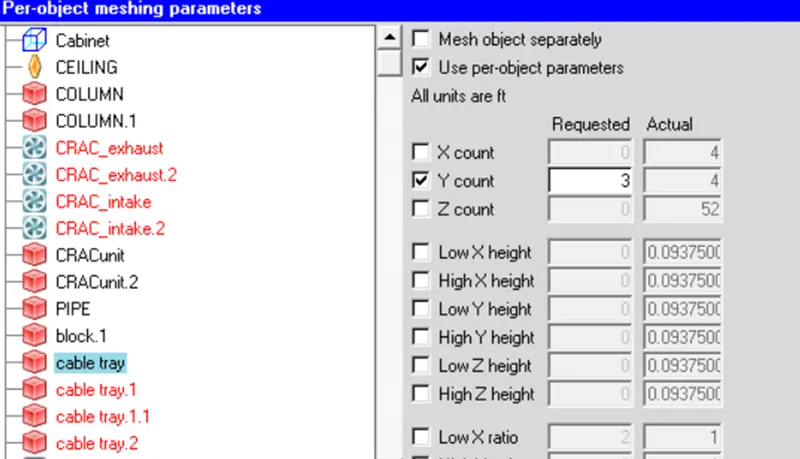
Cable trays with y count as 3
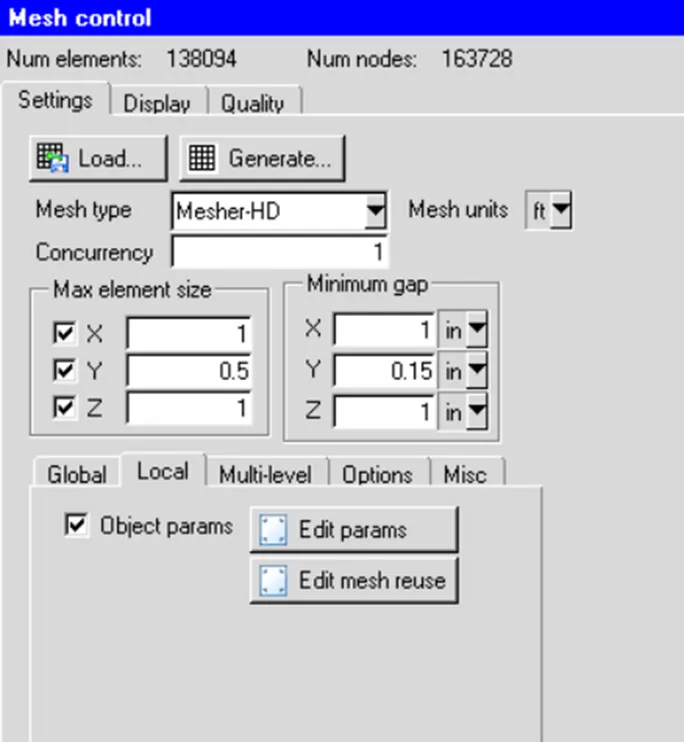
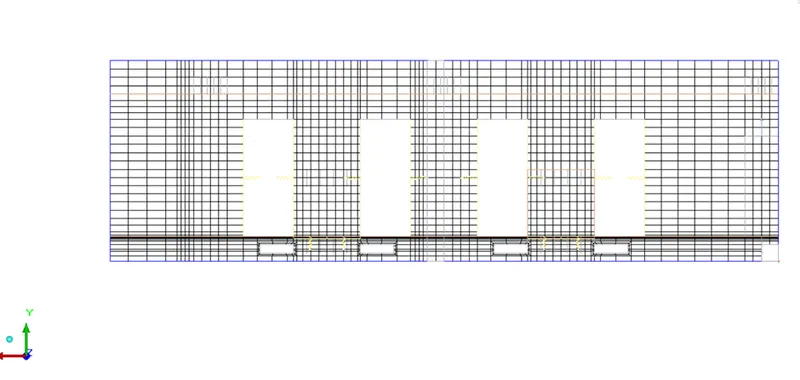
Overall mesh parameter
Mesh display in x direction
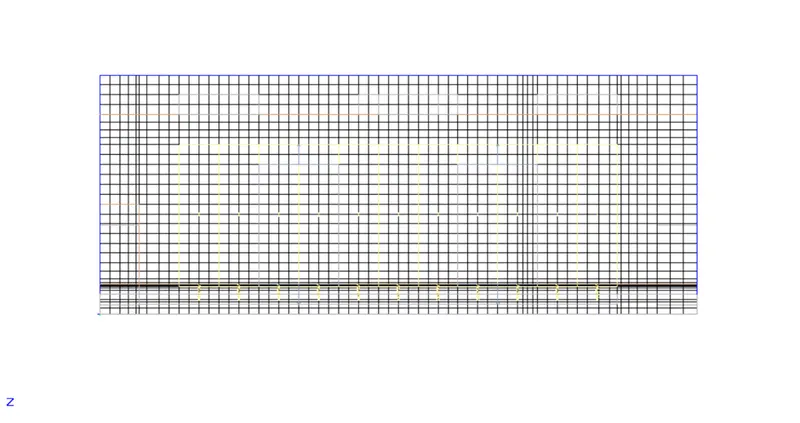
Mesh display in y direction
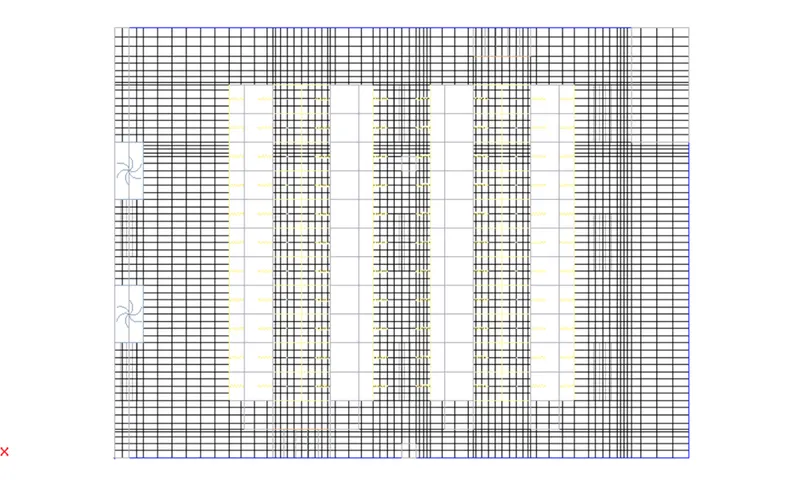
Mesh display in z direction
Mesh model of data centre
General set up:
Boundary conditions
Flow conditions
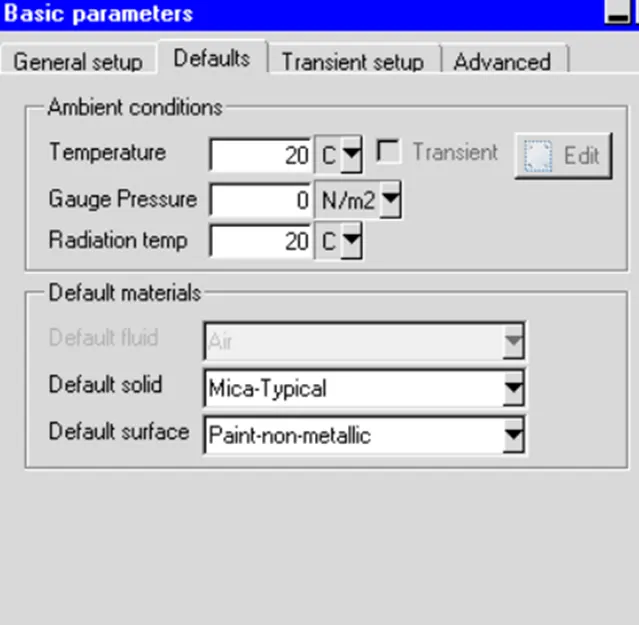
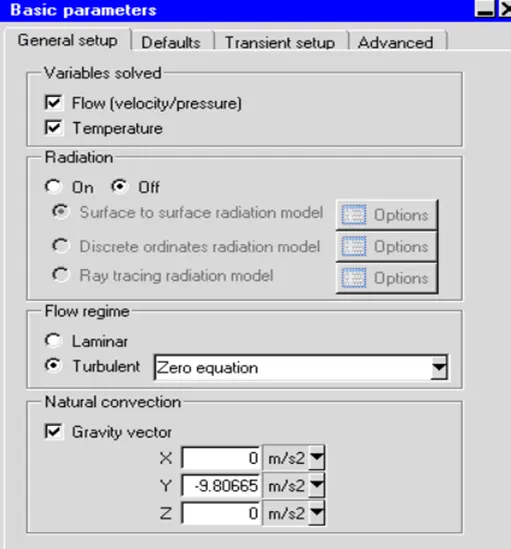
Temp 20 degree
Pressure 0Pa
Default fluid air
Default solid Mica
Radiation: off
Transient setup: steady
Natural convection bc
Gravity vector for y axis -9.81 m/s2
No of iterations: 1000
Flow convergence: 0.001
Energy convergence: 1e-10
Joule heating: 1e-7
Solution initialization:
X velocity- 0m/s
Y velocity- 0.5m/s
Z velocity- 0m/s
Species parameter:
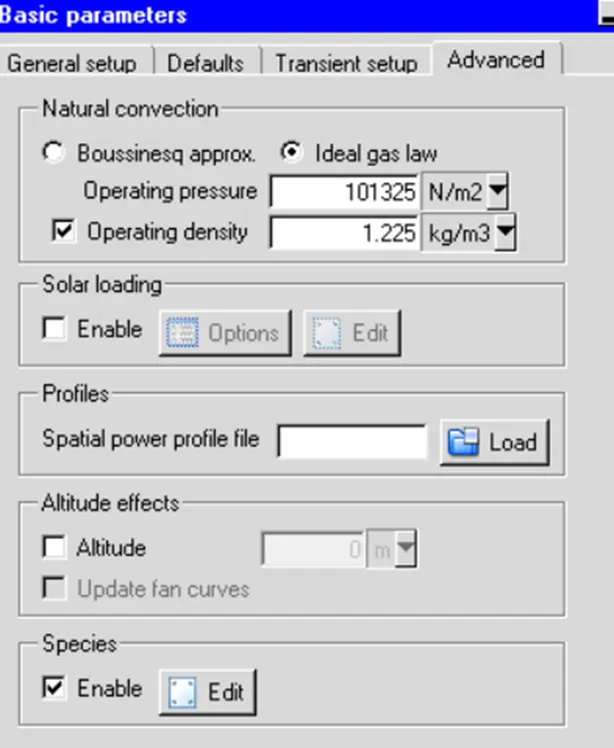
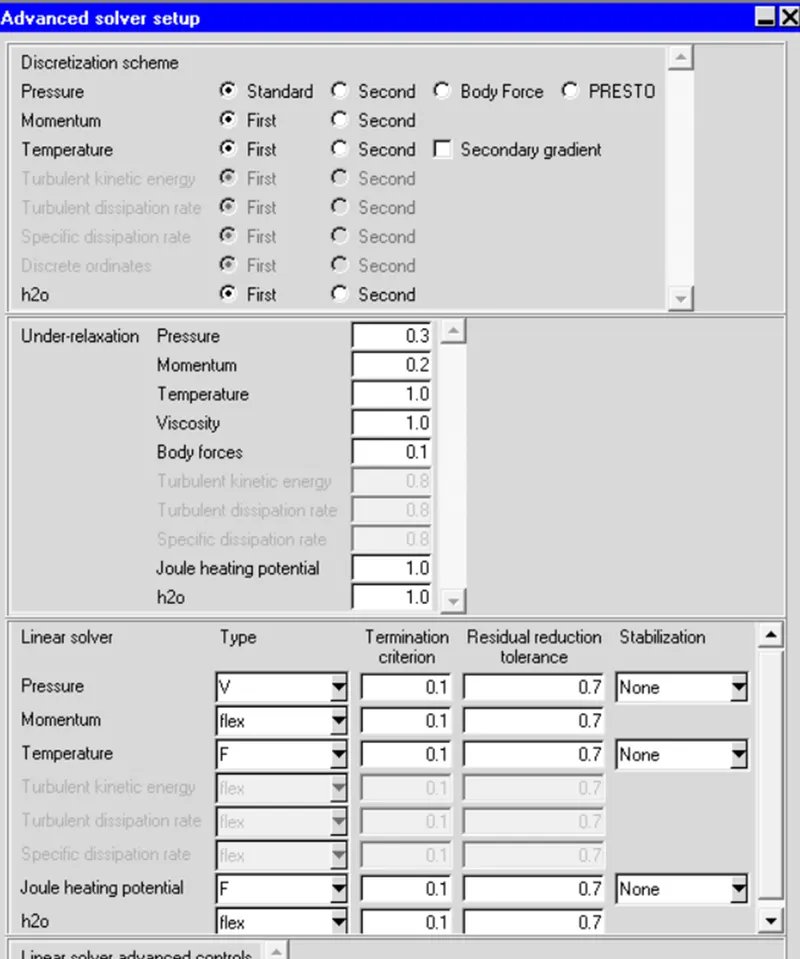
Advance settings:
Parallel setting:
No of processors- 4
Post processing plots:
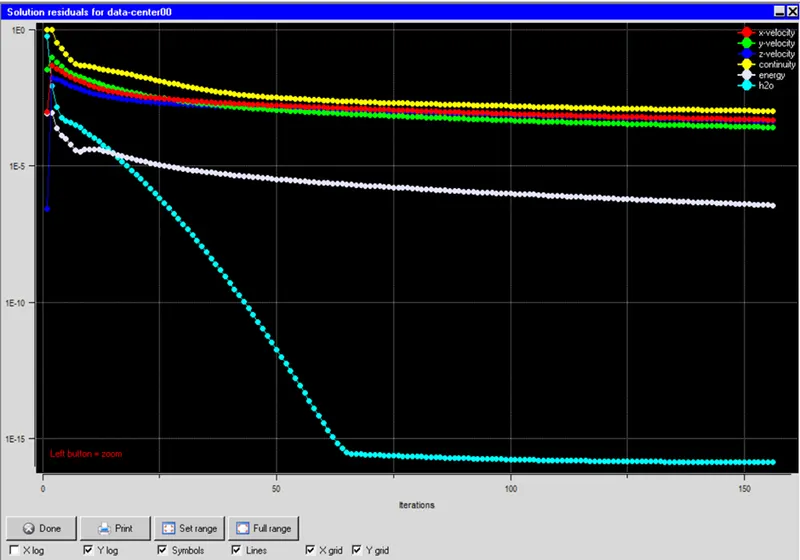
Convergence plot
Monitor points
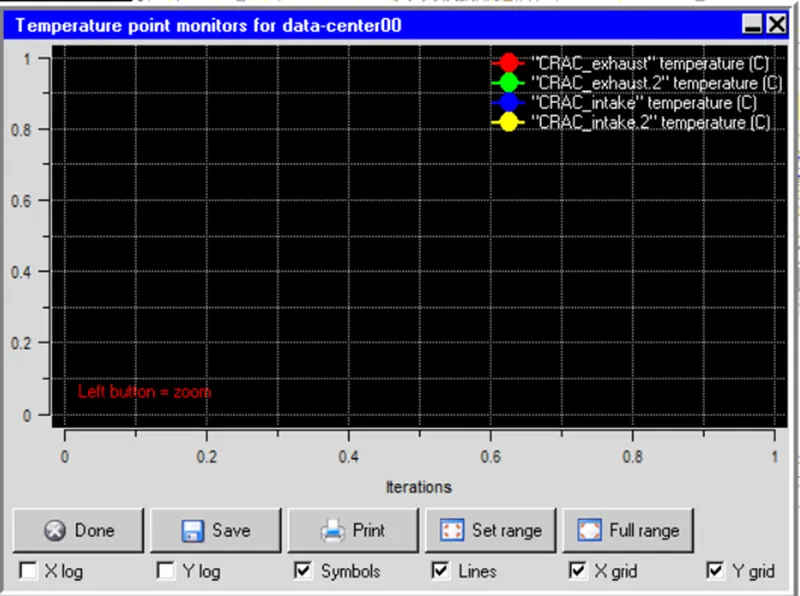
The solution gets converged without any instabilities in pressure, momentum and energy plot.
At the same time velocity, continuity and energy are well below the ranges and solution is well converged.
Temperature object contour
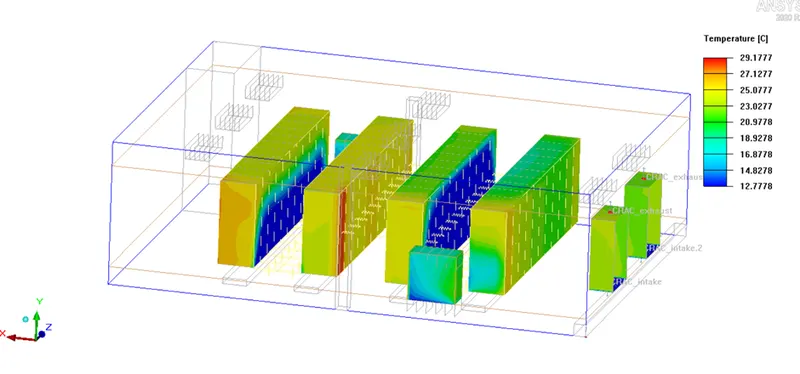
The maximum temperature rise is 29 degree C and minimum 12 degree C. The heat from rack is distributed through the crac fan unit to cool the data centre.
Temperature in X axis
Temperature in Y axis
Temperature in Z axis
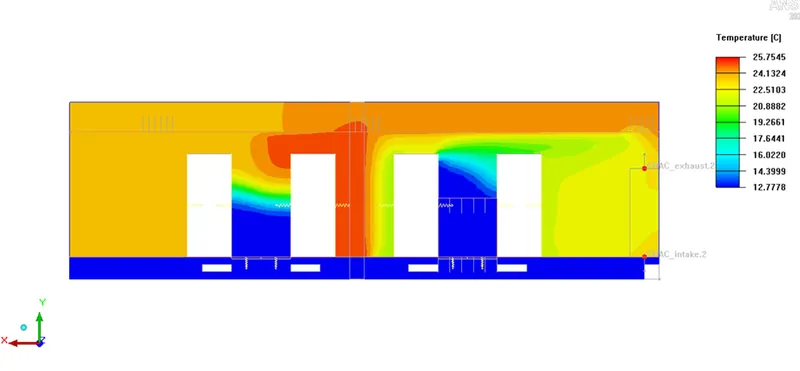
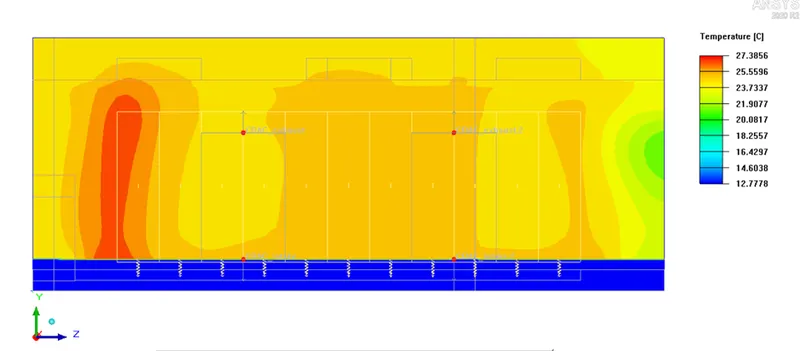
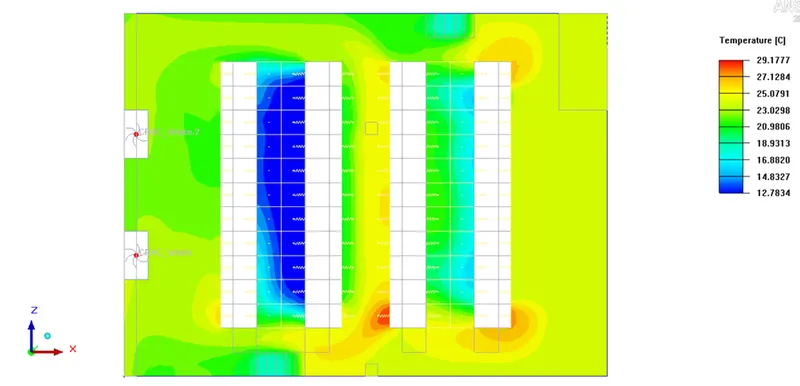
the inlet temperature from CRAC unit is 12.78 degree c, but due to inside temperature, the temperature hike is observed and raised to 25 degree c
object face of component is modelled and temperature of server rack is demonstrated.
Because of 4 racks temperature is highest at one side of the face.
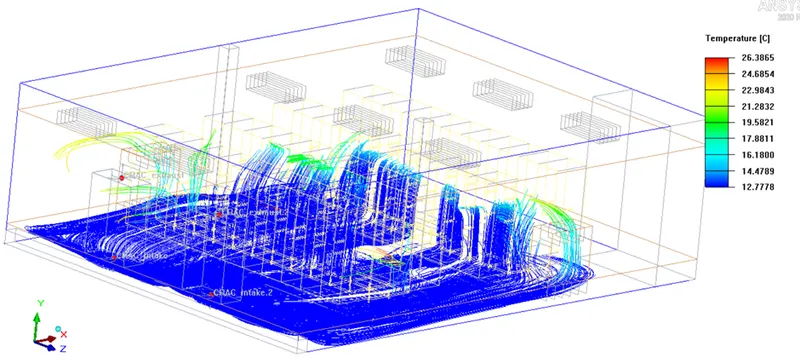
Temperature streamlines:
Velocity streamlines:
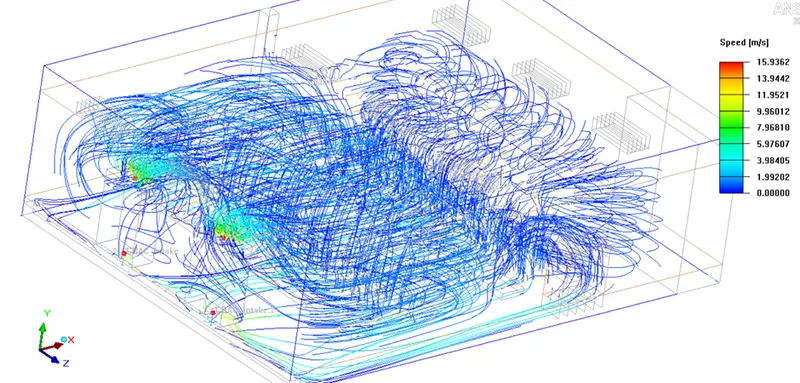
CRAC unit , the air intake has happened and through the exhaust CRAC warm air goes out.
The maximum velocity is 15.98 m/s across the whole cabinet. The air is circulated through it.
Conclusion:
- The data centre is modelled with macros components like PDU, CRAC, tiles.
- Grouping of all components have been applied to segregate each major component.
- Accurate meshing is performed using object parameter.
- Post processing is studied to study the air flow and temperature distribution. Particle traces are also shown for specifying the direction of flow.