Week 11: FSAE Car Project
AIM:
FSAE Car Project
objectives:
Phase 1 - Geometry Setup
- Cleanup the 48 errors
- Flag the front wings, rear wings, tyres, suspension links as separate boundaries
- Create a virtual wind tunnel
- Ground plane reference is provided in the lower end of the tyres. There will be a "flat section" in all the 4 tyres. This refers to the location of the ground plane. You will have to create the ground plane and perfectly merge it with the tyres.
- Run a virtual wind tunnel no-hydro test and a coarse simulation test to prove that you have finished face 1 correctly.
- For phase-1, the virtual wind tunnel boundary conditions and physical models can be assumed. If your simulations runs, you will be given full graded for this phase.
Phase 2 - Detailed Setup
ABCD Racing company is looking to perform Aero Simulations for their FSAE vehicle and they have hired you to do the job. The suspension team wants a detailed report on the total downforce on individual components. They have two races in this upcoming season.
Race details are as follows
Race-1
- Racing track conditions - Lot of turns
- Average lap speeds - 45kmph
- 70% turns at 45 degrees
- 20% turns at 80 degrees
- 10% turns at 20 degrees
Race-2
- Racing track conditions - Straights
- Average lap speed - 75kmph
theory:
Formula Society of Automotice EngineersSAE is a student design competation organized by SAE international. The concept behind Formula SAE is that a fictional manufacturing company has contracted a student design team to develop a small formula style race car. The prototype race car is to be evaluated for its potential as a production item. Each student team designs, builds and tests a prototype based on a series of rules, whose purpose is both ensuring on-track safety (the cars are driven by the students themselves) and promoting clever problem solving.
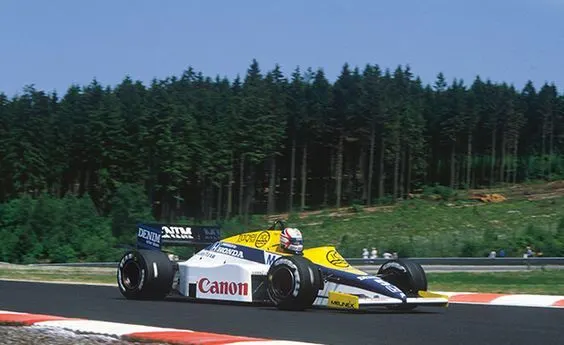
now i have taken the FSAE car geometry from the CAD package and i am going to run the simulation bhy making a wind tunnel around the car.
geometry:
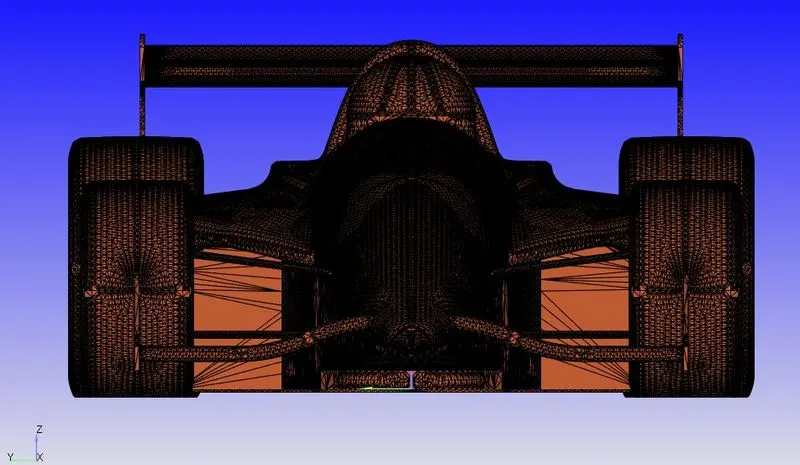
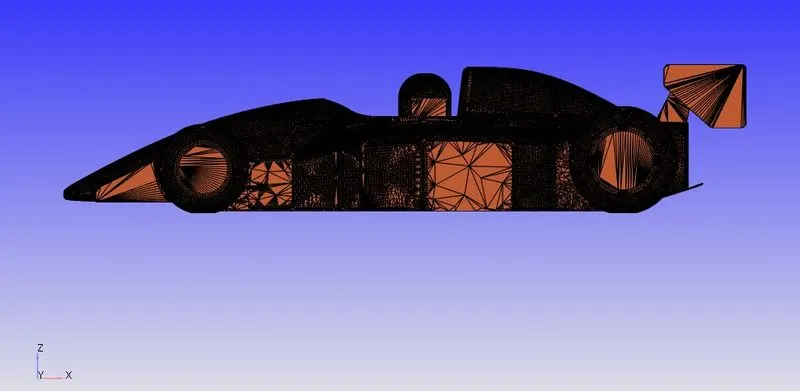
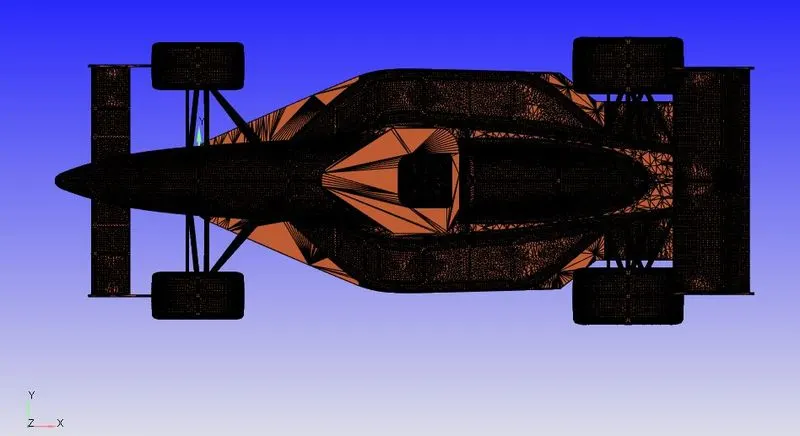
i have pasted the geometry in the converge. below are the diffferent views of the car
front view-
side view-
top view-
Race-1
- Racing track conditions - Lot of turns
- Average lap speeds - 45kmph
- 70% turns at 45 degrees
- 20% turns at 80 degrees
- 10% turns at 20 degrees
now check any errors present in the geometry by clicking the diagnosis tool. after removing the errors ( open edge, non- manifold etc..), now create a wind tunnel around the car. the distance betweeen the inlet of the wind tunnel to front portion of car is taken as five times the charecterstic length of car. here the charecterstic length of the car is 2.5m. the distance between the outlet of the wind tunnel to back portion of car is taken as nine times the length of the car. the backward length is greater than front length because . the wake regions are created at the backward of the car. to visualize the wake regions, i have increased the backward length. the the distance along y direction as taken as two times the charecterstic lenght and the distance along z direction i have taken is equal to charecterstic length.
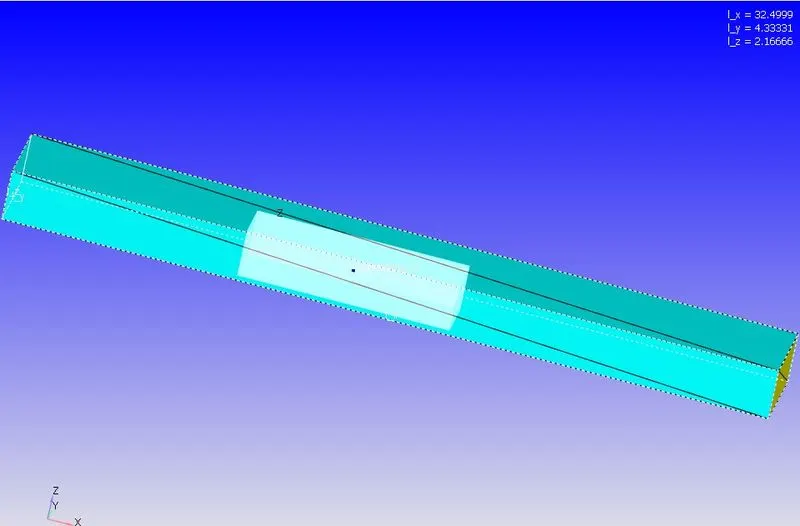
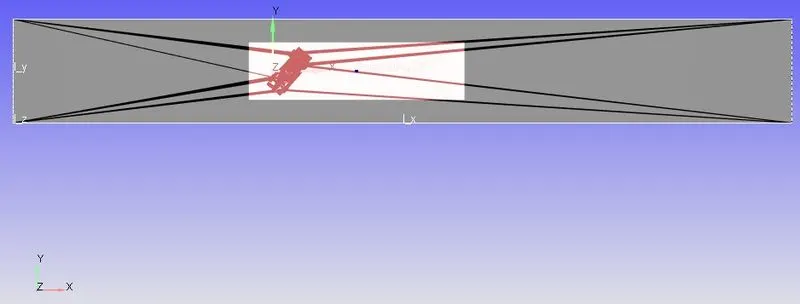
in the race 1 problem it is mentioned that car has to take 70% of turn at 45 degrees, 20% of turn at 80 degreees, 10% of turn at 20 degrees. so to take a complete turn car has to turn at average angle. so i have taken the average of angles
`((0.7*45)+(0.2*80)+(0.1*20))/(0.7+0.2+0.1) = 49.5 degrees`
rotate the angle of car by 49.5 degrees.
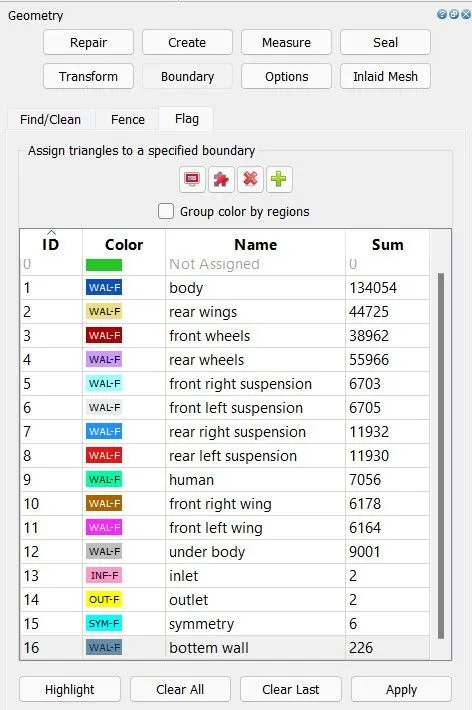
now use boundary flagging tool to name the different parts of the geometry. select all the triangles in a part by creating boundary fencing around the part. below are the different names given to each part of the car.
now buid the case setup.
case setup:
application type: time beased
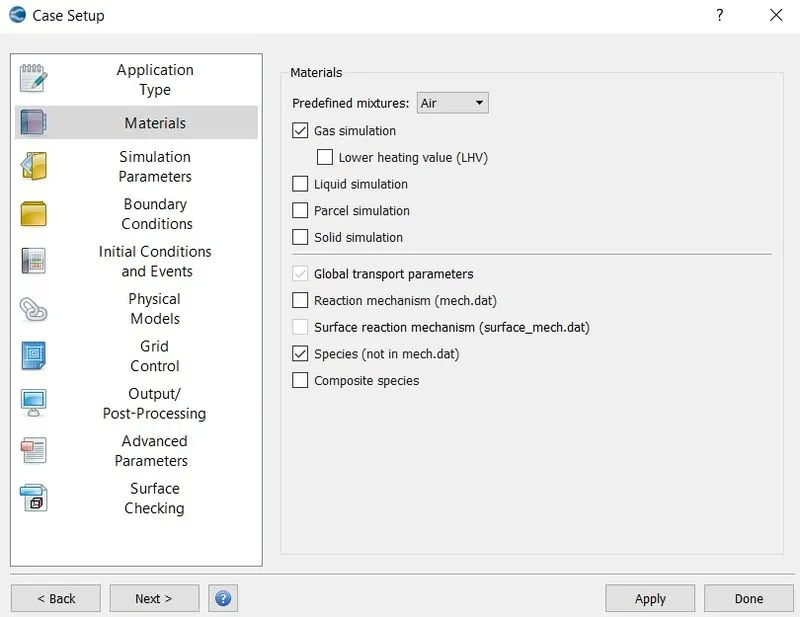
materials: air
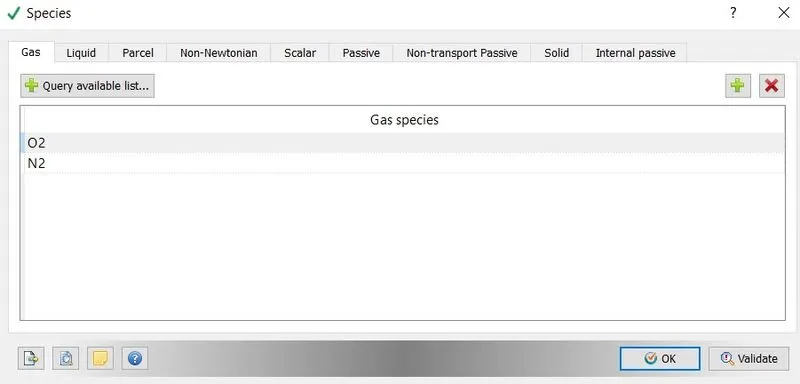
click on gas simulation as the air is gaseous state and click on species to calcuate how the mass fraction of N2 and O2 are changing along the flow.
species-
simulation parameters:
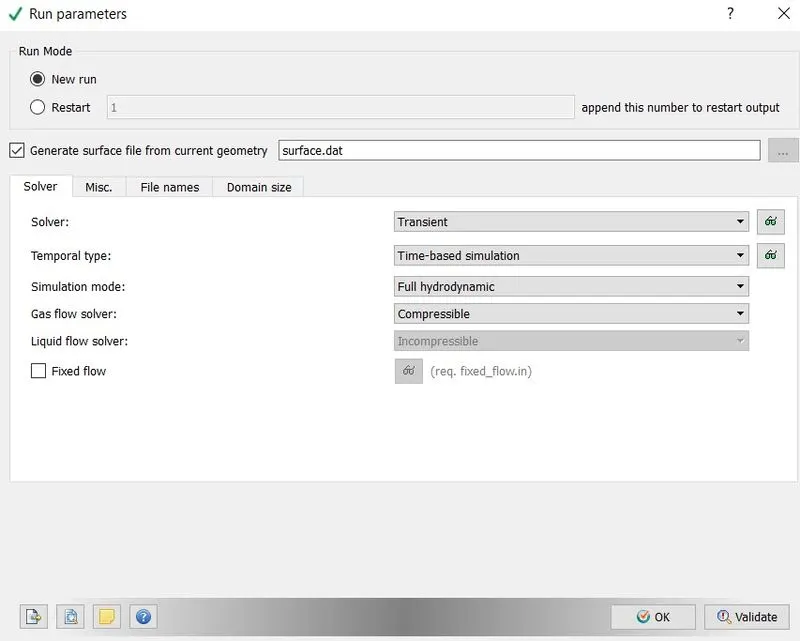
run parameters-
i am running the somulation using transient state solver. full hydrodynamic simulation mode is used for simple geometries.
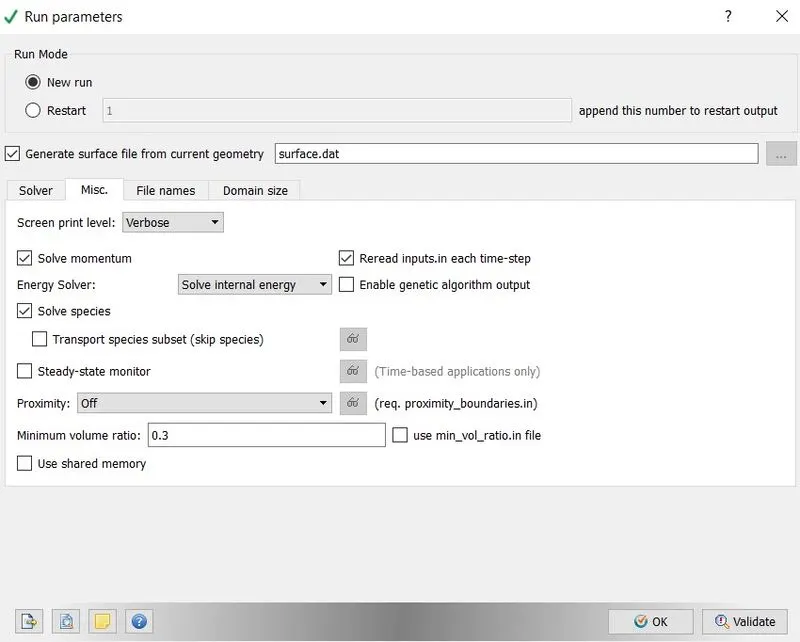
- we have click on steady state monitor only for the steady state problems only.
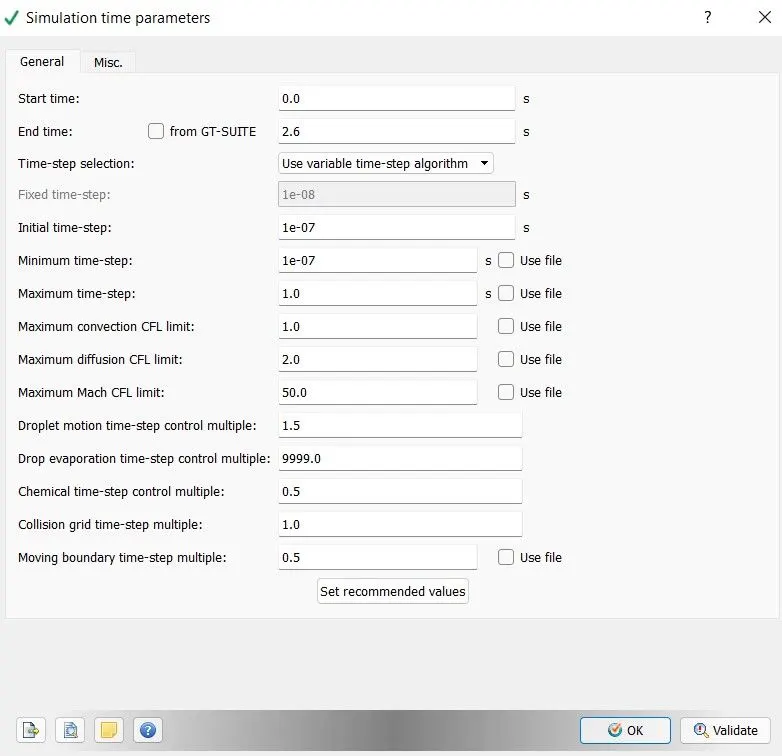
simulation time parameters-
the maximum convection cfl number should always be less than or equal to 1. so that solution would converge otherwise solution gets blown up.to calculate the end time, i have used the following procedure.
to calcumate the time we need velocity flow and length of the elbow. here the length of the wind tunnel is 32.5m. given the average lap speed is 45 kmph (12.5 m/s). so we can say that time taken by the fluid to move out of the wind tunnel is 2.6 s. we need to take the simulation end time as two to five times of the time taken by fluid to come out of tunnel, so that we can see the wake region and how the primitive variables reached to steady state. but here i have taken the end time as 2.6 s because it is going to take large computational time with increase in end time.
solver parameters-
density based solver is used here
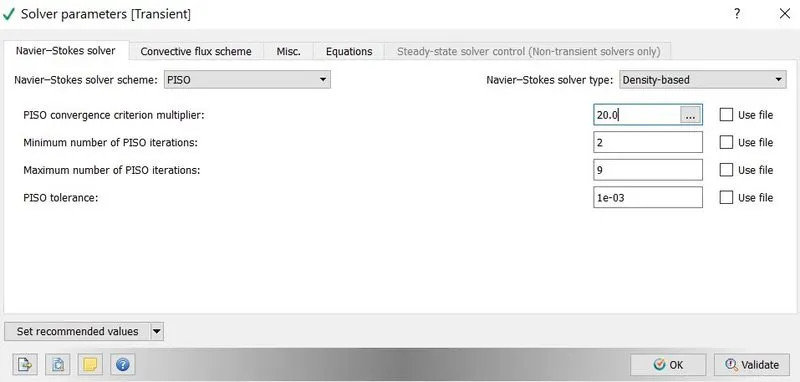
initial conditions and events:
regions and initialization-
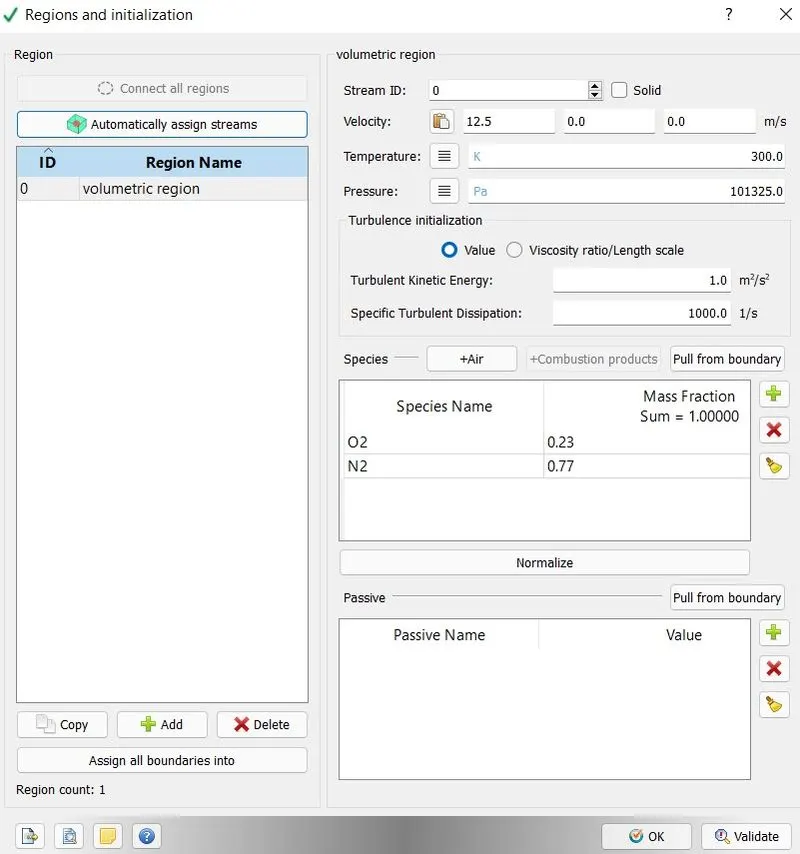
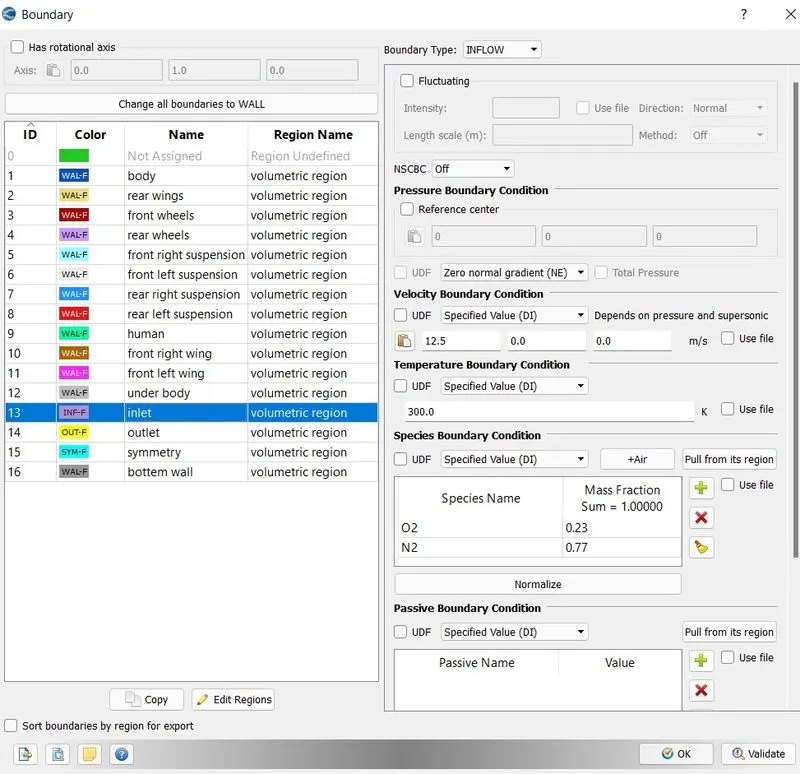
boundary conditions:
boundary-
- inlet- the inlet velocity i have taken is 12.5m/s.
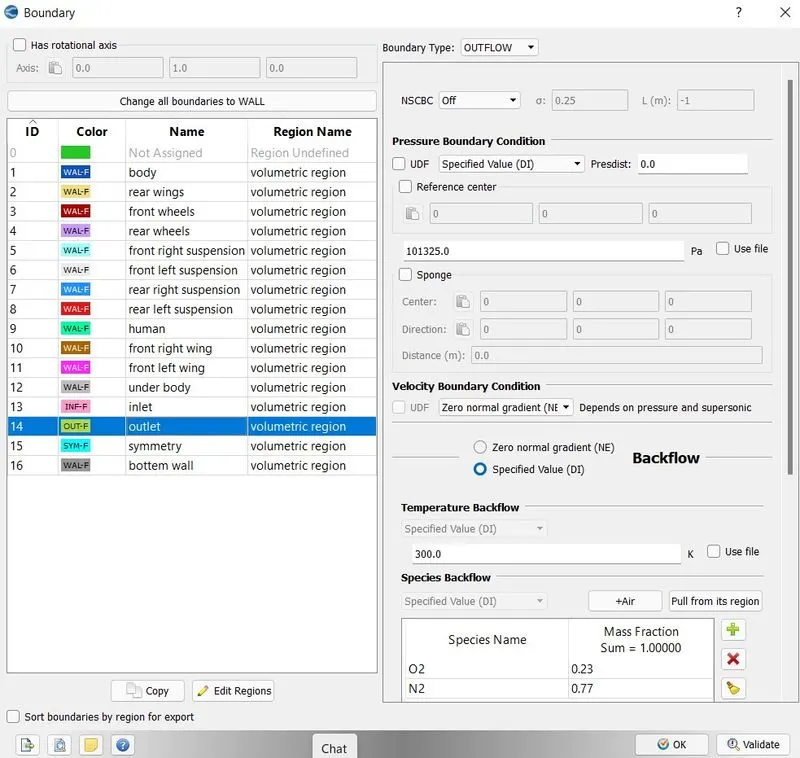
- outlet- the outlet pressure is atmospheric i have taken is 101325 pascals
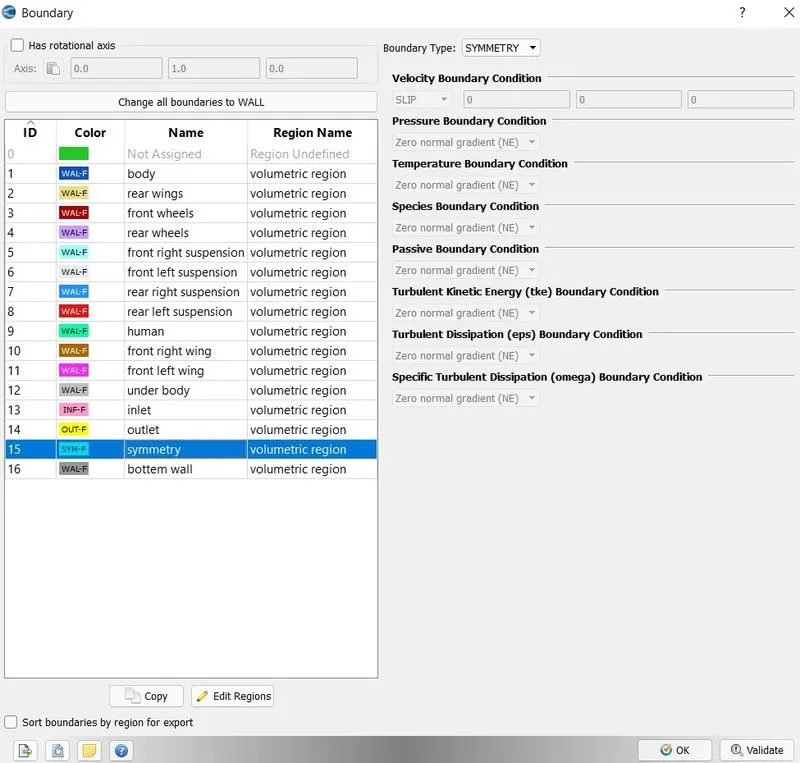
- symmetry- i have taken this boundary condition to all the walls of the wind tunnel except bottem of the wind tunnel
- bottem wall-
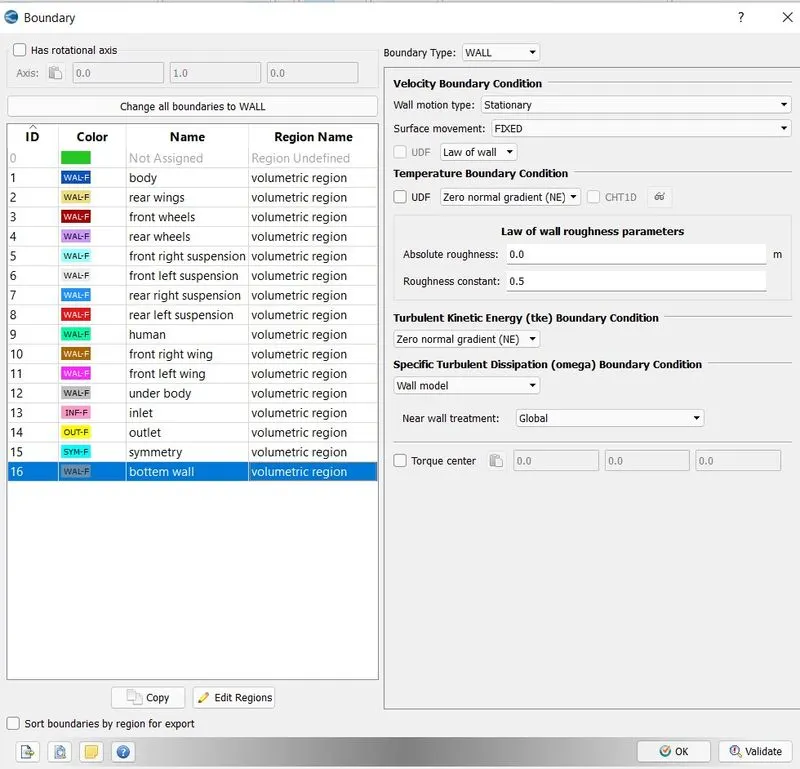
- as i have given law of wall boundary condition to bottem wall, i have given the law of wall boundary condition to all the parts of the car.
physical models:
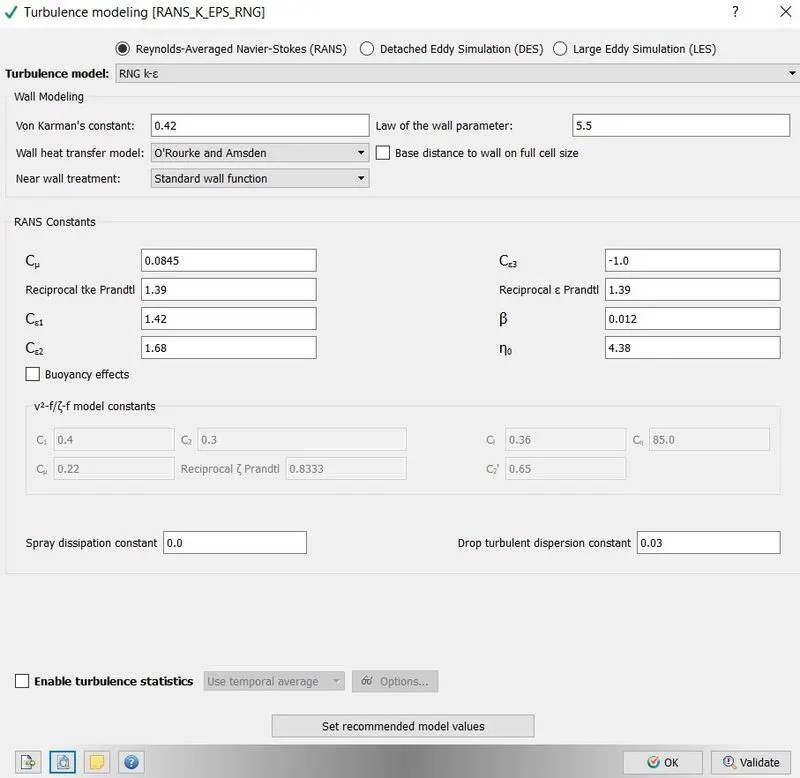
turbulence modelling-
grid control:
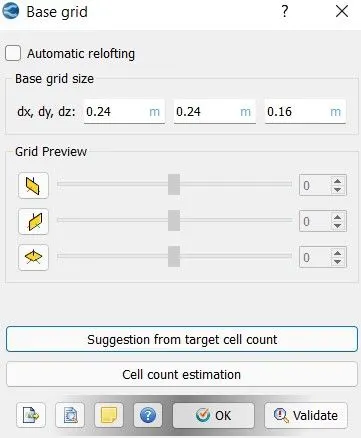
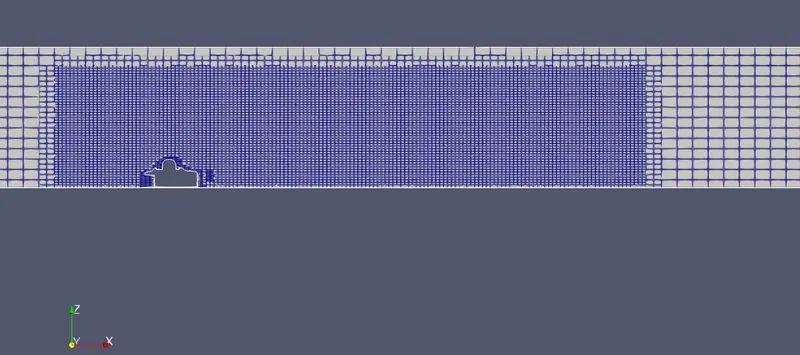
base grid- as we know that the primitive variables vary along z -axis compared to other two axes. so i have given, more refinement along the z axis. the grid size of other two direction that i have taken is 1.5 times the grid size along z axis.
fixed embedding-
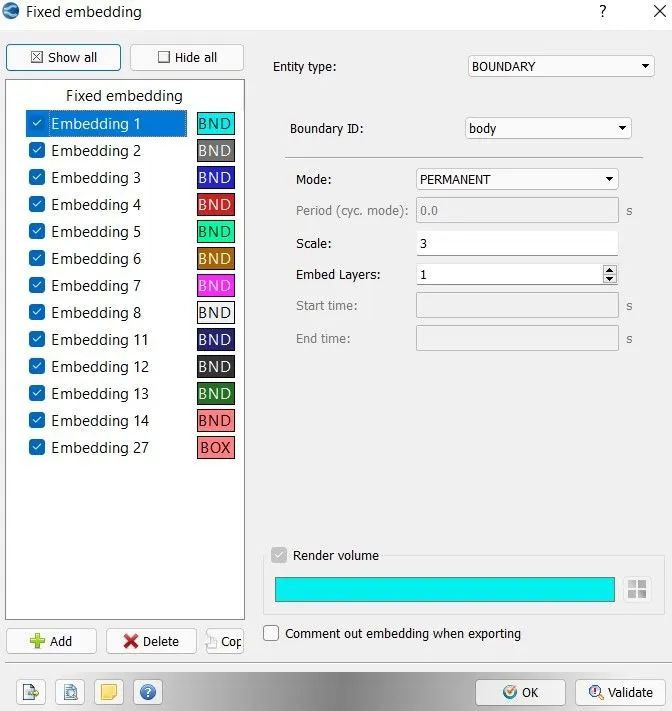
i have enabled fixed embedding because to scale the cells at walls of the geometry. it means to to capture the turbulence in the turbulence boundary layer region, we have to provide cells with small size at the walls of the boundary. embedded layers represents the number of layers of cells we are going to take. scale represnts at what factot of base size is taken for first layer thickness. here i have determined the scale from the below formula
first layer thickness = base size/2^n, where n represents the scale.
- here i have reduced the scale that i have got from the above formula because by increaing the scale, there will be more refinement in the box whicj increases the cell count. i have limited access for the cell count for the simulation. so that i have reduced the scale so that my software can start simulation.
- after running a coarse simulation, check the y+ plots for each part of the car whether they are appeared in between 30 to 300. if not means, increase the scale to that particular part.
output/post-processing:
post variable selection- here i have enabled y+ value along with default variables.
output-
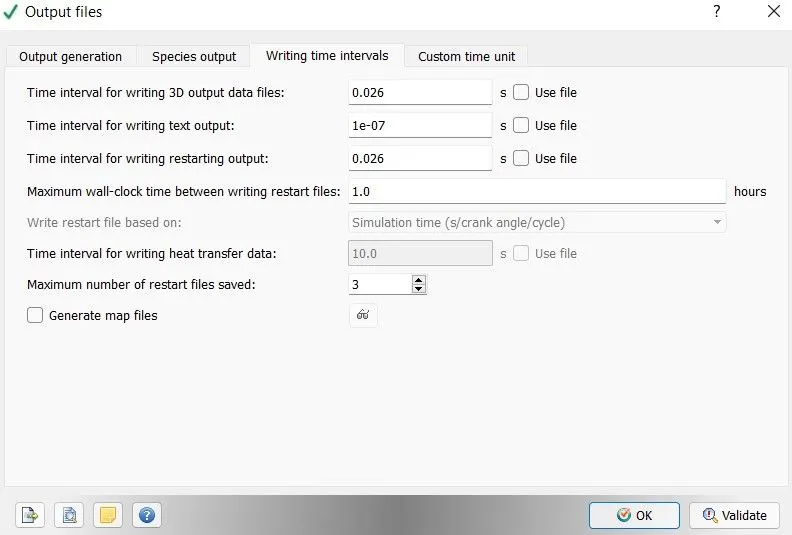
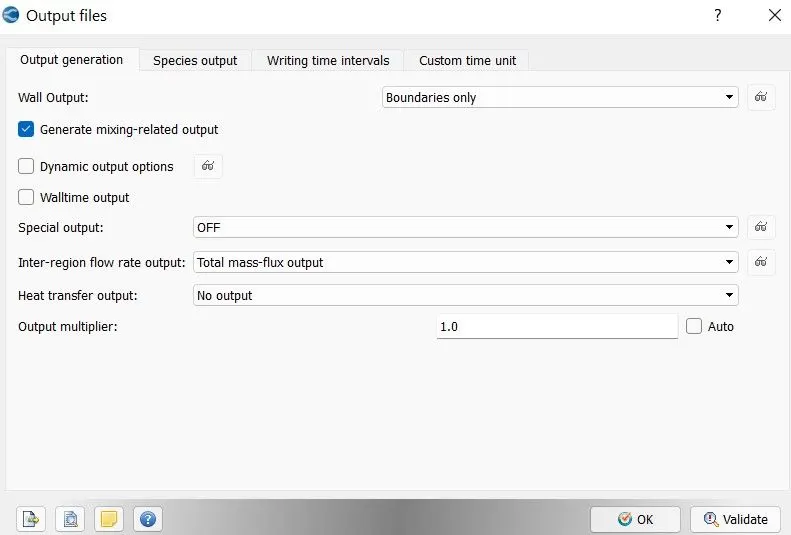
time interval for writing the 3d output data files is 0.026 seconds. it means , the output values gets stored for every 0.026 seconds. i have enbles boundary only wall output to calculate the drag and lift foces acting on the body.
solution:
now export all the input files in a folder. so from this we can see that converge is used to create the input files for the simulation. now insert the two application files from the converge folder to the folder where i have exported all the input files.

for the simulation i have used cygwin64 terminal. in cygwin termpinal open the folder where you have pasted all the input and application files.
now for the simulation write mpiexec.exe -n 4 converge.exe restricted and click enter. here 4 represents the number of processors used at a time.
post processing of results:

for this copy post convert application from converge folder to output folder which is generated in the input files folder. we are doing this because we are going to convert all the output files into a vtk file which can be easily read by paraview software. toconvert the files we have to use post conver application as shown in the figure. there we can see the results that are obtained. now in cygwin open the output folder and write mpiexec.exe -n 4 post_convert.exe and click enter. now the below figure will appear
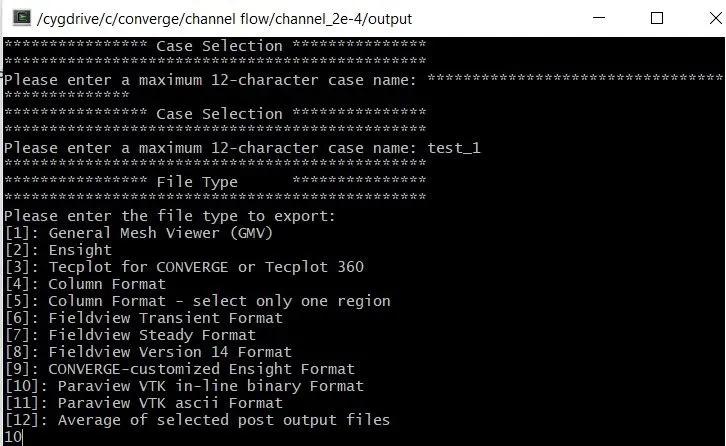
after naming the case and choosing 10, hit enter. now click yes for boundary output surface. now all the output files will appear and then write 'all' to convert all the output files. now select 'all' at cell variable selection menu. now all the files gets converted into paraview vtk files.
now open paraview. in paraview, open file and select case name .. vtm file which is present in the output files. finally we see the geometry in the paraview.
base grid-
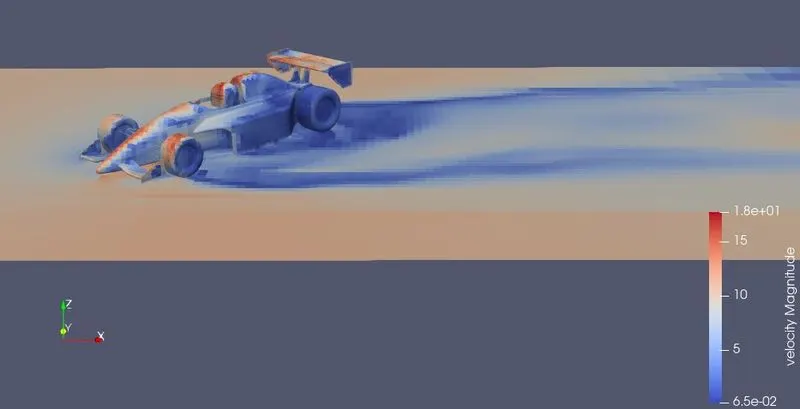
velocity contour-
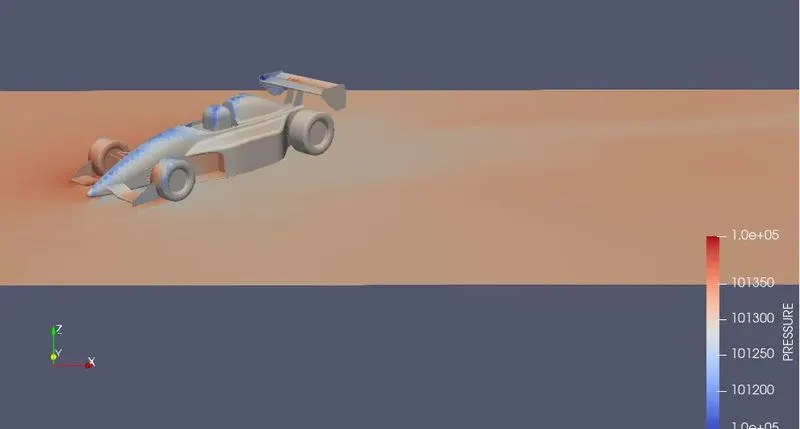
pressure contour-
aniamation of pressure acting on car-
animation of velocity of flow-
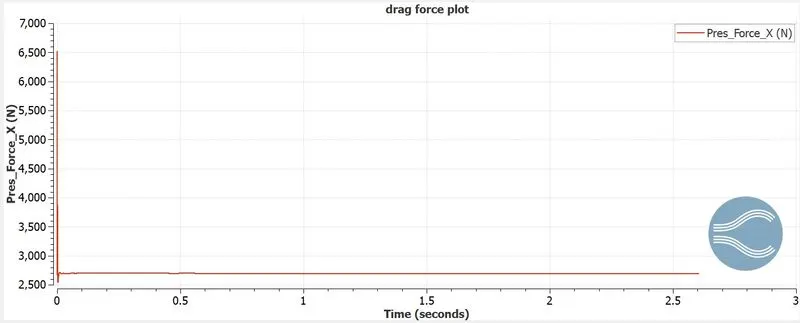
drag force plot on car body-
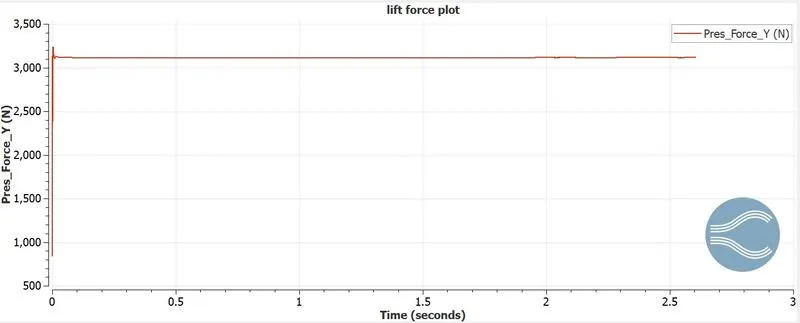
lift force plot on car body-
drag force plot on car under body-
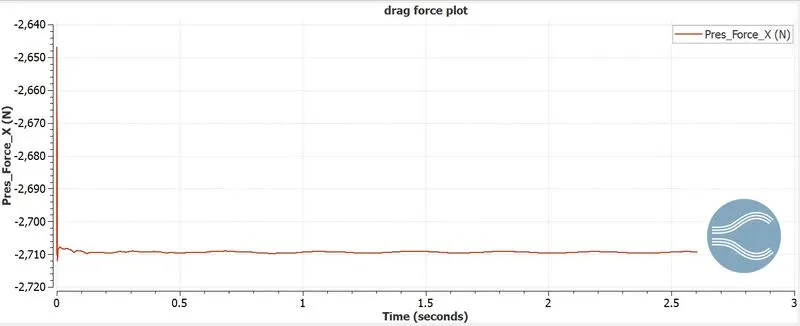
- there is a negative drag force are acted on car under body. but this won't be happen in real scenario. here we have obteined these values because we have taken the coarse mesh.
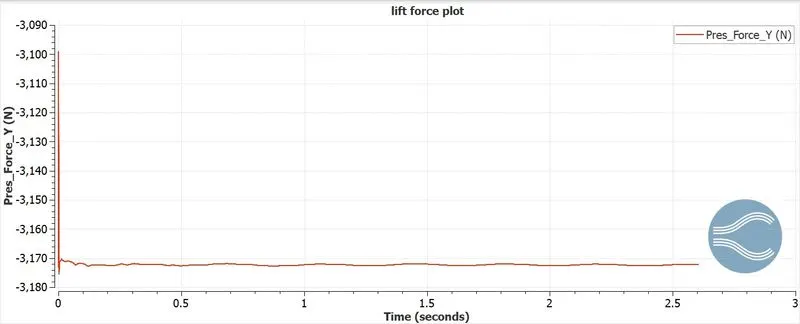
lift force plot on car under body-
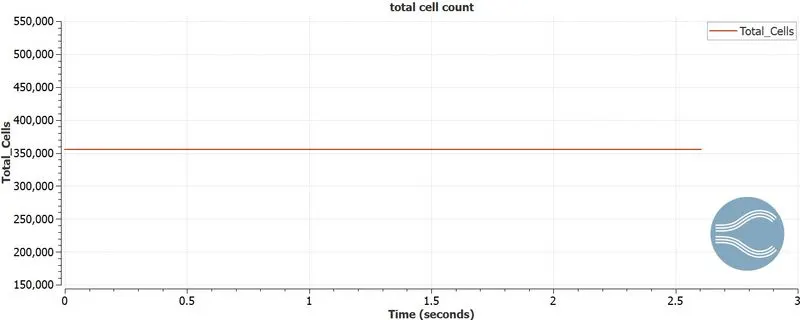
total cell count plot-
Race-2
- Racing track conditions - Straights
- Average lap speed - 75kmph
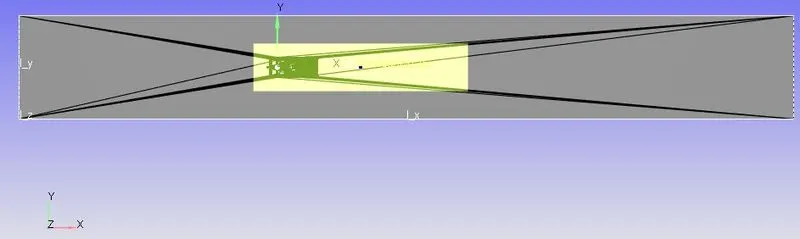
now by taking this speed, below are the final results obtained
velocity contour-
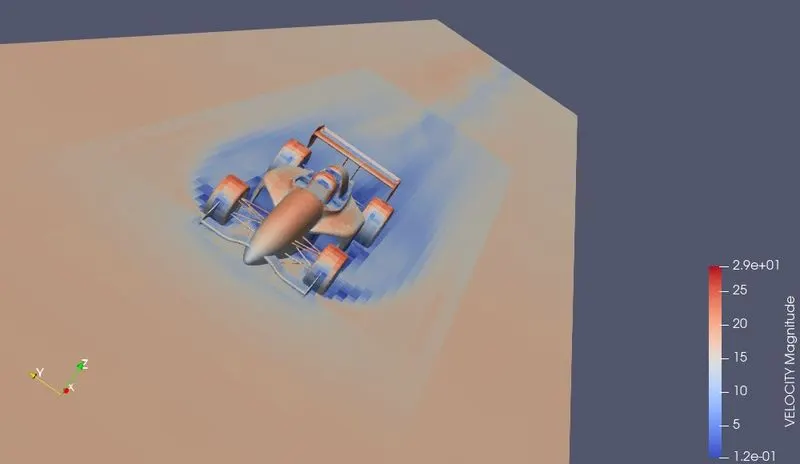
pressure contour-
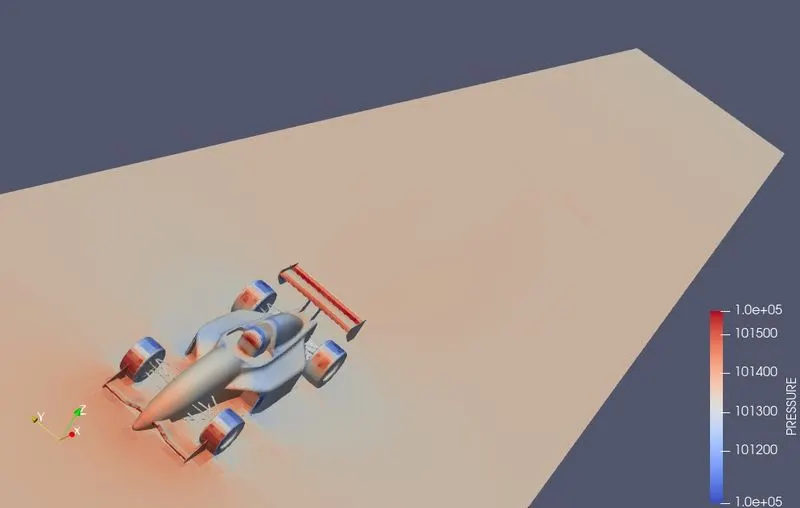
animation of pressure acting on car-
animation of velocity of flow-
drag force plot on car body-
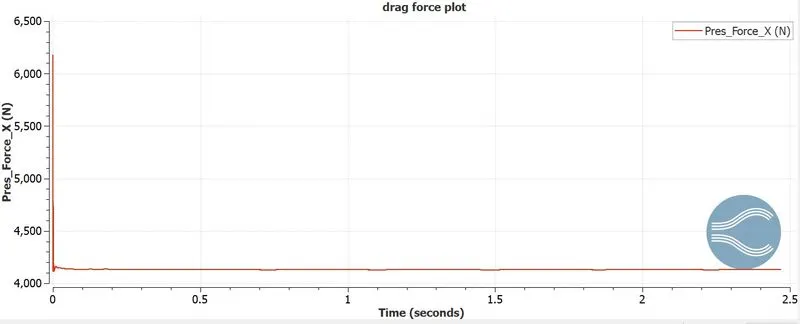
lift force plot on car body-
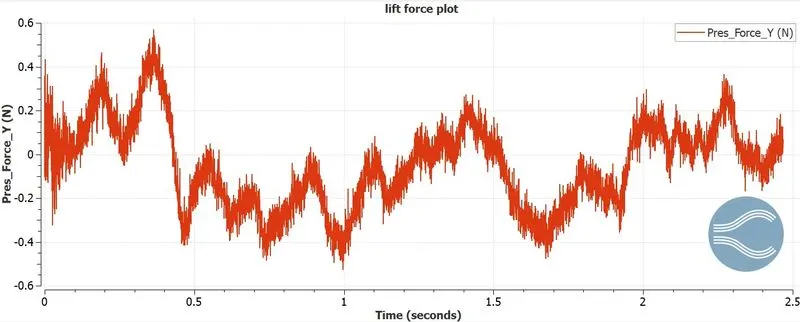
drag force plot on car under body-
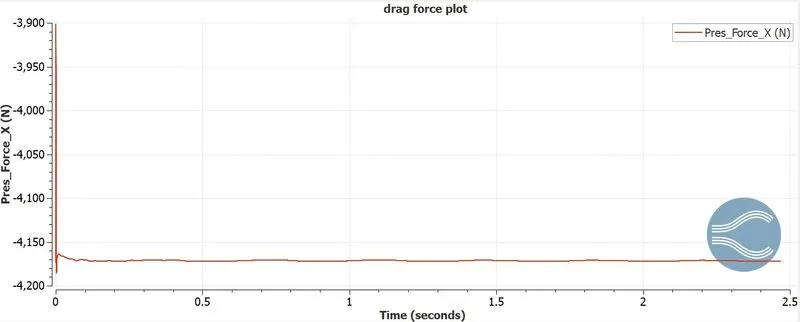
- there is a negative drag force are acted on car under body. but this won't be happen in real scenario. here we have obteined these values because we have taken the coarse mesh.
lift force plot on car under body-
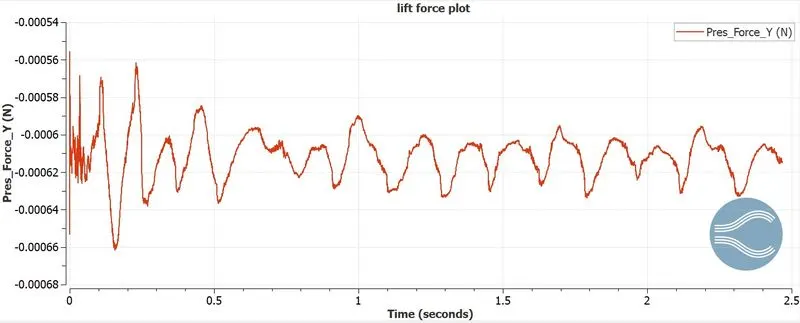
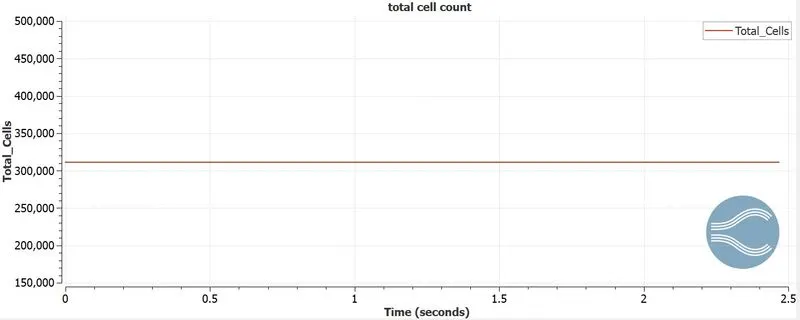
total cell count-
conclusion:
- the negative lift force generated on car under body in the race 1 is much higher than race 2. because during the turns there should be more negative lift force generated on car, so that the car stick to the road.
- more lift force is generated on the car body in race 1 compared to race 2.
- by seeing the pressure contours, there is more pressure acting the tyres which means nore drag force got induced because of tyres.
- the drag force increased in race 2 with increase in velocity compared to race 1.
- accuaret results will going to be apper with more refinement of cells.