Week-11 Challenge: Braking
Braking
Aim:
- Calculate the energy required for braking for a defined driving cycle
- Explain why electric motor can’t develop braking torque at high speed similar to starting, how electric and mechanical brakes are coordinated?
- Make a MATLAB program which plots contour of given motor speed, torque and efficiency values. Attach the code as a .m file attach a screenshot of all the plots.
Drive cycle:
Driving cycle is a velocity-time profile that describes driving characteristics of specific type of vehicles under
real-world driving condition, which is always used as a standard for the evaluation of vehicles’ economy, emission
and driving range in vehicle industry. Currently, there exist several types of driving cycles widely used in the actual application, including UDDS (Urban Dynamometer Driving Schedule), HWFET (Highway Fuel Economy Test Cycle), NEDC (The New European Driving Cycle) and EUDC (Extra-Urban Drive Cycle). In China, NEDC is used as the official driving cycle for vehicle emission test. However, NEDC is developed based on the traffic characteristic of European cities in 1990s, many researchers focus on driving cycles construction for specific region and vehicle type
Brake:
Braking is the process of controlling the velocity of an object by inhibiting its motion. An object in motion possesses kinetic energy and to bring the object to a stop this kinetic energy must be removed. Removing the kinetic energy can be accomplished by dissipating the energy to the atmosphere through friction or by converting it into another form of energy. The most common type of braking is a mechanical brake which inhibits motion through friction brake pads. A mechanical brake applies a friction force to convert the kinetic energy of the vehicle into thermal energy which then dissipates into the atmosphere. Braking systems which don't use friction are referred to as regenerative braking system (RBSs). In RBSs, the kinetic energy is converted into other forms of useful energy, which can be stored for later use, increasing fuel efficiency.
The energy equation depends on the type of motion a body is going under. Let us consider
a body of the weight W, mass m, and mass moment of inertia about its axis of rotation I.
The sources of energy to be absorbed from the body by the clutch or brake are mainly as
follows: Kinetic energy of translation is
`Ek=1/2mv^2`
Assuming M=800kg
v= taking from FTP drive cycle
Caluclating the energy required for braking using Matlab script.
% Caluclating the energy required for braking
t=Drivecycle{:,1}; % Load time range from drive cycle
v=Drivecycle{:,2}; % Load Velocity range from drive cycle
m=800; %Kg
for n=1:(length(v)-1)
    if v(n)>(n+1)
        Ek(n)=0.5*m*(v(n)-v(n+1))^2/1000;
    else
        Ek(n)=0;
         Ek(n)=0.5*m*(v(n)-v(n+1))^2/1000;
    end
end
x=sprintf('Total Brake energy for defined drive cycle is = %0.2fkwh',sum(Ek));
disp(x);
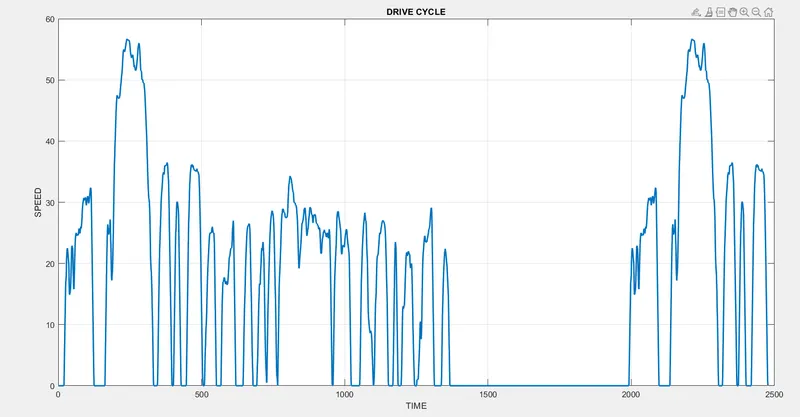
%Plotting drive cycle
plot(t,v,'linewidth',2);
title('DRIVE CYCLE');
xlabel('TIME');
ylabel('SPEED');
grid on
Total energy for defined drive cycle is 1492.79 Kwh.

Drive cycle is
Objective 2:
Explanation why electric motor can’t develop braking torque at high speed similar to starting
Let us consider a speed torque characteristic of a motor for electric Vehicle application, see the below characteristics
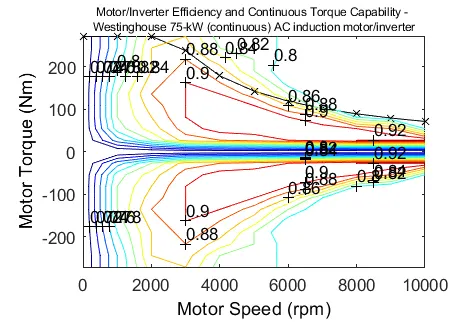
We can see characteristics quadrant 2 is the mirror image of quadrant 1 characteristic’s, quadrant 1 and quadrant 2 are almost similar. So usually, an Electric Vehicle can achieve 0 to 100kmph which is 2300 rpm in 10seconds, but can we achieve the reverse is the reverse is the reverse case true? During low-speed torque produces by the motor is almost constant therefore it has higher acceleration torque which is possible. To reach where vehicle speed is 100kmph the corresponding point comes not under constant torque region which is comes under constant power region. from quadrant 1 we can see it is easier for motor to reach 0 to 100kmph, now when it is comes to braking part quadrant 2 where the negative torque is around -150N.m. Compare to peak torque around 400N.m so peak acceleration torque and peak deceleration torque are not equal for electrical vehicle motor. in acceleration for lower speed, we can get higher torque but in deceleration or braking at the higher speed the value of the torque is lower so the braking torque of EV motor is not high as the acceleration torque.
How electric and mechanical brakes are coordinated.
The performance of Electric vehicles or Hybrid Vehicles propulsion system is strongly dependent on the type of brake system used. The energy recuperation component of fuel economy gain depends to a first order on the motor or Generator ranting and secondly to the types of regenerative braking systems employed. It is far more important to implement active brake controls on rear wheel drive versus front wheel drive electric/hybrid vehicles when regenerative braking employed. Vehicle rear brake tend to lock and skid far easier that front wheel due to normal weight balance allocation and dynamic weight shifting during braking. Once the rear wheels lock up, the vehicle anti-lock braking system, ABS, will be engage and start to module the brake line pressure. Engagement of ABS pre-empts regenerative brakes in Electric or Hybrid vehicles regardless of architecture. There are several versions of regenerative braking systems available depending on the level of energy recuperation anticipated they are
1. Series regenerative braking system
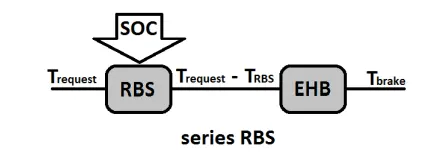
Series regenerative braking system (RBS) introduce electrical regeneration sequentially with the vehicle’s service brakes in proportion to the brake pedal position. When the brake pedal is depressed the vehicle experiences velocity retardation in proportion to engine compression braking. This is a very mild deceleration effect and one that drivers expect. As the brake pedal is further depressed, an algorithm computes the M/G braking torque (regen.) so the vehicle kinetic energy recuperated and sent to the traction battery is controlled to mimic normal foundation brake feel. if the brake pedal is depressed further, the deceleration effect is more noticeable, and at some pre-defined point, the service brakes are blended in with M/G torque. As the speed decreases, and accounting for transmission down shifts, there will come a point when M/G efficiency is too low for regeneration, so that it will be commanded off and only service brakes are left in effect. Brake coordination is a complex function of brake pedal position, rate of pedal application, and vehicle speed. Properly coordinated front-rear braking force optimizes stopping distance without loss of tire adhesion. Series RBS is typically implemented with electro-hydraulic brake, EHB, hard-ware. EHB consists of hydraulic control unit that manages brake cylinder pressures and front-rear axle brake balance.
2. Parallel regenerative braking system
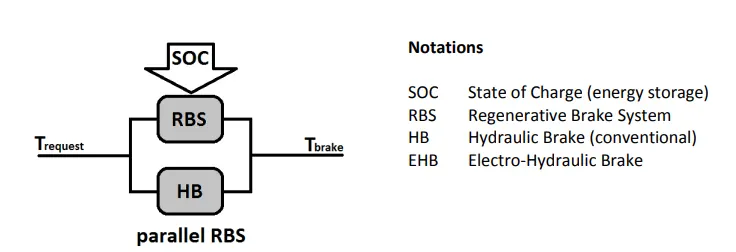
A parallel RBS system is easier to implement than series RBS full EHB is not required. The parallel system immediately activates the vehicle service brakes anytime the brake pedal is depressed. An algorithm is needed to blend M/G torque with service brake force so that the total deceleration effect is smooth and seamless to the driver. Front-rear brake coordination is similar to that for series RBS so that vehicle stability is maintained. With parallel RBS the fuel economy benefit is not as pronounced as for series RBS because some fraction of vehicle kinetic energy is always dissipated as heat rather than used to replenish the battery.
3. RBS interaction with ABS
For normal rate of application of pedal position, the total braking effort in electric/hybrid vehicle will be depending on whether the brake system implemented is series or parallel RBS, respectively. However, if the brake pedal apply pressure is brisk there is a tendency for wheel lock-up and skid. The anti-lock-braking system, ABS was introduced as a mechanism to intervene in the braking process should the operator engage the brakes too harshly and cause loss of longitudinal stability as a result of a skid. With ABS the brake line pressure is modulated so that wheel skid is avoided. Braking distances are shorter, vehicle stability is better managed, and the tendency to excite vehicle yaw motion is minimized, especially on low mu surfaces (i.e. snow, ice, wet pavement, etc.)
Objective 3:
Make a MATLAB program which plots contour of given motor speed, torque and efficiency values. Attach the code as a .m file attach a screenshot of all the plots.
Let consider a range of values from 0 to 1500 radians per second whereas for the torque, consider a range of values from 0 to 200Nm
copper loss efficiency cu = 19%
Irron loss efficiency fe=0.7%
windage loss we=0.0020%
constant loss 20%
we know that
Output power = Speed*Torque
Input power=Output power+Cu loss+Iron Loss+windage loss+constant loss
efficiency `eta=(Output power)/(Input power)`
Matlab code for to plots contour of given motor speed, torque and efficiency values is
clear all
close all
clc
% Speed Array
omega = linspace(0, 200, 100);
% Torque Array
T = linspace(0, 1500, 100);
% Meshgrid
[X,Y] = meshgrid(T, omega);

% Loss Coefficients
cu = 0.19;               % Copper coefficient
fe = 0.007;              % Iron coefficient
win = 0.000020;          % Windage coefficient

% Losses
cu_loss = cu*(Y.^2);     % Copper Losses
fe_loss = fe*(X.^2);     % Iron Losses
win_loss = win*(X.^3);   % Windage Losses
cond_loss = 20;          % Conduction Losses

% Output Power
P_out = (X.*Y);
% Input Power
P_in = P_out + (cu_loss) + (fe_loss) + (win_loss) + (cond_loss);
% Efficiency
n = ((P_out)./(P_in));

% Efficiency values for contour
W = linspace(0.75, 0.95, 10);
% Contour Plot
contour(X,Y,n,W)
xlabel('Angular Speed, rad/s')
ylabel('Torque, Nm')
title('Speed, Torque and Efficiency characteristics of Motor')
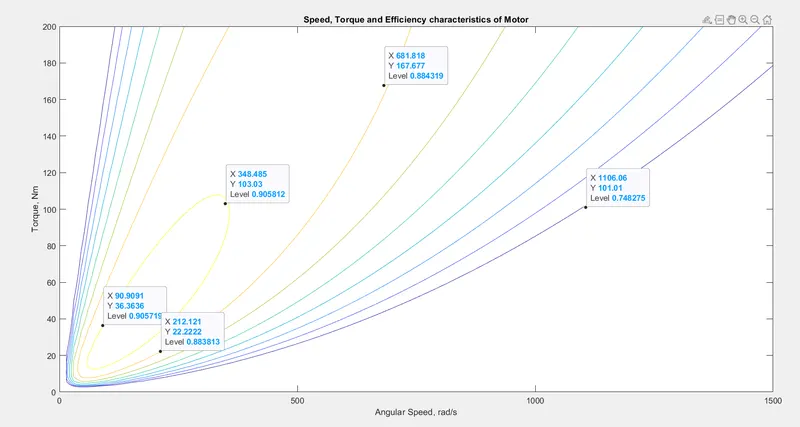
Output
Finally, we plot the contour with the 'contour' command. Besides, an array for the efficiency values we want to plot for is created called 'W' and is assigned for values ranging from an efficiency level of 0.75 to 0.95. This array is used in the creation of the contour. Axis labels and a title are also made for better readability. we can see that the highest level of efficiency arises in the innermost contour plot and this efficiency decreases as the contours increase in size from the innermost contour.