Week-4 Challenge WOT Condition Part-2
Aim:
- To explain difference between mapped and dynamic model of engine, motor and generator and explain how can we change model type.
- To expalain how does the model calculate miles per gallon and which factors are considered to model fuel flow.
- Run the HEV ReferenceApplication with WOT drive cycle. Change the grade and wind velocity in the environment block. Comment on the results.
- Keeping all other parameters same, compare the simulated results of hybrid and pure electric powertrains.
Requirements:
MATLAB
Simulink
Powertrain Blockset
Objective 1:
To explain difference between mapped and dynamic model of engine, motor and generator and explain how can we change model type.
1. Difference beween mapped and dynamic model of engine.
|
Mapped |
|
Model uses a set of steady-state lookup tables to characterize engine performance. The tables provide overall engine characteristics, including actual torque, fuel flow rate, BSFC, and engine-out exhaust emissions. |
|
|
Dynamic |
|
Model decomposes the engine behavior into engine characteristics that are separated into lower-level components. By combining components in this way, the models capture the dynamic effects. |
|
2. Difference between mapped and dynamic model of motor
| Mapped | Mapped Motor | Model uses a set of steady-state lookup tables to characterize engine performance. | Implements a mapped motor and drive electronics operating in torque-control mode. Specify electrical torque range with a torque-speed envelope or maximum motor power and torque. Output torque tracks a torque reference demand and includes a motor and drive response time constant. Specify electrical losses as a single operating point that estimates loss across the operating range, measured loss, or measured efficiency. |
| Dynamic | Dynamic Motor | Model decomposes the engine behavior into engine characteristics that are separated into lower-level components. By combining components in this way, the models capture the dynamic effects. |
To analyze the impact of individual engine components on the overall performance. 1. Interior PM Controller SS Trq 2. Three-Phase Voltage Source Inverter 3. Interior PMSM SS Spd |
3. Difference between mapped and dynamic model of Generator
| Mapped | Mapped Generator | Model uses a set of steady-state lookup tables to characterize engine performance. | Implements a mapped Generator and drive electronics operating in torque-control mode. Specify electrical torque range with a torque-speed envelope or maximum generator power and torque. Output torque tracks a torque reference demand and includes a generator and drive response time constant. Specify electrical losses as a single operating point that estimates loss across the operating range, measured loss, or measured efficiency. |
| Dynamic | Dynamic Generator | Model decomposes the engine behavior into engine characteristics that are separated into lower-level components. By combining components in this way, the models capture the dynamic effects. |
To analyze the impact of individual engine components on the overall performance. 1. Interior PM Controller SS Trq 2. Three-Phase Voltage Source Inverter 3. Interior PMSM SS Spd |
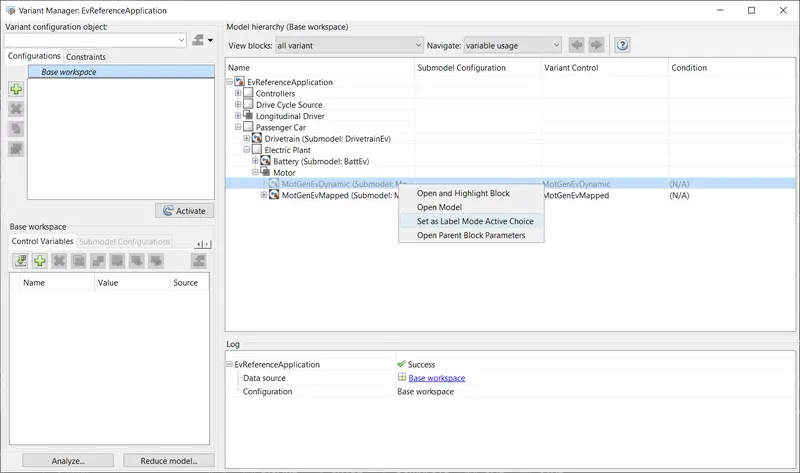
4. Change model type from mapped to dynamic or vise versa.
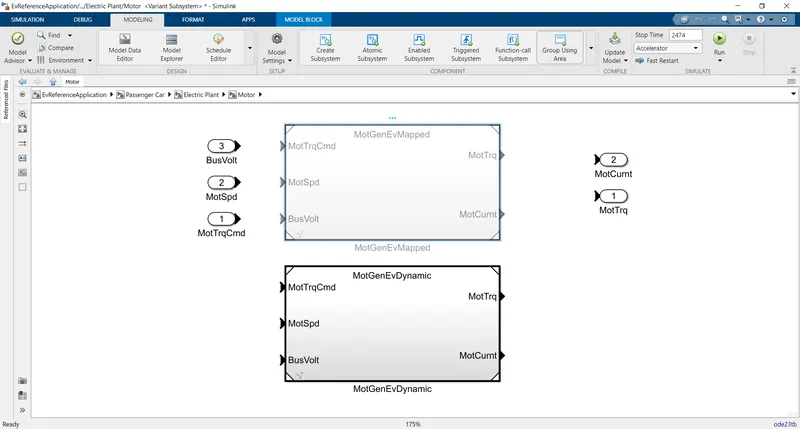
We can able to change modelvariant of motor generator or engine varient from model hierachy (Base workspace) of Varient manager avialabe in Modeling library.
Objective 2:
To expalain how does the model calculate miles per gallon and which factors are considered to model fuel flow.
Let run HEV reference model, see the rresult
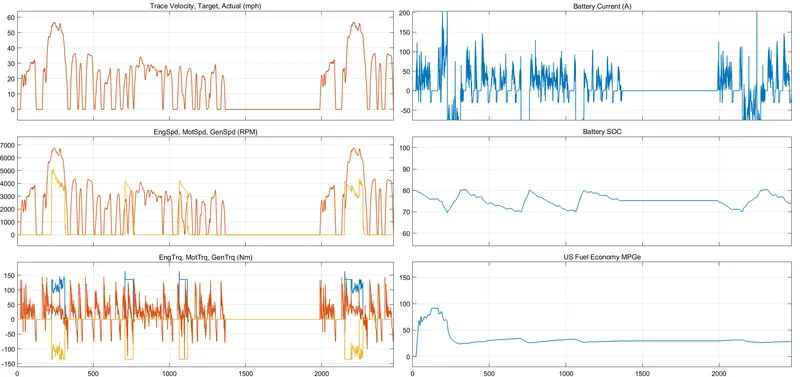
I need to caluclate the fuel economy between time range of 158.804 seconds and 302.564 seconds.
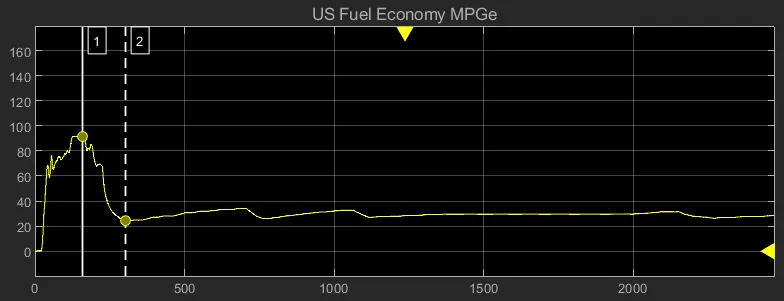
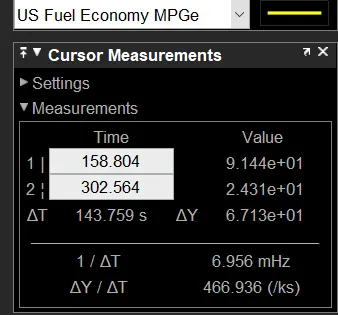
Here we seen change in miles per gallon from 9.144 to 2.431 repectively. so the fule drop due toengine is 6.71 miles per gallon.
Factors considered for model flow is Engine torque, Motor torque, Genrator torque and fuel avialable.
Objective 3:
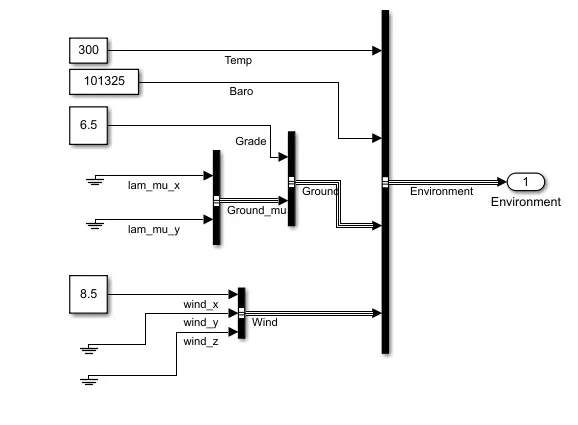
Run the HEV ReferenceApplication with WOT drive cycle. Change the grade and wind velocity in the environment block. Comment on the results.
A hybrid electric vehicle is a type of hybrid vehicle that combines a conventional internal combustion engine system with an electric propulsion system. The presence of the electric powertrain is intended to achieve either better fuel economy than a conventional vehicle or better performance
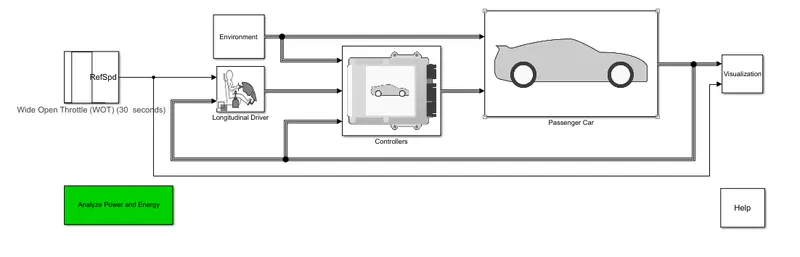
Let im Assumuning Gradability of car is 6.5 and wind velocity is 8.5 m/s and Run the simulation of HEV refence model.
Output result:
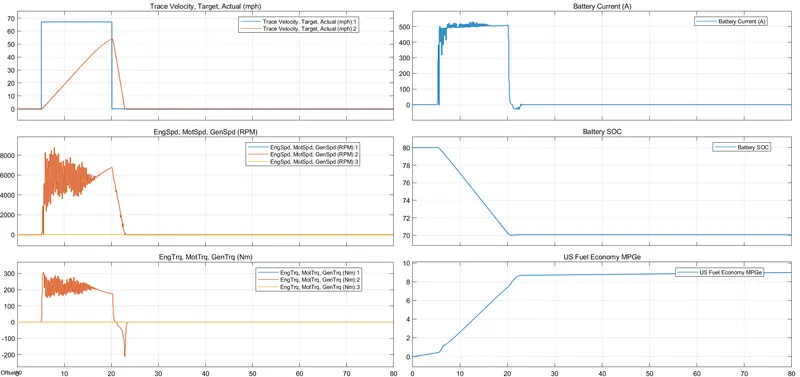
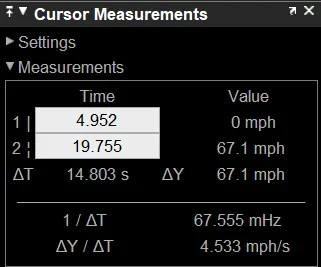
From the result we obsorbed that When open Wide throttle applied to the HEV car gone 0 to 67.1 m/hr within the time of 14.803 seconds.
Objective 4:
Keeping all other parameters same, compare the simulated results of hybrid and pure electric powertrains.
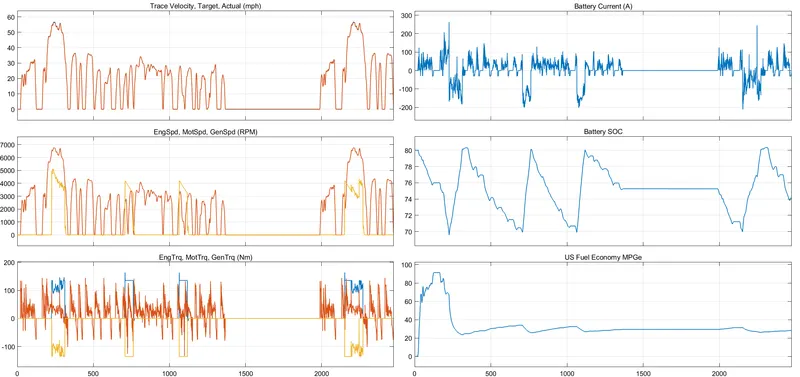
Hybrid Electric Vehicle simulated result
Electric Vehicle simulated result
Comparison on simulated results.
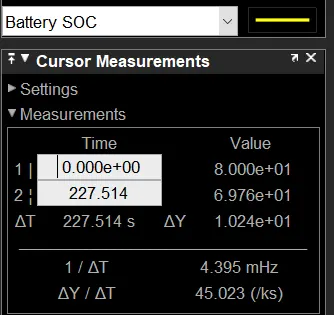
Comparison 1: a.) Battery SOC is increasing and decreasing in HEV because of power genrating some situations like vehicle running on only fuel mode or Regenerating mode parallelly Generator generates the power and fed it to battery. see observation HEV result
at starting from 0 to 227.514 seconds vehicle running under battery mode and battery soc is decreased from 80 to 70.
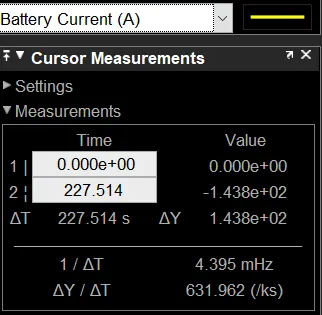
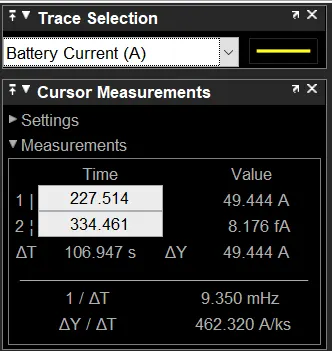
b.) Battery SOC is descreasing simultaneously no fluctuation in SOC becouse regeneration is not avilable and veicle is running with Battery as power source. SOC decreased from 80 78.5 drawn a currrent of 49.44A
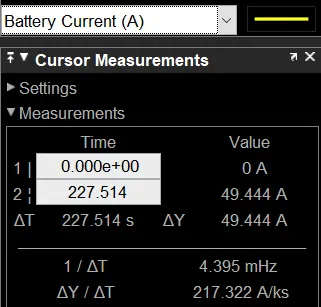
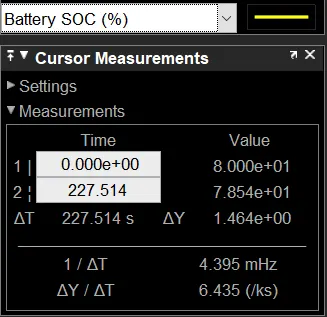
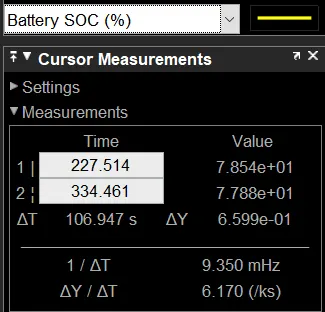
Comparison 2: 1.) Time period 227.54 to 334.461 of 106.947 seconds Hybrid Electric Vehicle running under Fuel mode. Taking fuel as power source. Here SOC is increasing from 70 to 80 because generator is coupled to engine which produces and supplies Electric power to Battery.
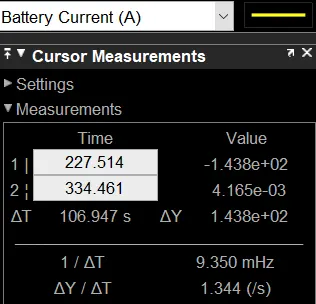
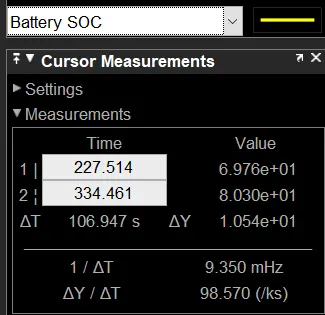
2.) Electric vehicle SOC is decreased from 78.5 to 77.88 and current drawn is 49A from the batttery.
Comparison 3: Hybrid Electric vehicle uses fuel and battery power as power source for transmission as in Elecric Vehicle uses Battrery as Power source for transimmision.