Week - 4
Aim:
1. To implement control logic of a “washing machine” using Stateflow.
2. To Make a Simulink chart for the “Gear shift” logic.
Objective 1
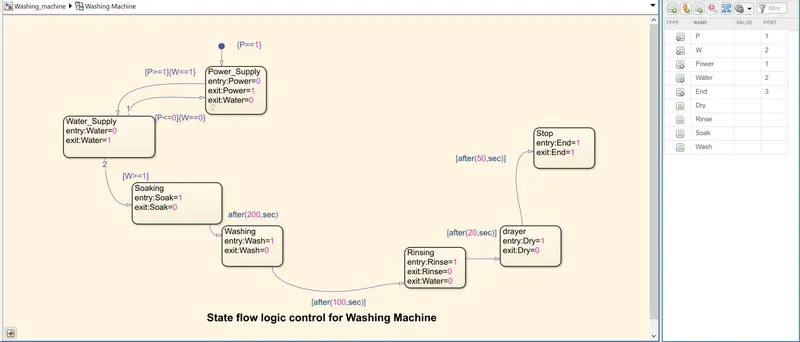
To Implement control logic of a “washing machine” using Stateflow as per given sequence:
- If the power supply is available, the system gets activated
- If the Water supply is not available, stop the process & indicate through LED
- Soaking time should be 200s followed by Washing time of 100s.
- Then rinsing happens for next 20s & dryer runs for 50s
After all the processes have completed turn on the finished LED
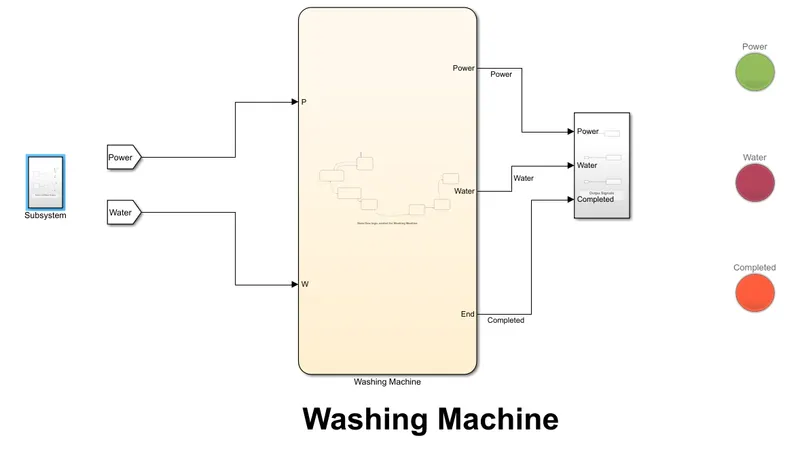
State flow
Theory:
Initially the washing machine drum is empty and we had added the clothes and here water is going to filled. Initially supply available, clothes keep inside. And there will be a typed sensor which is going to check out for water available.
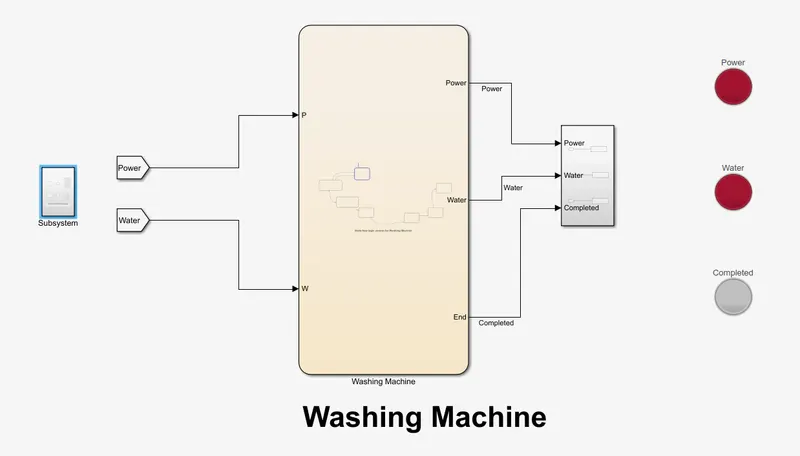
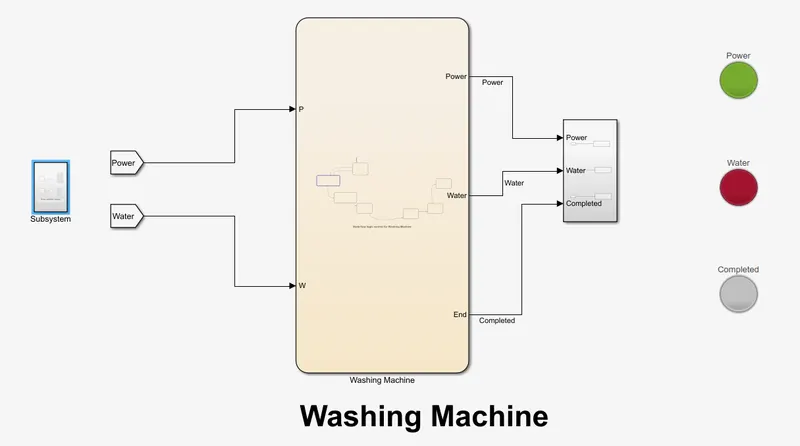
Soaking: If water available is going to filled up drum. Once water is filled up and we have to adde detergent then the washing going to get started.
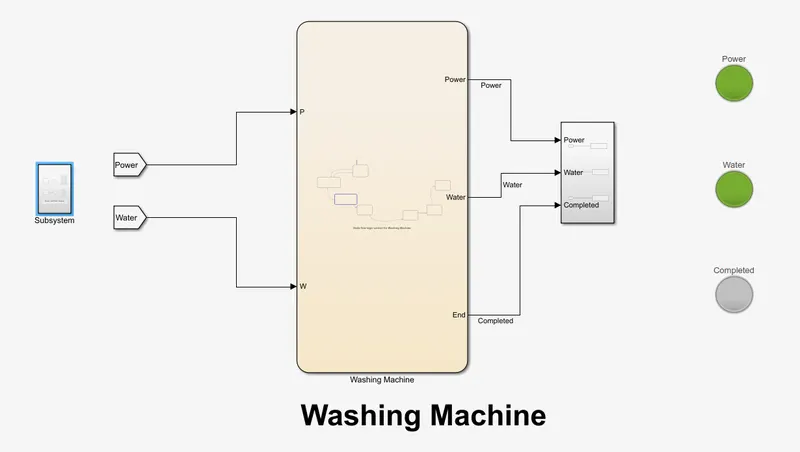
Washing: The washing machine motor is going to run in forward or reverse directions and the clothes along with with the water they are going to get washed.
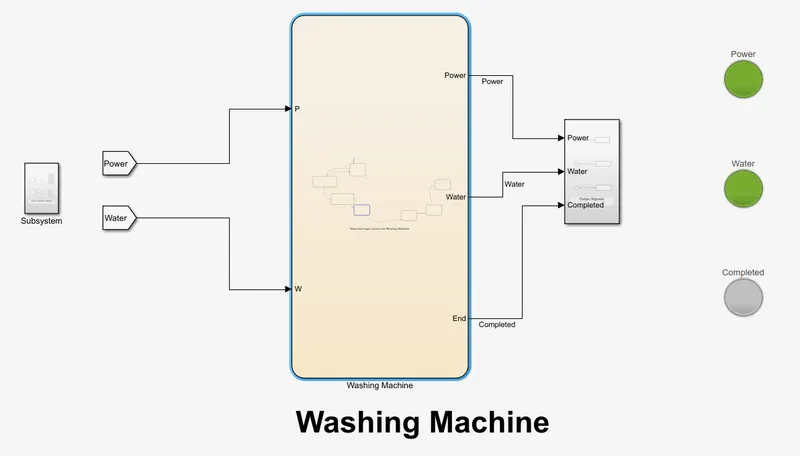
Rinsing: Once the washing is done rinsing activity going to started, to get the water out and that may be the main valve.
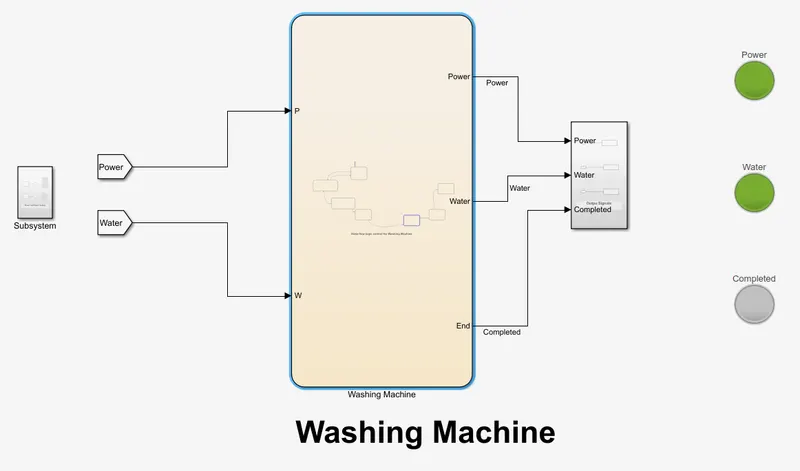
drying: For drying out the clothes the spinning going to occur and it may require some hot air or may be some kind of an heating and now the clothes will get dryed out.
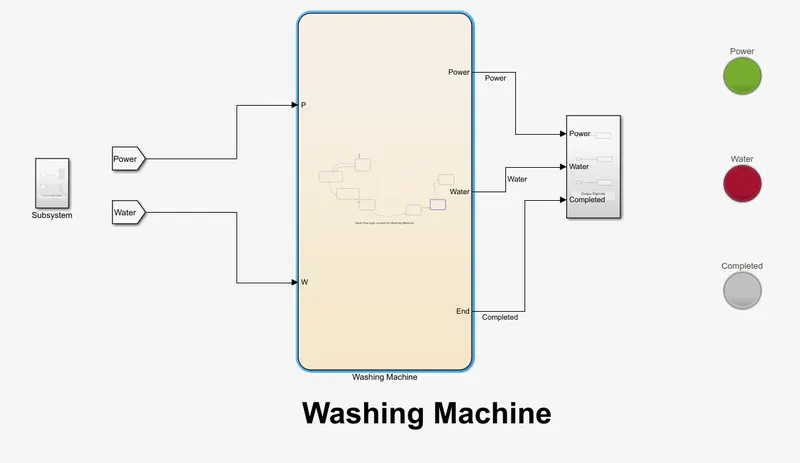
completed: Now washing is completed here shows the Led turn ON.
Blocks Used:
Chart: Chart mode is different then simulink Mode, Chart mode is where we actually create our control logic. Whatever we have obsorbed earlier simulink mode was having the white background and now have the white yellow background. Apart from that we have also some symbols coming up in the window.
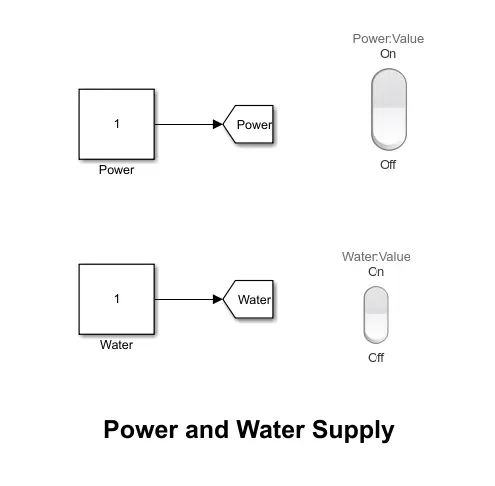
Rocker Switches:
These switches are used to control power supply and water supply manually to the washing machine
GoTo:
Simulink routing where we need to give it a proper name and the signal is going to be available to whatever point we need to send it.
FromTo:
from is the another routing component which will help us to plot all the quatities at time.
Subsystem:
A subsystem is a set of blocks that you group into a single Subsystem block. Using subsystems: Establishes a hierarchical block diagram, where a Subsystem block is on one layer and the blocks that make up the subsystem are on another. Keeps functionally related blocks together.
Led Indications:
LED indications are used to know the state of waching machine. Here, 'Power,' 'Water state 'and 'Finish or Complete' to know the waching has completed or not
Output
Implemented control logic of a “washing machine” using Stateflow as per given sequence and After all the processes I have completed turn on the finished LED.
Objective 2:
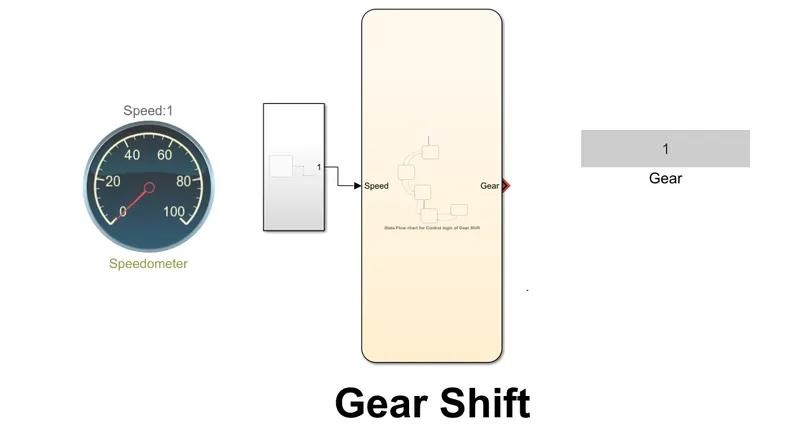
To Make a Simulink chart for the “Gear shift” logic as per below conditions:
Speed Range(kmph) Gear
0 to 15 1
16 to 25 2
26 to 40 3
41 to 60 4
Above 61 5
Give speed input while the simulation is running & display the gear number.
Theory:
Gear shift is having a manual transmission system. So initially we have to start our car and we will be keeping a Gear-1 till the speed is above 15Km/hr similarly.
Speed Range(kmph) Gear
0 to 15 1
16 to 25 2
26 to 40 3
41 to 60 4
Above 61 5
Now check the speed accordingly these gear positions are going to be choosen from either 1, 2, 3,4 and 5. So all these gear positions will be selected based on the sensed value of the speed. And actually speed is not just a number it is actually going to be a Range. So when our car speed is going to fall from below 60km/hr then we need to shift down to Gear-4. So shift up and downis called a logic, they are important decitions made by the driver.
Here shows the gear govern shift and speed as per the speed varied.
Gear-1, 0 to 15km/hr.
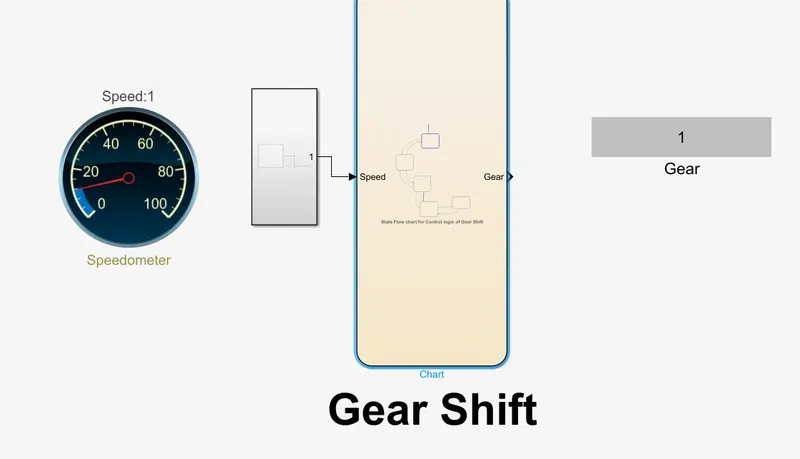
Gear 2, 16 to 25km/hr
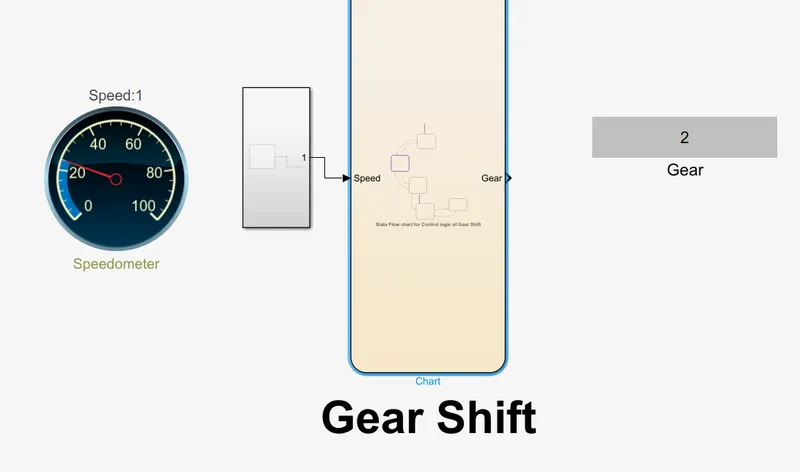
Gear3, 26 to 40 km/hr
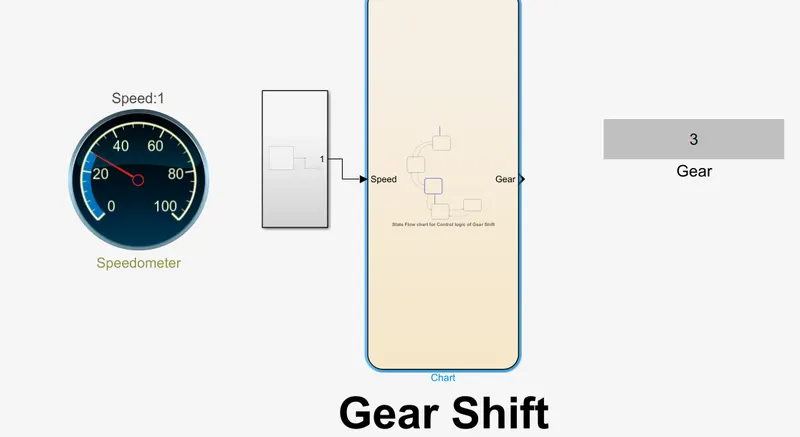
Gear 4, 41 to 60km/hr
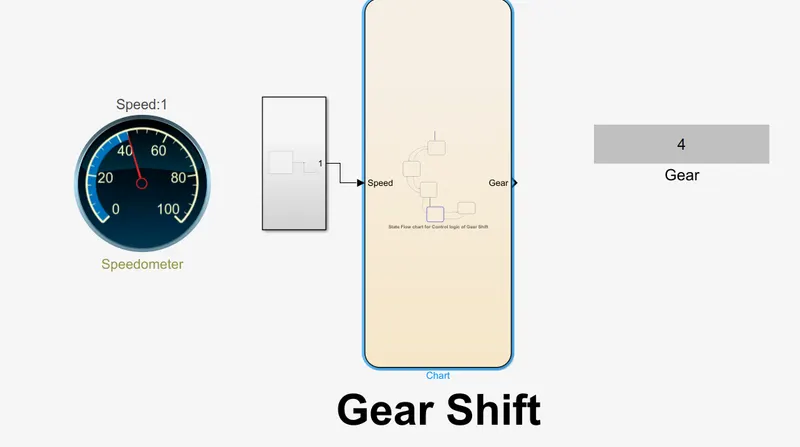
Gear 5, 61km/hr above
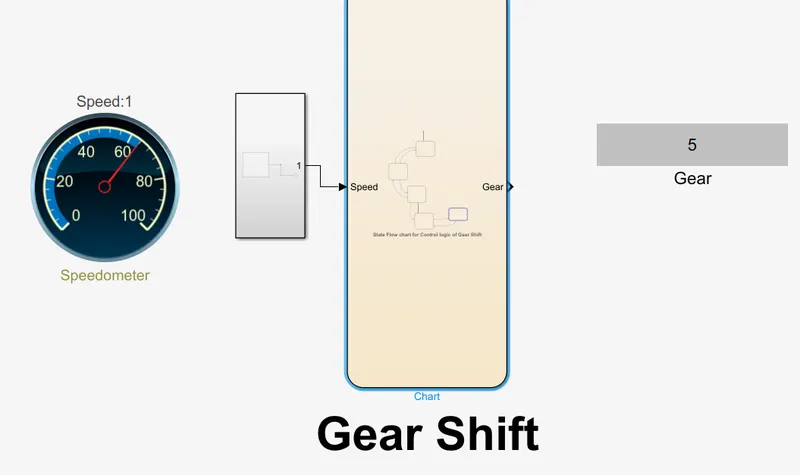
Blocks used:
Circular guage:
Display an input value on a customized gauge.
Repeating sequence:
Output a repeating sequence of numbers specified in a table of time-value pairs, values of time should be monotically increasing.
Dispaly:
The Display block shows the value of the input data. You can specify the frequency of the display. For numeric input data, you can also specify the format of display. If the block input is an array, you can resize the block vertically or horizontally to show more than just the first element.
Chart: Chart mode is different then simulink Mode, Chart mode is where we actually create our control logic. Whatever we have obsorbed earlier simulink mode was having the white background and now have the white yellow background. Apart from that we have also some symbols coming up in the window.
Subsystem:
A subsystem is a set of blocks that you group into a single Subsystem block. Using subsystems: Establishes a hierarchical block diagram, where a Subsystem block is on one layer and the blocks that make up the subsystem are on another. Keeps functionally related blocks together.
OUtput:
Make a Simulink chart for the “Gear shift” logic as per given conditions, given speed input while the simulation is running & display the gear number.