Week 11 Challenge
Aim:
To calculate the temperature loads acting on the bridge and to design and apply it in Stadd Pro. model and analyse.
Given:
The span of the bridge = 9m.
The Width and Depth of the Box girder = 1500 mm.
The thickness of web of box girder = 300 mm.
The diameter of the circular pier = 2.5m
The width of Deck slab = 7m.
The width of pier cap = 6m.
The Thickness of Deck slab = 550mm.
Introduction:
Temperature loads are caused due to fluctuations in the shade air temperature and solar radiation this in turn causes differential temperatures in the bridge. This differential temperature causes the bridge to expand and contract. When the bridge structure is effectively restrained against movement, expansion and contraction due to the temperature differential are not allowed causing the bridge to experience internal stress leading to cracks and distress of the structure. This phenomenon is called temperature loading. The differential temperature can be calculated per IRC 6 - 2017.
Procedure:
Part I: Calculation of temperature load:
The bridge is located in Delhi, from IRC 6 - 2017, Annexure F, the maximum temperature and minimum temperature of the given location can be determined. Refer to figure 1.,
The maximum temperature in Delhi is 48.4 °
The minimum temperature in Delhi is -2.2 °
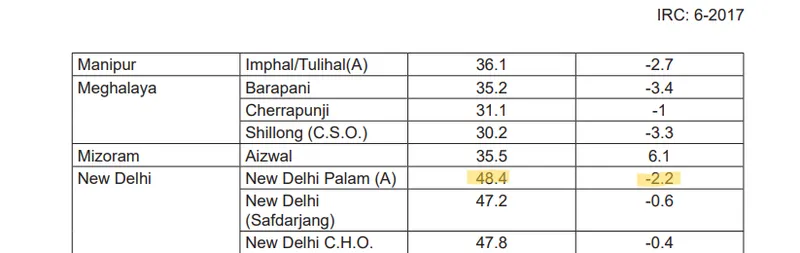
Figure 1
The effective temperature difference = ( Tmax - Tmin) / 2 + Range of bridge temperature.
where,
Tmax = The maximum temperature,
Tmin = The minimum temperature.
The effective temperature difference = ( 48.4 - 2.2 )/2 + 10
Though the minimum temperature is minus, in the formula it shall be substituted as value only.
The effective temperature difference = 33.1 °
The stress due to temperature = α x ▲T x E
The stress due to temperature = α x ▲T x 5000 √fck
where,
α = Coefficient of thermal expansion
▲T = Effective temperature difference
fck = Compressive strength of concrete
The stress due to temperature = 11.27 x 10⁻⁶ x 33.1 x 5000 √40
The stress due to temperature = 11.79 kN/m²
Maximum permissble stress = (2/3) x 0.7 x √fck
where,
fck = Compressive strength of concrete
Maximum permissble stress = (2/3) x 0.7 x √40
Maximum permissble stress = 2.95 kN/m²
Hence the stresses are restricted to 3 kN/m²
As per IRC 6, with the given details,
Temperature at top = 48.4 °
Temperature at bottom = (2.1/17.8) x 48.4 ° = 5.71 °
Part II: Modelling and Analysis of Bridge in Stadd Pro. :
Step 1: Open Stadd Pro connect edition software -> create a new file with the units set to metric standards.
Step 2: Select the geometry tab and enter the values of the node in the y column in the node table as 0 and 10 respectively which will create two nodes. Add beam cursor in geometry tab -> connect these nodes creating a pier.
Step 3: Select the beam using the beam cursor -> translational repeat in geometry tab -> translate the beam for a step in the X direction for 9m creating one more pier at the other end of the bridge -> Connect the top nodes of the piers using add beam command in geometry.
Step 4: Select the top nodes of the piers using the node cursor in geometry ( Refer to figure 1 ) -> translate repeat the nodes along the Z direction for two steps for a length of 3m -> Connect the nodes using add beam cursor, Refer to figure 2. Repeat the same along the -Z direction.
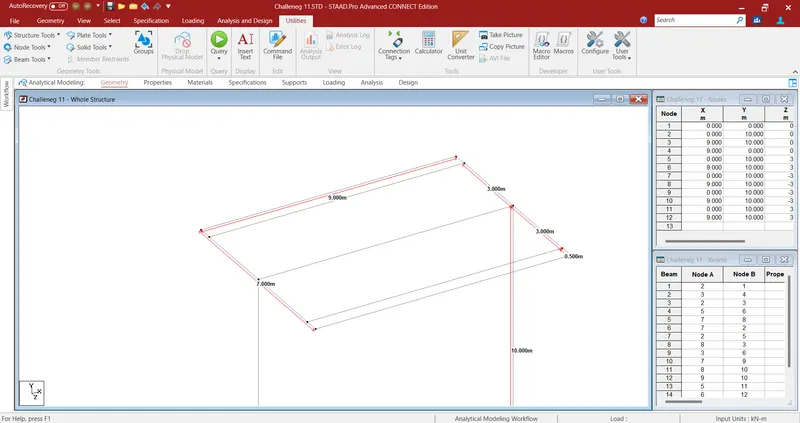
Figure 2
Step 5: Translational repeat -> select the highlighted node in Figure 3 and translational repeat it along the X direction for a step of 0.25 length -> Select both these nodes and translational repeat them along the Z direction for a step of 0.25 length -> Using add plate cursor connect these four nodes and create a plate. Refer to figure 4.
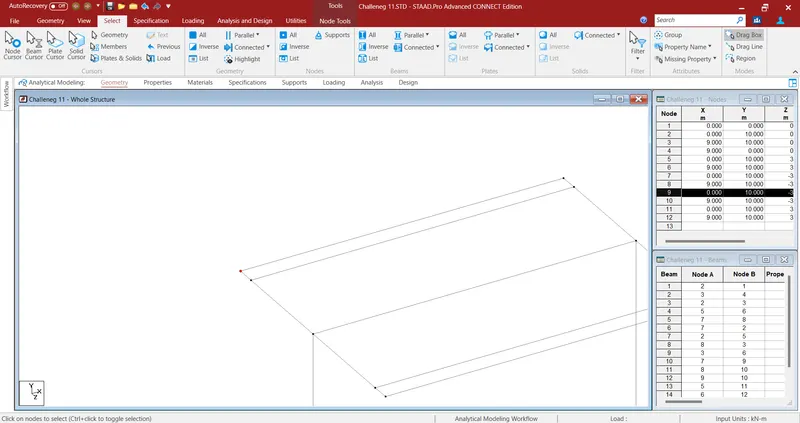
Figure 3
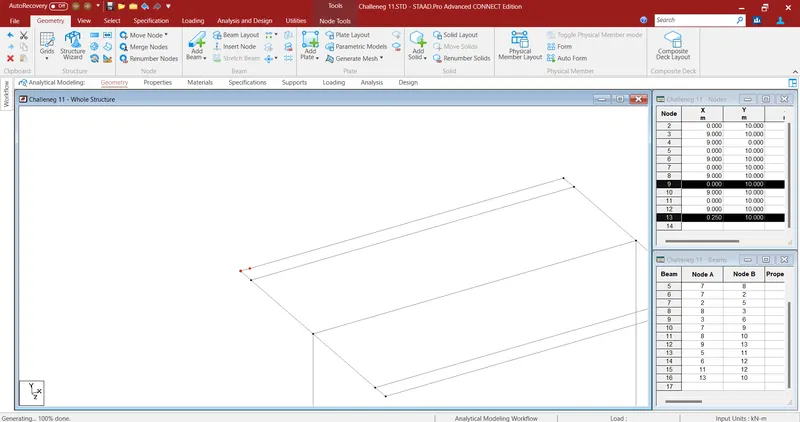
Figure 4
Step 6: Select the plate -> translational repeat that plate along the X direction for 35 steps of 0.25 length each ( 9/0.25 = 36 since one plate is there, 35 steps ). Select the created plates and translational repeat them along the Z direction for 27 steps of 0.25 length each ( 7/0.25 = 28 since one plate is there, 27 steps ) Refer to Figures 5 and 6.
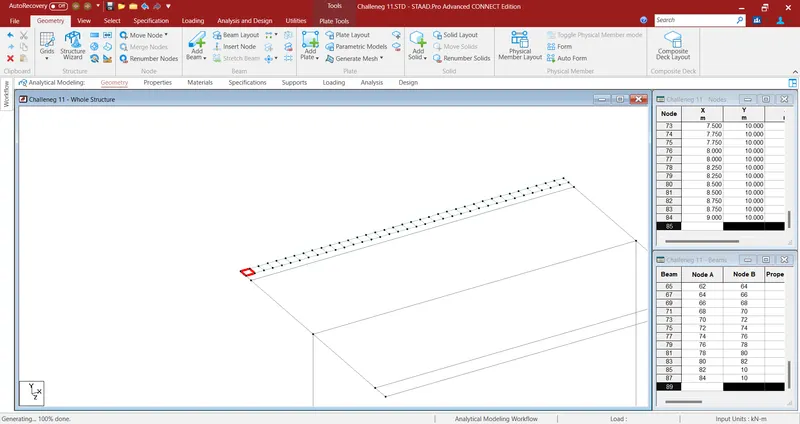
Figure 5
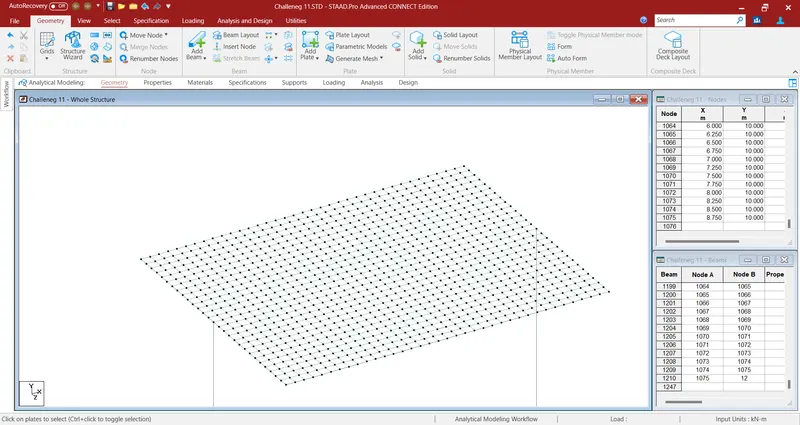
Figure 6
Step 7: Specification tab -> Select fixed and create foundation -> Assign this fixed foundation to the 2 nodes under the piers.
Step 8: Pier - In the Properties tab -> select define -> Circle -> 2.5 -> Assign to the piers -> close.
Step 9: Girders - In the Properties tab -> select define -> tapered tube-> d1 = 1.5m, d2 = 1.5m and thickness of tube = 0.3m -> Assign to the highlighted beams in figure 7 and refer to figure 8 -> close.
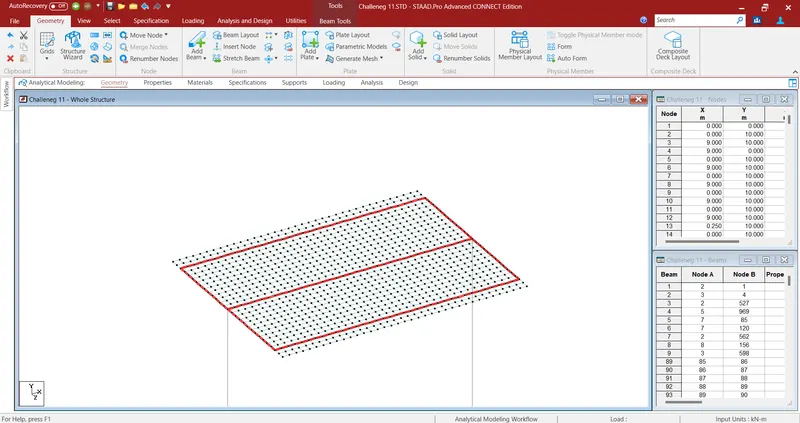
Figure 7
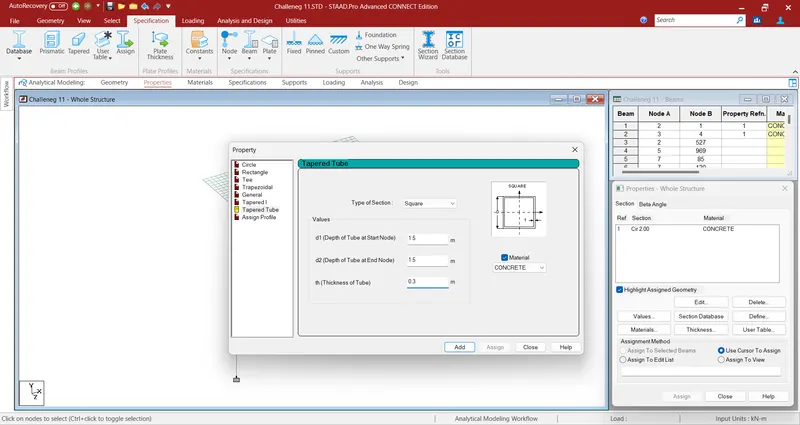
Figure 8
Step 10: Deck - In the Properties tab -> select Thickness -> 0.55m -> Assign to all of the plates -> close.
Step 11: In the loading tab -> Load case details-> click add -> Enter Temperature load -> Click Temperature load and add -> Select Temperature load and enter in Temperature change for axial elongation = 45 ° and Temperature differential from top to bottom = 45 ° and click add. Refer to figure 9.
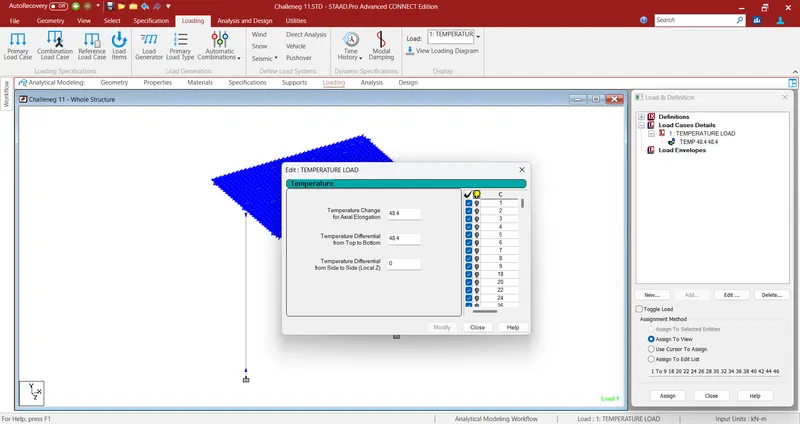
Figure 9
Step 12: These loads act on the entire bridge, Apply this load to the entire bridge -> apply to view.
Step 13: Thus Temperature loads has been applied to the structure. Save the file and Run the analysis by -> Click analysis and design tab -> click define commands -> no print, click add -> click run analysis and check for errors after computation.
Part III: Results:
The results can be obtained after analysis of the model and can be viewed in the post-processing tab under the workflow section.,
The deflection of the Model can be seen below and the critical displacement is highlighted below., Critical Displacement = 7.543 mm. Refer to Figure 10.,
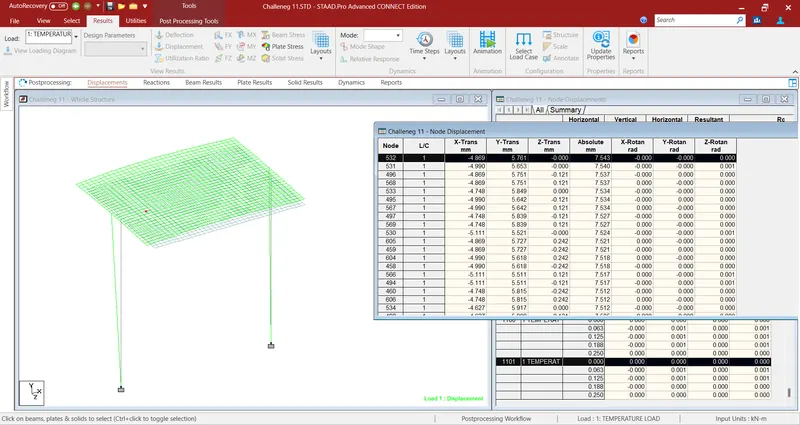
Figure 10
The Reaction of the Foundation can be seen below., Refer to Figure 11.,
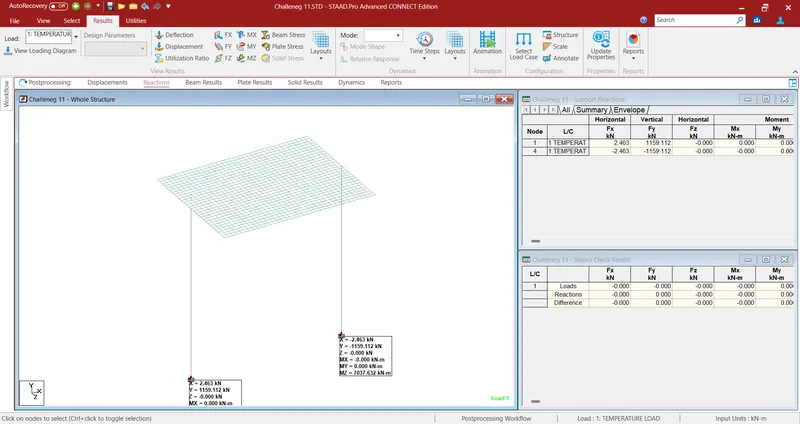
Figure 11
Bending Moment in Z direction - Critical Bending Moment = 1532.838 kN/m. Refer to Figure 12.,
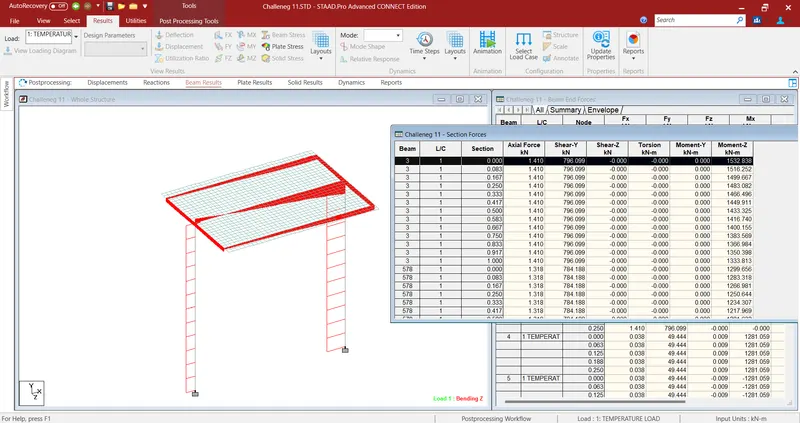
Figure 12
Bending Moment in Y direction - Critical Bending Moment = 0.395 kN/m, Refer to Figure 13.,
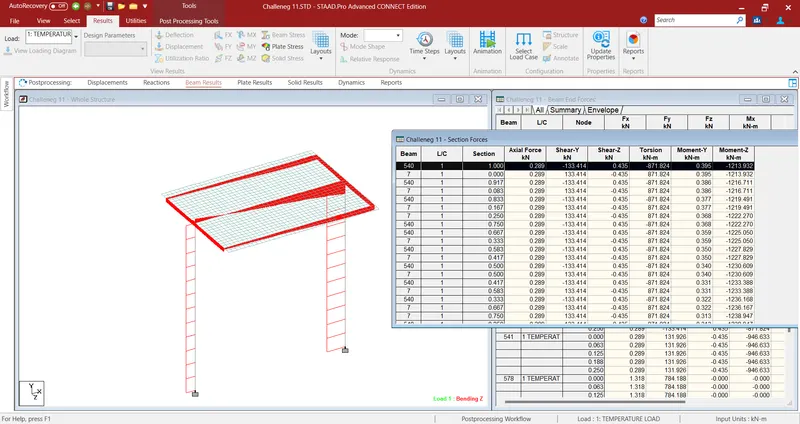
Figure 13
Shear Force in Z direction - Critical Shear Force = 0.435 kN, Refer to Figure 14.,
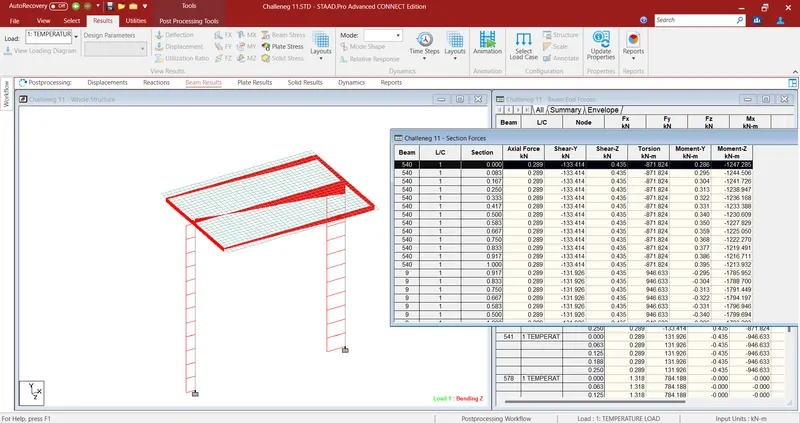
Figure 14
Shear Force in Y direction - Critical Shear Force = 801.550 kN, Refer to Figure 15.,
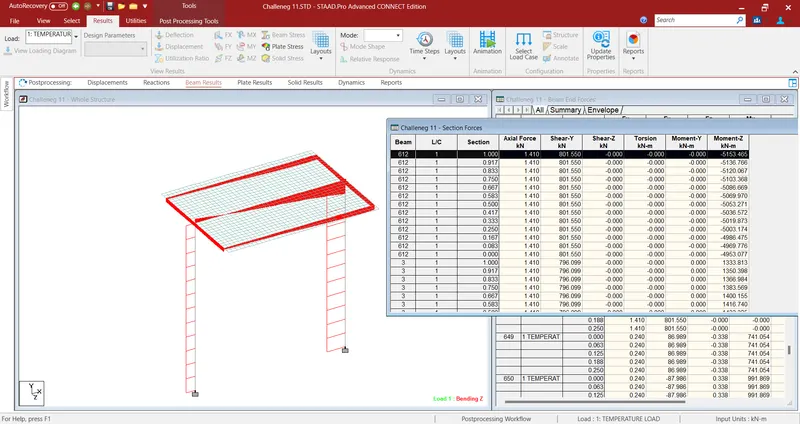
Figure 15
The Plate results of the Model can be seen below.,
Bending Moment in X direction, Critical Bending Moment = -24.131 kN-m/m., Refer to Figure 16.,
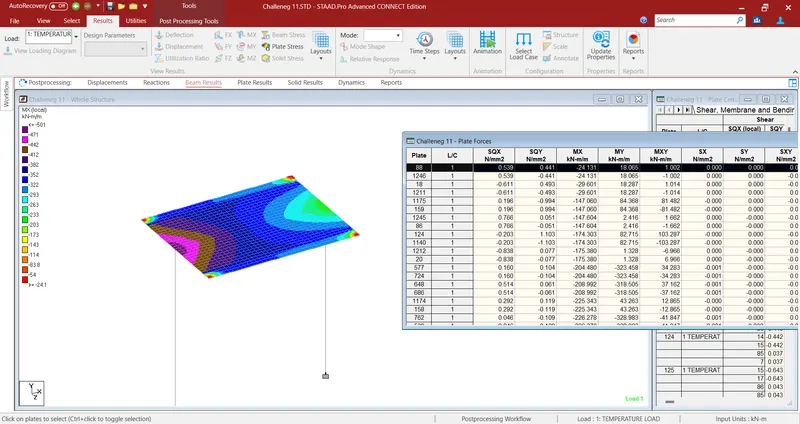
Figure 16
Bending Moment in Y direction, Critical Bending Moment = 84.368 kN-m/m., Refer to Figure 17.,
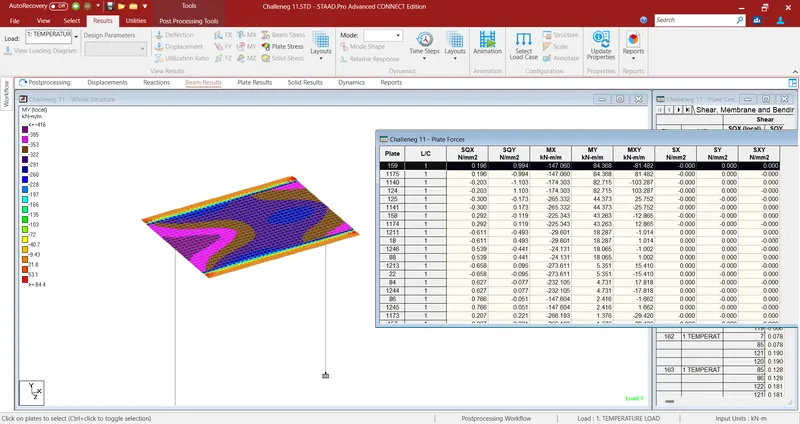
Figure 17
Shear Force in X direction, Critical Shear Force = 0.766 N/mm² ., Refer to Figure 18.,
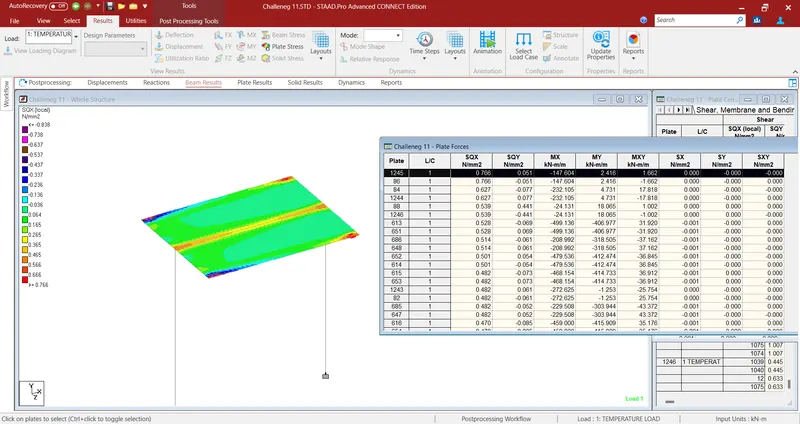
Figure 18
Shear Force in Y direction, Critical Shear Force = 1.103 N/mm² ., Refer to Figure 19.,
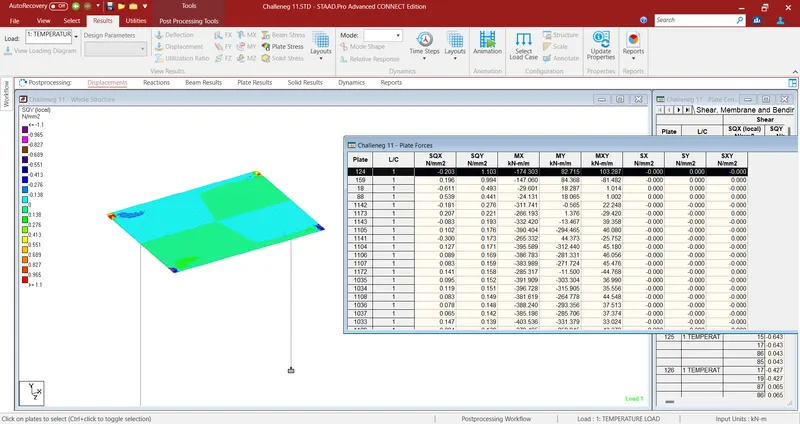
Figure 19
Thus Load calculation manually is done and analysis and result interpretation is done in Stadd Pro.