SIMULATING COMBUSTION OF NATURAL GAS
1.SIMULATING COMBUSTION OF NATURAL GAS:
AIM:
To simulate the combustion of natural gas to calculate the mass fraction and by adding the water in the fuel to observe the effects to avoid harmful effects on environment and human.
OBJECTIVE :
- Perform a combustion simulation on the combustor model and plot the variation of the mass fraction of the different species.
- Add the water content in the fuel from 5% to 30% by mole and observe the effect of it on the results.
INTRODUCTION :
Natural gas is an extremely important source of energy for reducing pollution and maintaining a clean and healthy environment. In addition to being a domestically abundant and secure source of energy, the use of natural gas also offers a number of environmental benefits over other sources of energy, particularly other fossil fuels.
THEORY :
Natural gas is the cleanest of all the fossil fuels, as evidenced in the Environmental Protection Agency Composed primarily of methane.the main products of the combustion of natural gas are carbon dioxide and water vapor, the same compounds we exhale when we breathe.
Coal and oil are composed of much more complex molecules, with a higher carbon ratio and higher nitrogen and sulfur contents. This means that when combusted, coal and oil release higher levels of harmful emissions, including a higher ratio of carbon emissions, nitrogen oxides (NOx), and sulfur dioxide (SO2)
The combustion of natural gas, on the other hand, releases very small amounts of sulfur dioxide and nitrogen oxides, virtually no ash or particulate matter, and lower levels of carbon dioxide, carbon monoxide, and other reactive hydrocarbons.
Natural gas, emitting fewer harmful chemicals into the atmosphere than other fossil fuels, can help to mitigate some of these environmental issues. These issues include:
- Greenhouse Gas Emissions
- Smog, Air Quality and Acid Rain
- Industrial and Electric Generation Emissions
- Pollution from the Transportation Sector – Natural Gas Vehicles
Chemically, this combustion process consists of a reaction between methane and oxygen in the air.
Nitrogen Oxides :
Nitrogen oxides formation occurs by three fundamentally different mechanisms.
The principal mechanism of NOx formation in natural gas combustion is thermal NOx. The thermal NOx mechanism occurs through the thermal dissociation and subsequent reaction of nitrogen (N2) and oxygen (O2) molecules in the combustion air. Most NOx formed through the thermal NOx mechanism occurs in the high temperature flame zone near the burners.
The formation of thermal NOx is affected by three furnace-zone factors:
- oxygen concentration,
- peak temperature, and
- time of exposure at peak temperature.
As these three factors increase, NOx emission levels increase. The emission trends due to changes in these factors are fairly consistent for all types of natural gas-fired boilers and furnaces.
Emission levels vary considerably with the type and size of combustor and with operating conditions (e.g., combustion air temperature, volumetric heat release rate, load, and excess oxygen level).
The second mechanism of NOx formation, called prompt NOx, occurs through early reactions of nitrogen molecules in the combustion air and hydrocarbon radicals from the fuel. Prompt NOx reactions occur within the flame and are usually negligible when compared to the amount of NOx formed through the thermal NOx mechanism. However, prompt NOx levels may become significant with ultra-low-NOx burners.
The third mechanism of NOx formation, called fuel NOx, steams from the evolution and reaction of fuel-bound nitrogen compounds with oxygen. Due to the characteristically low fuel nitrogen content of natural gas, NOx formation through the fuel NOx mechanism is insignificant.
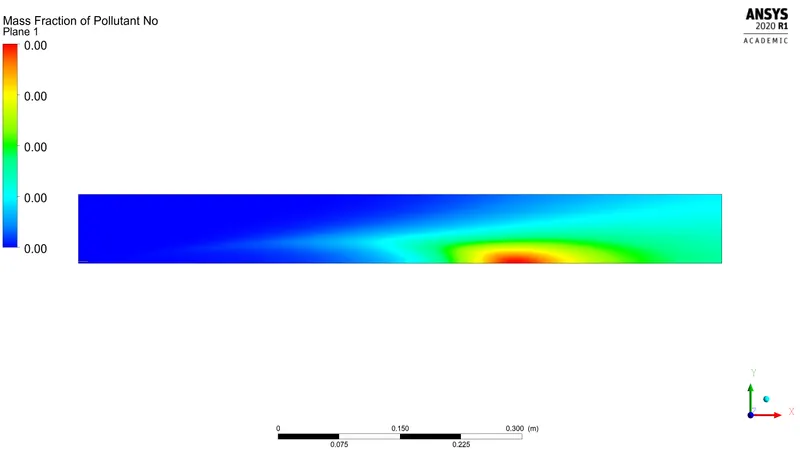
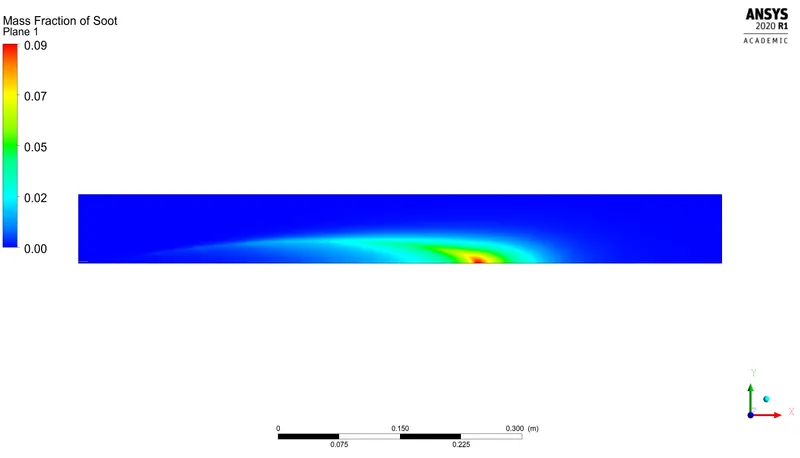
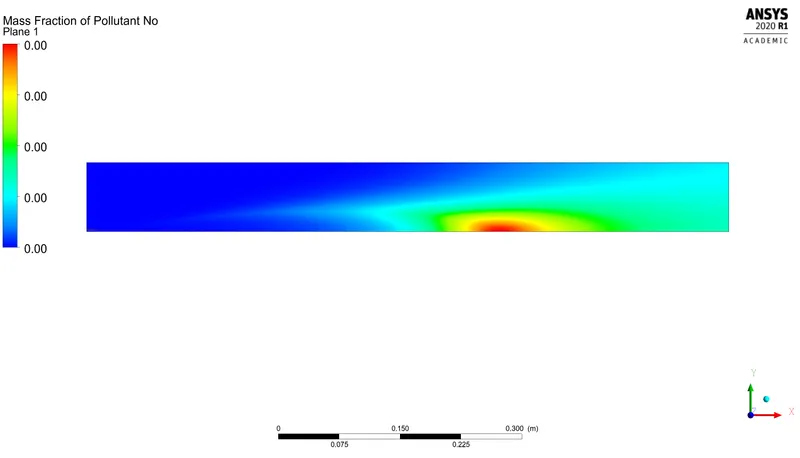
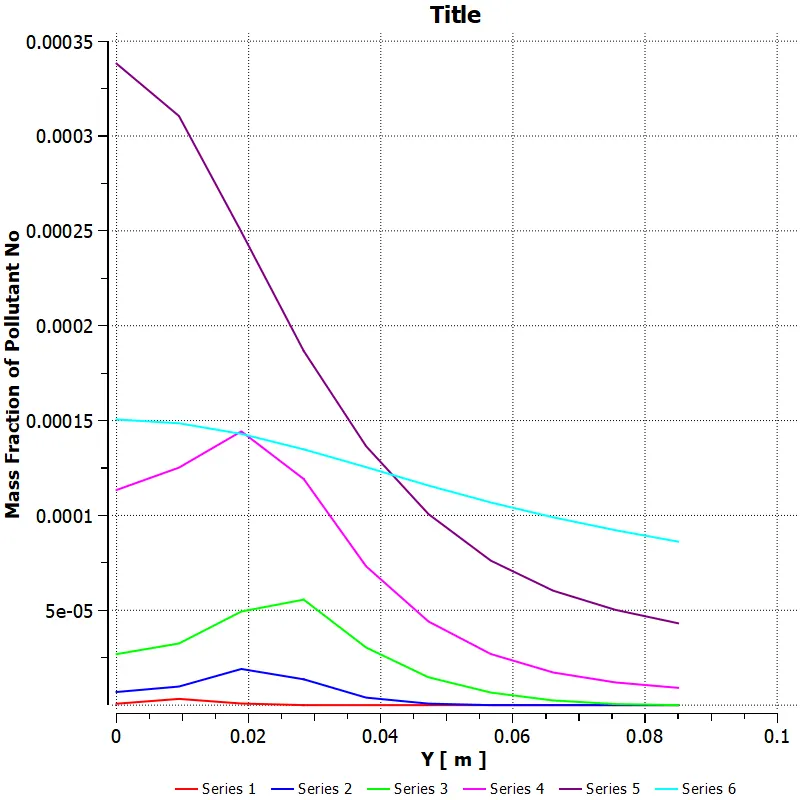
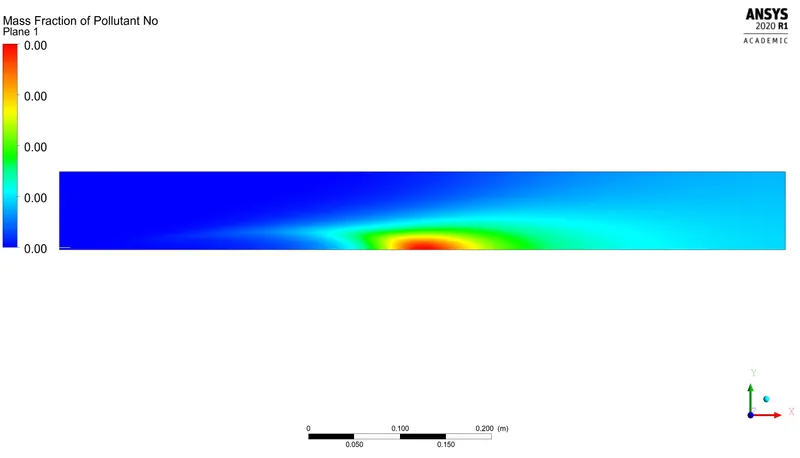
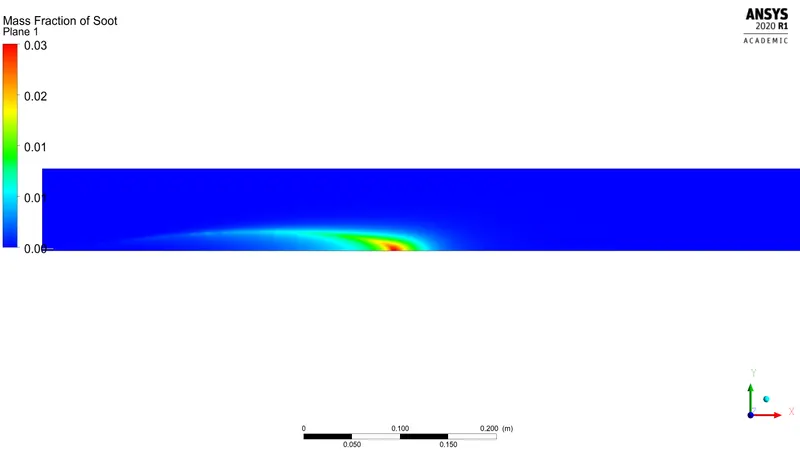
From the simulation, the Nox and soot is getting formed at the outlet of the combustor. Such formation has harmful effects on the environment and humans. The stringent government norms also demand the least formation of Nox and soot and to satisfy those requirements, check the effect of adding the water in the fuel.
Here by adding the water content in the fuel from 5% to 30% by mole and observe the effect of it on the results And line plots and contours are to prove.
MASS FRACTION :
The ratio of mass of a component in a mixture to the total mass of mixture is known as mass fraction.
MOLE FRACTION :
The ratio of number of molecule of one component of solution or other mixture to the total number of moles representing all of the components.
MODELLING APPROACH :
PREPROCESSING(GEOMETRY) :
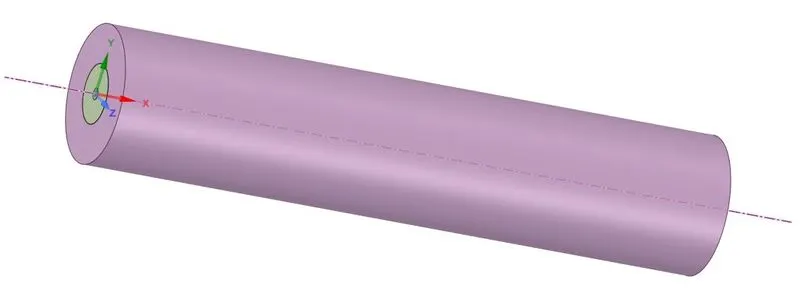
3D model :
2D model :

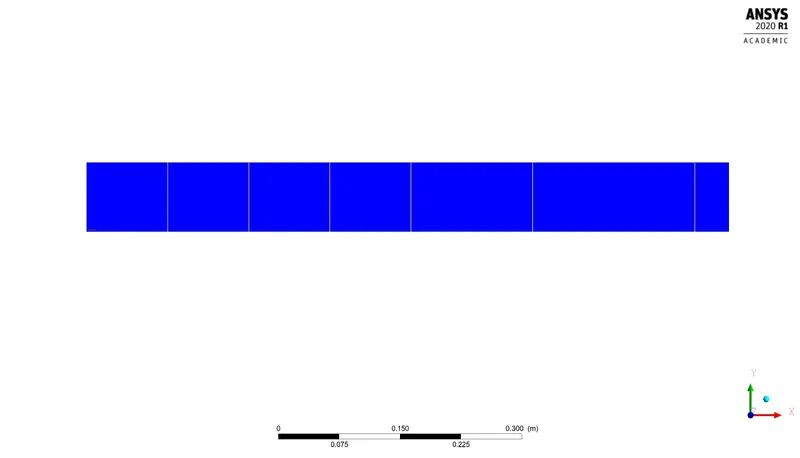
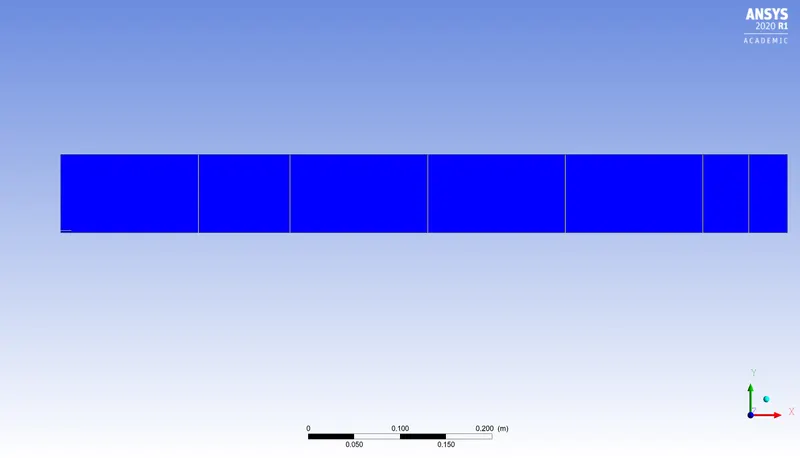
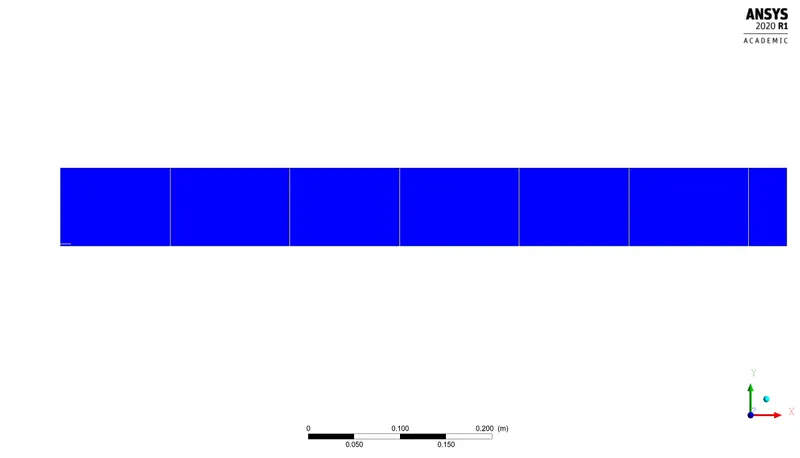
Given 3D geometry model is madeup into 2D geometry by creating the plane XY and using the split body command to split up the region.
MESH :

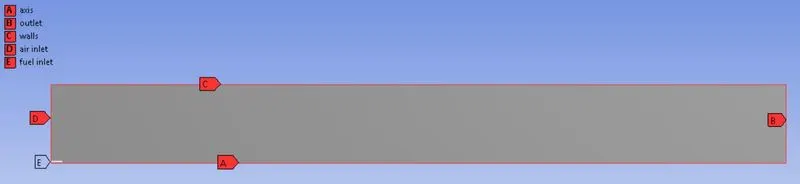
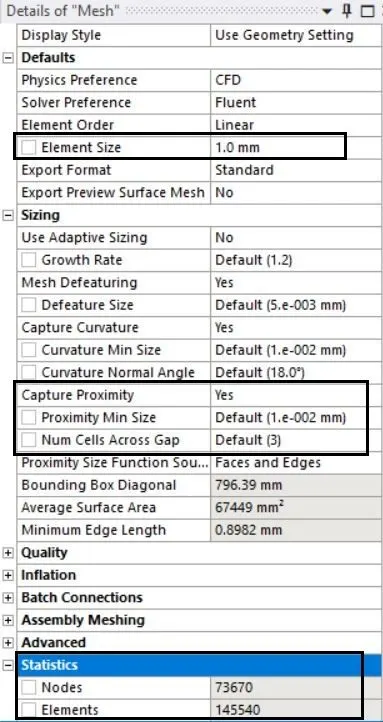
By inserting all triangle method using body selction tool into the mesh, name the respective location and generate the mesh with capture proximity.
Element size : 1mm
Cell count : 145540
SOLVING(SETUP) :
As we need to maintain temperature, energy source is activated.
k-epsilon model which characterises mixing time scale.
Steady state simulation.i.e., to get result at end.
Pressure based solver. As mach number is <0.3 for both cases(v=0.5m/s,80m/s) and flow is incompressible.
Diffusion is the combination of laminar and turbulent.Generally turbulent diffusion is greater than laminar diffusion.
So we use Fick's law(Dilute approximation).
If the flow is purely laminar,fick's law is invalid.so we need to include multicomponent diffusion properties.
Based on mixing properties, non-premixed combustion is used ( for e.g., IC engine).
So Eddy discipation model is used.
In eddy dissipation model, there is no ignition.source and combustion timing is calculated based on k-epsilon model.
Species:
Species transport with volumetric region.
Occuring on the inlet diffusion and presence of different energy source.
Mixture material is methane-air.
No. of volumetric species - 5 (CH4,Co2,H2O,N2,O2)
Boundary condition :
CASE 1
Air-inlet velocity = 0.5m/s, Thermal temperature=300K, Species mixture O2=0.23
Fuel-inlet velocity = 80m/s, Thermal temperature=300K, Species mixture CH4 =1
CASE 2 Adding 5% by mole of water into the fuel mixture
Air-inlet velocity = 0.5m/s, Thermal temperature=300K, Species mixture O2=0.23
Fuel-inlet velocity = 80m/s, Thermal temperature=300K, Species mixture CH4 =0.95,H2O=0.5
CASE 3 Adding 15% by mole of water into the fuel mixture
Air-inlet velocity = 0.5m/s, Thermal temperature=300K, Species mixture O2=0.23
Fuel-inlet velocity = 80m/s, Thermal temperature=300K, Species mixture CH4 =0.85,H2O=0.15
CASE 4 Adding 25% by mole of water into the fuel mixture
Air-inlet velocity = 0.5m/s, Thermal temperature=300K, Species mixture O2=0.23
Fuel-inlet velocity = 80m/s, Thermal temperature=300K, Species mixture CH4 =0.75,H20=0.25
CASE 5 Adding 30% by mole of water into the fuel mixture
Air-inlet velocity = 0.5m/s, Thermal temperature=300K, Species mixture O2=0.23
Fuel-inlet velocity = 80m/s, Thermal temperature=300K, Species mixture CH4 =0.7,H2O=0.3
Hybrid initialisation is done
Number of iteration = 600
POST PROCESSING(RESULTS) :
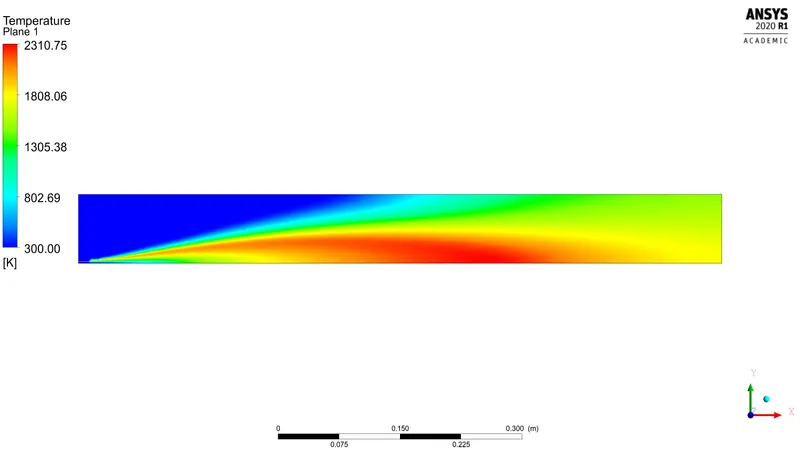
CASE 1:
TEMPERATURE CONTOUR:
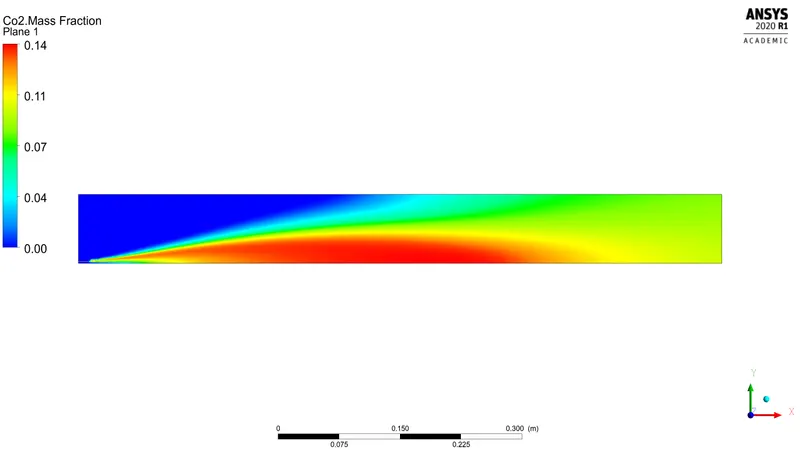
CO2
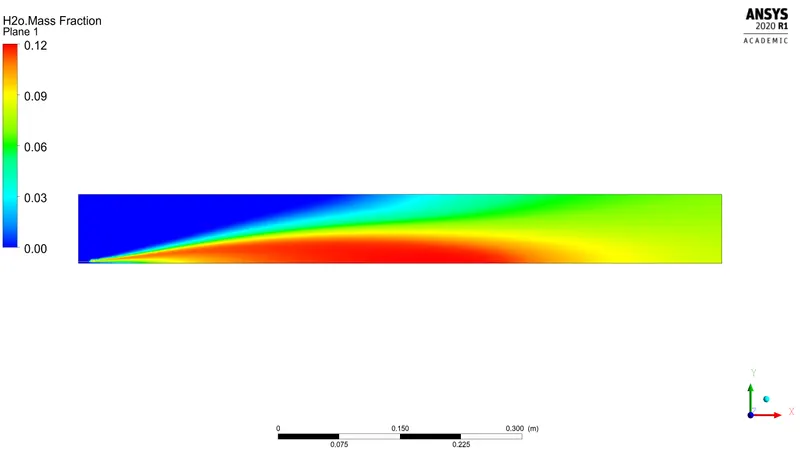
H2O
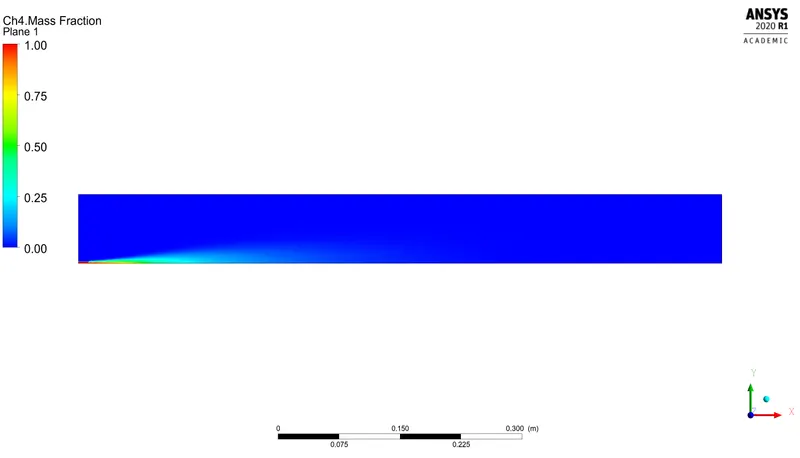
CH4
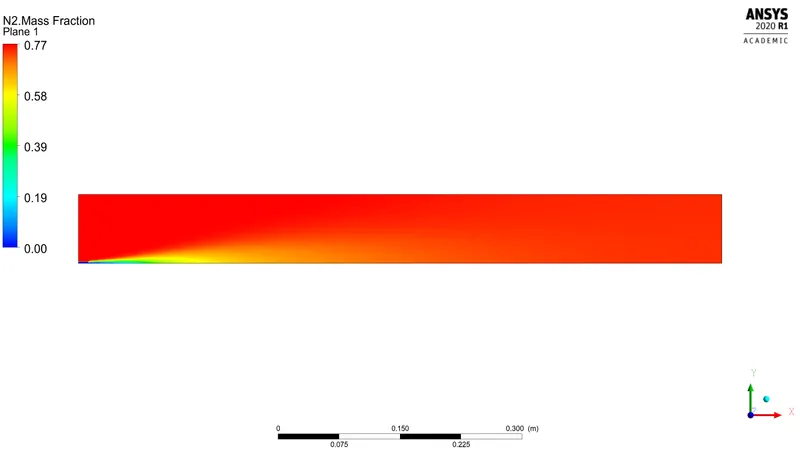
N2
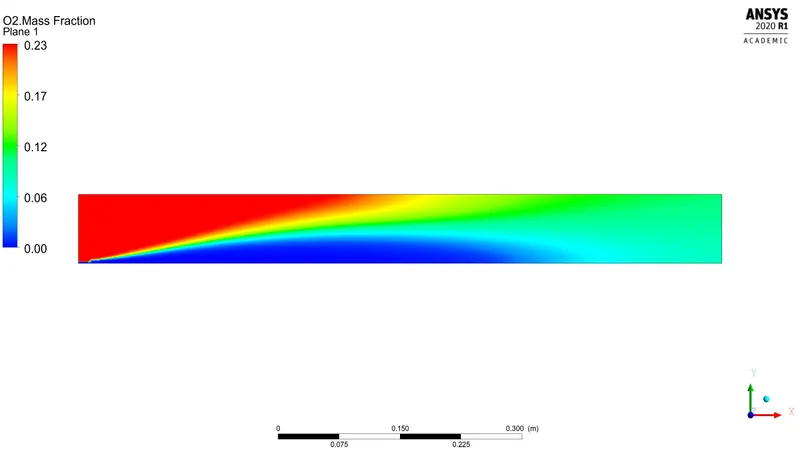
O2
NOx Emission :
Soot formation
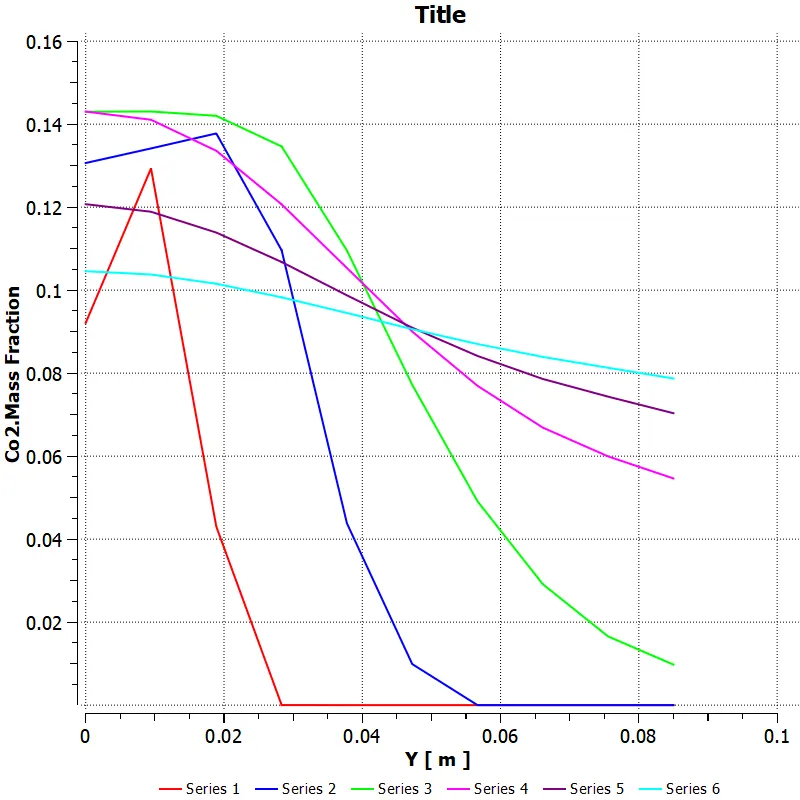
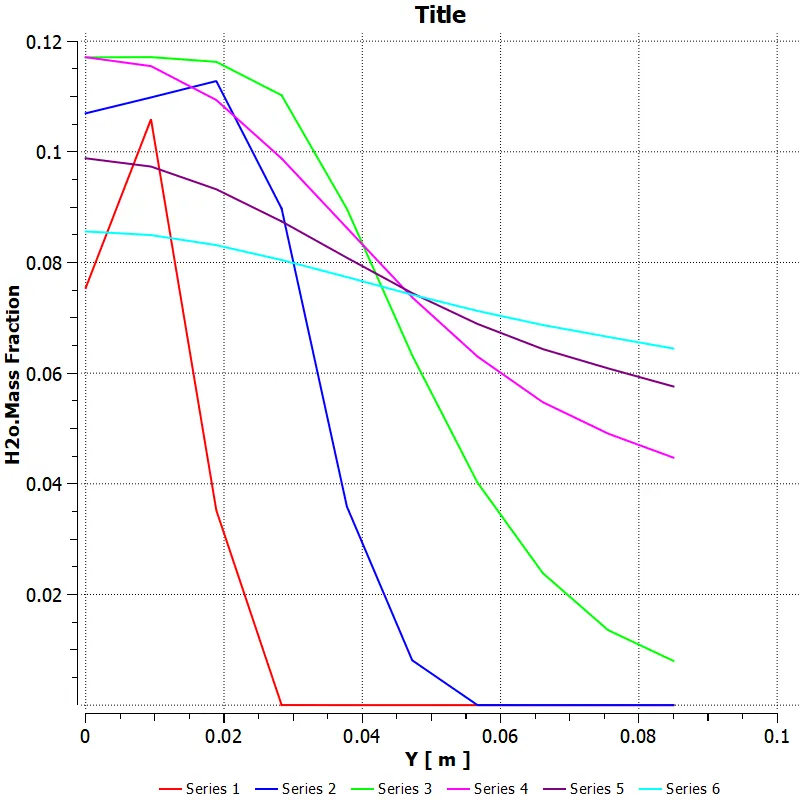
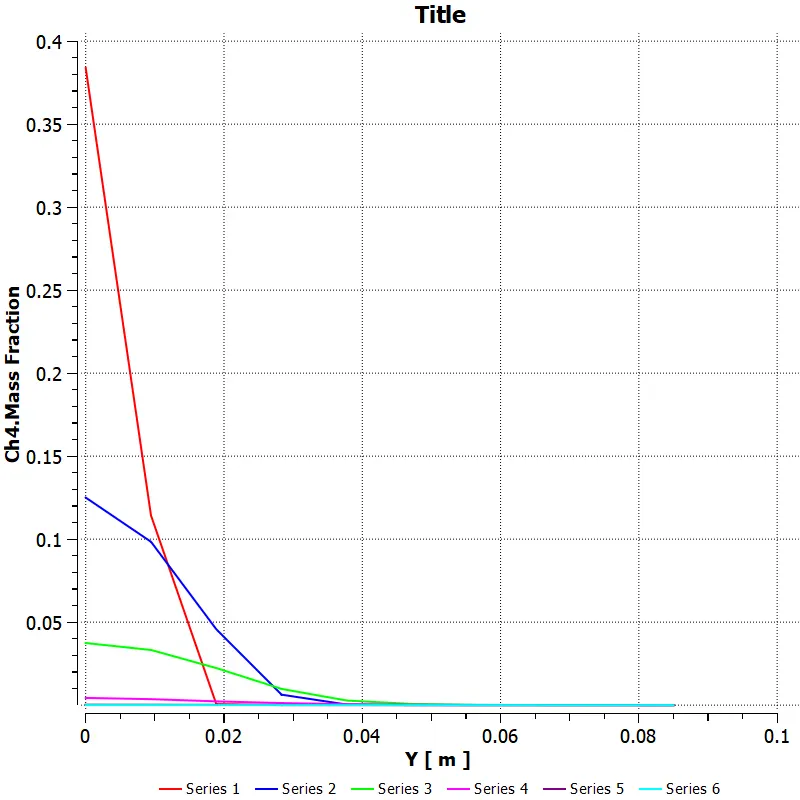
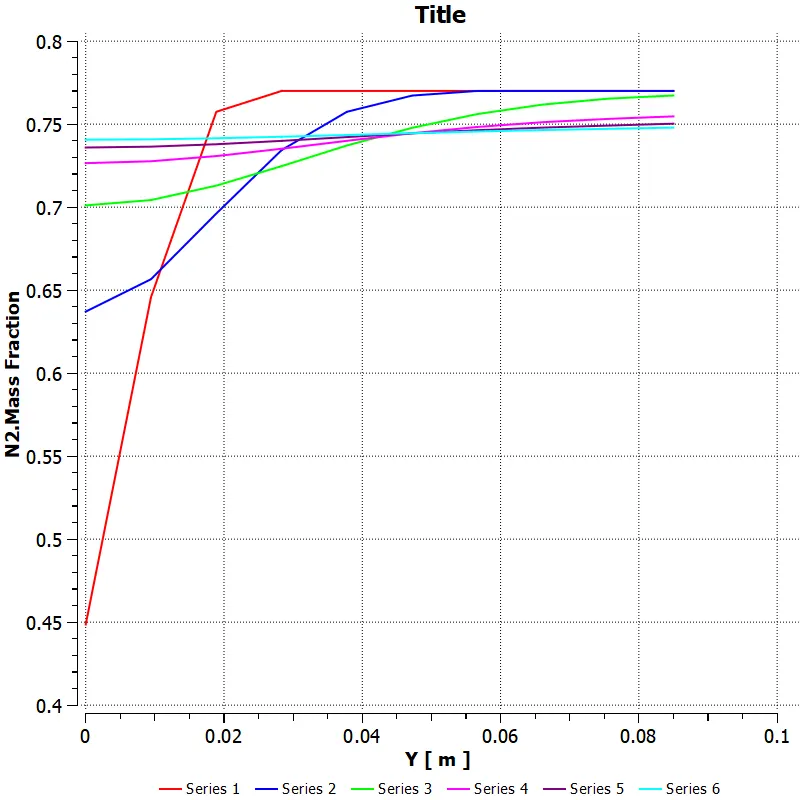
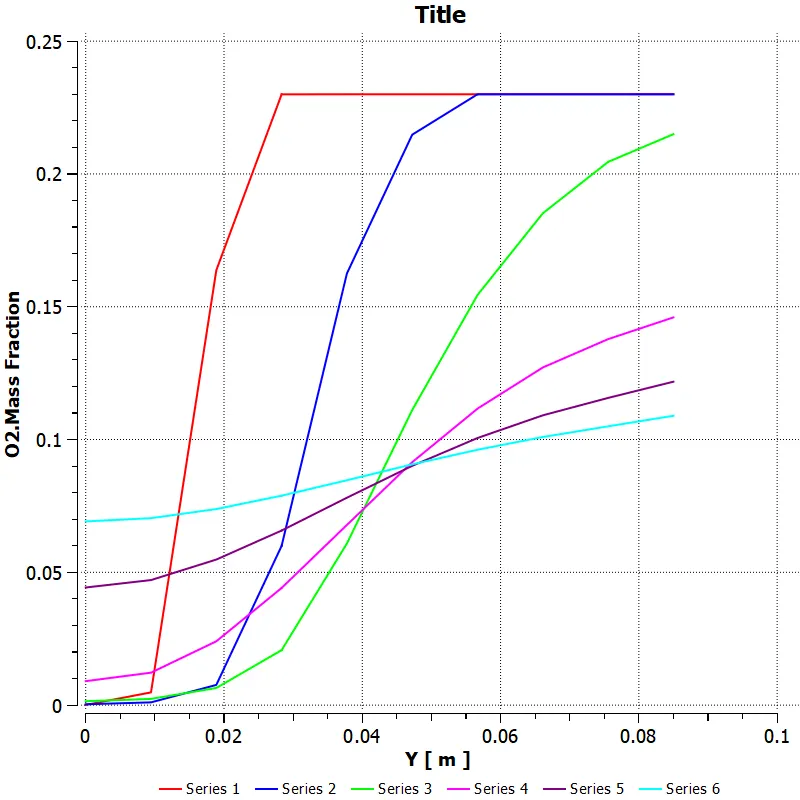
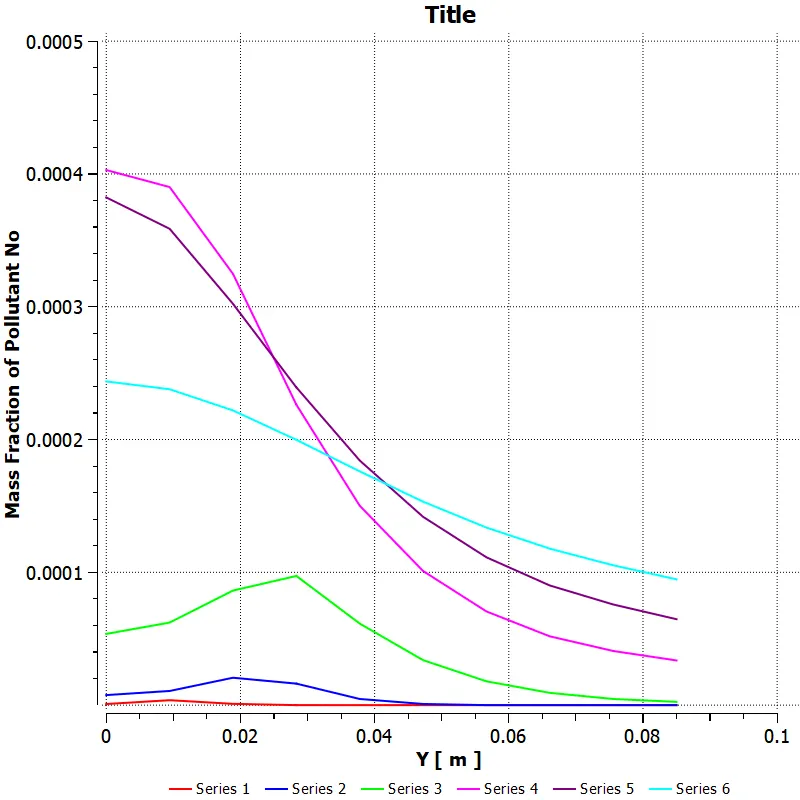
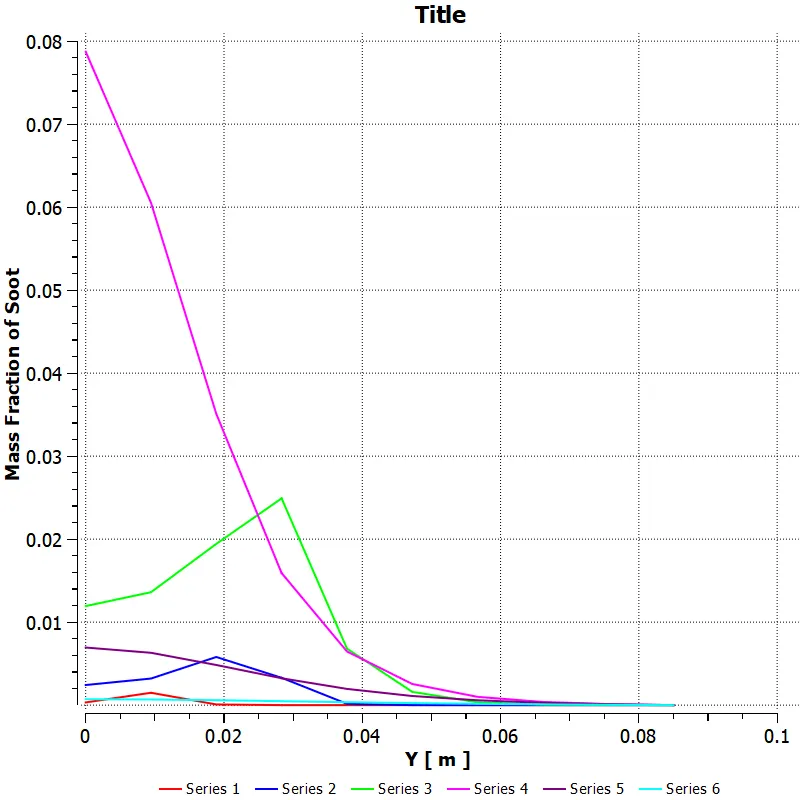
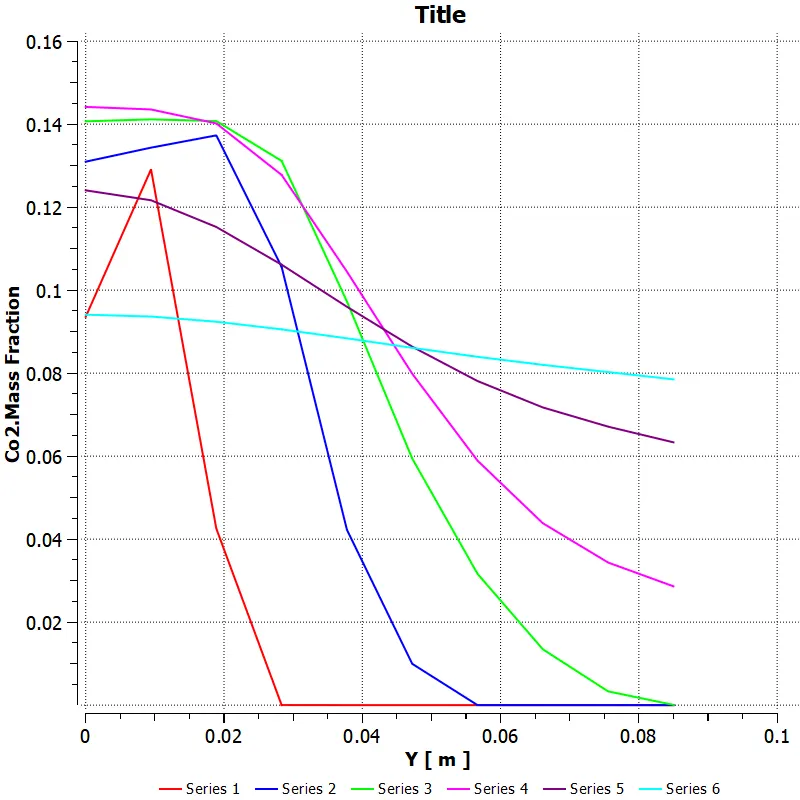
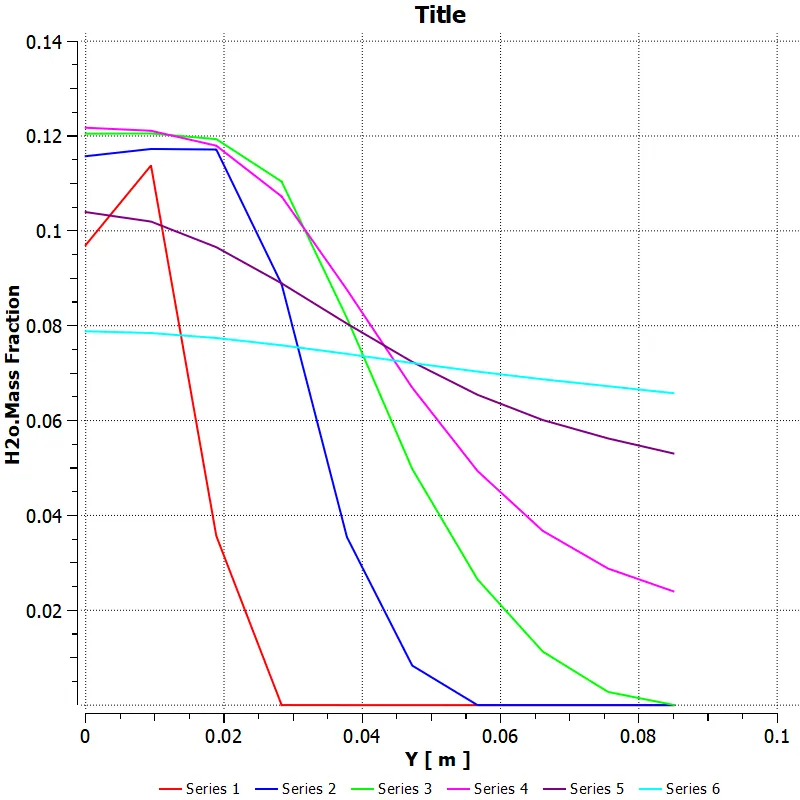
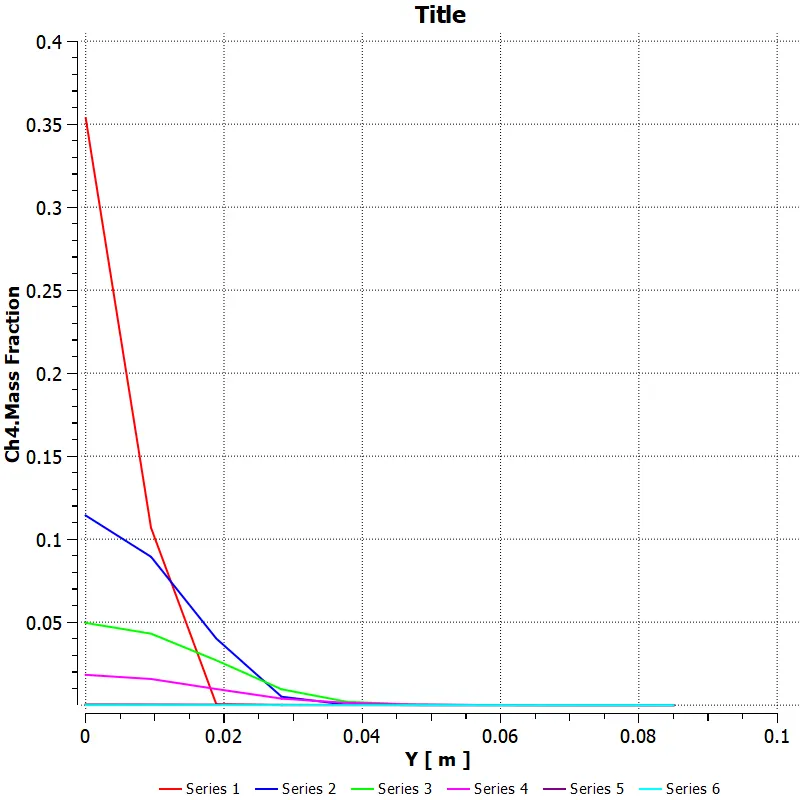
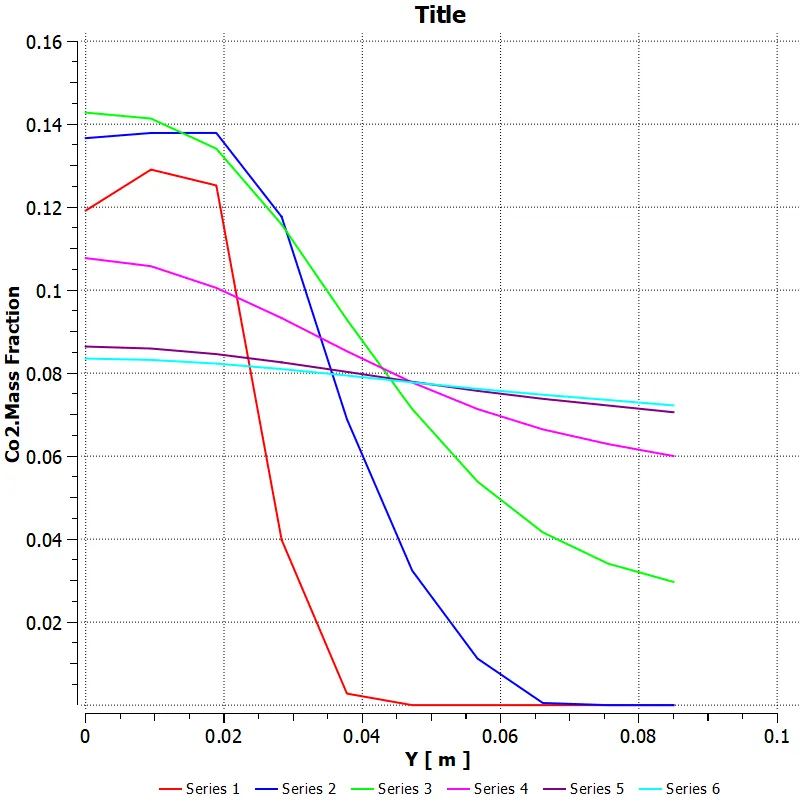
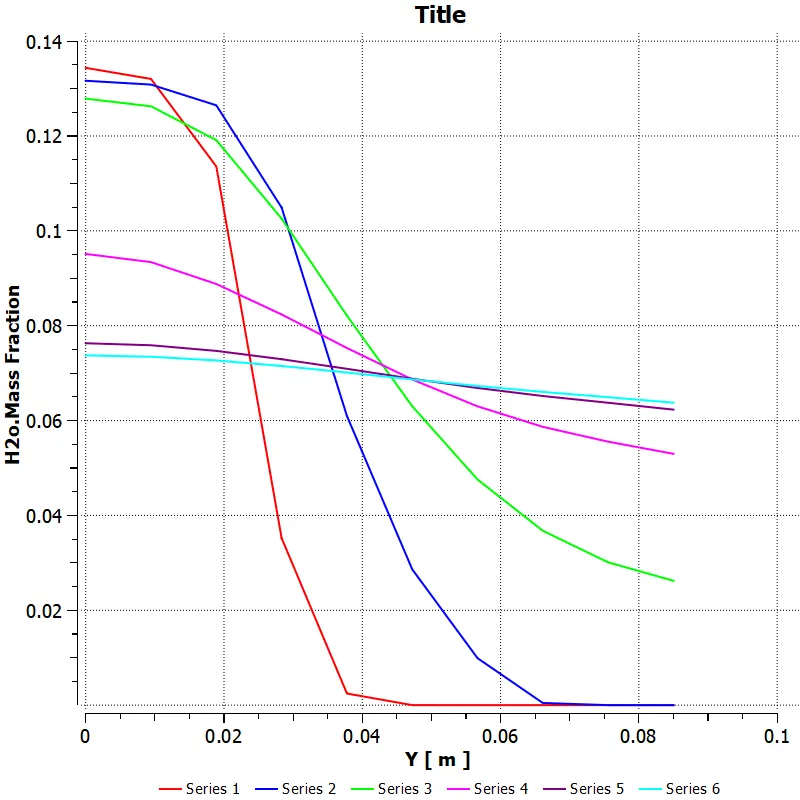
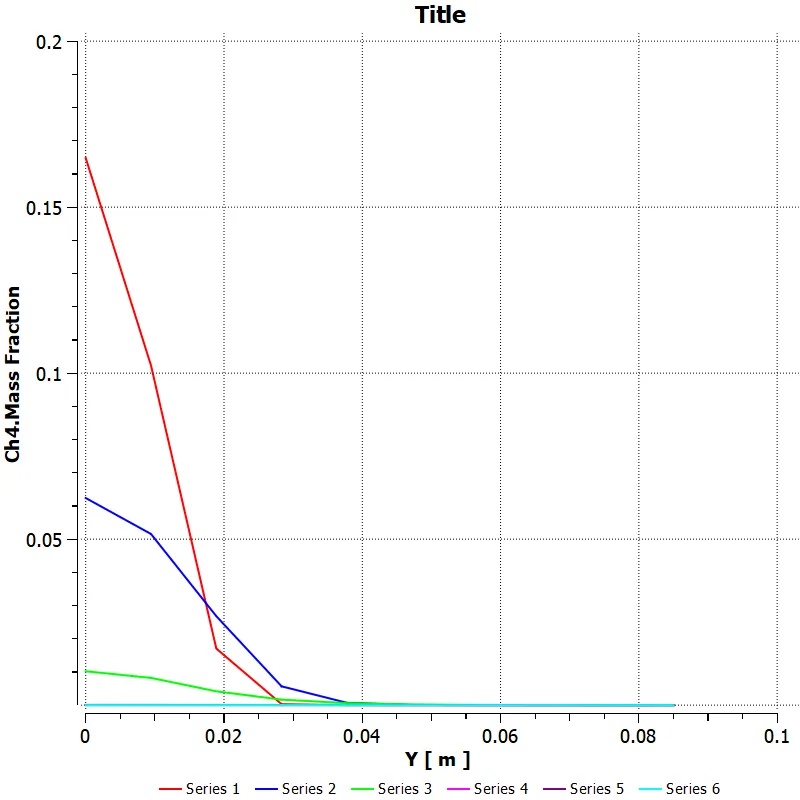
Plot the variation of the mass fraction of the different species’ in the simulation using line probes at different locations of the combustor
TEMPERATURE CHART :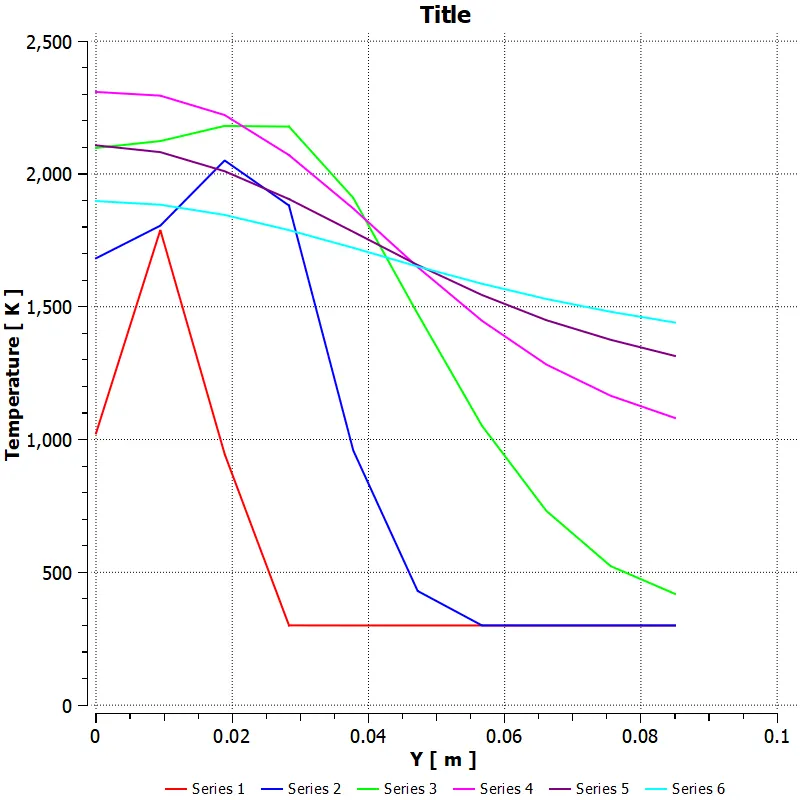
CO2 CHART
H2O CHART
CH4 CHART
N2 CHART
O2 CHART
NOx CHART :
Soot formation CHART
CASE 2:
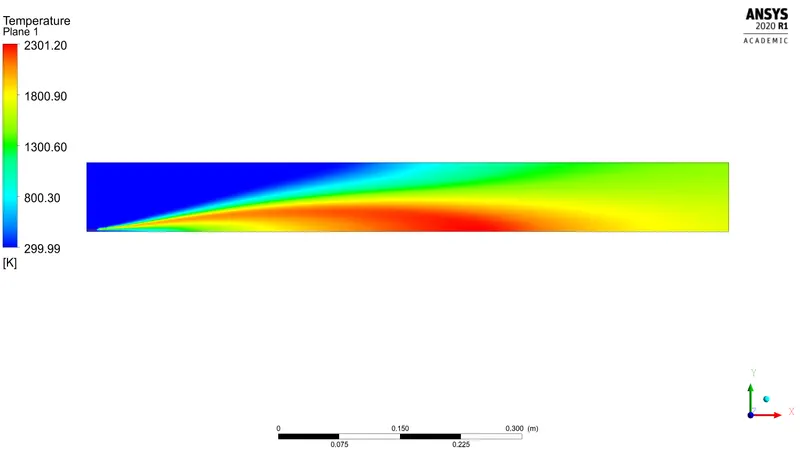
TEMPERATURE CONTOUR :
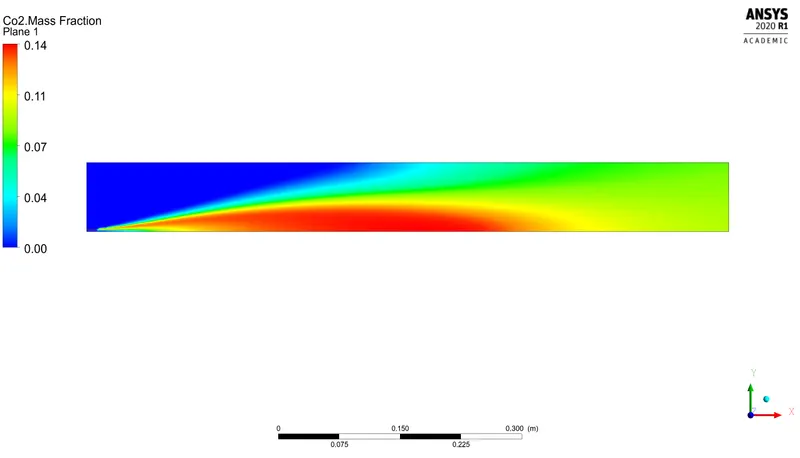
CO2
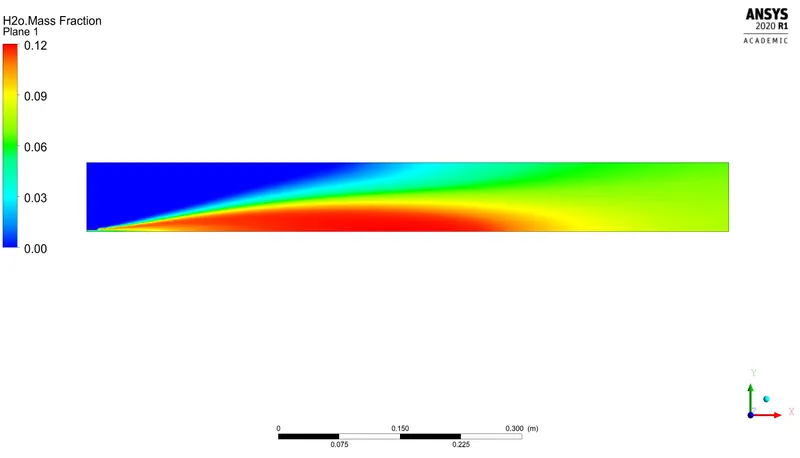
H2O
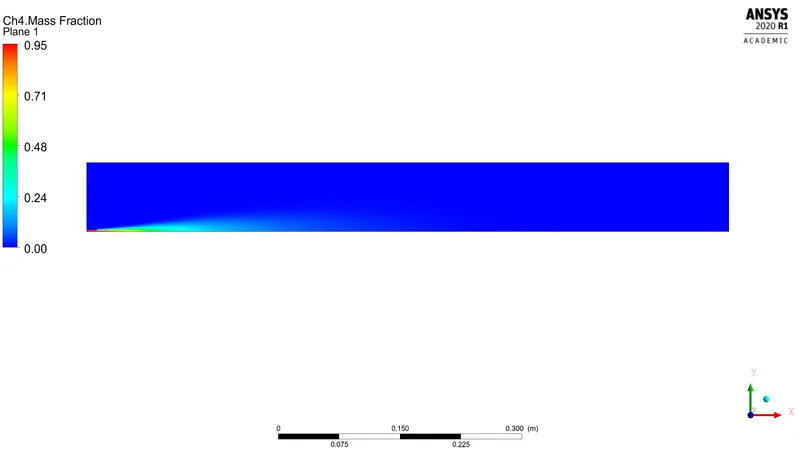
CH4
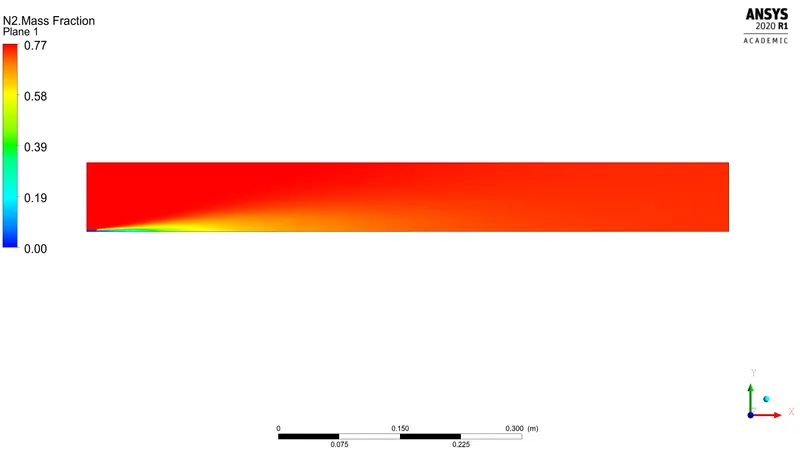
N2
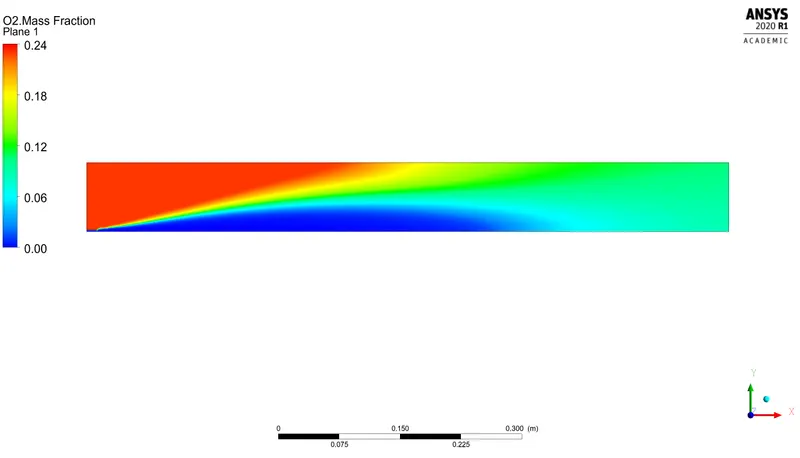
O2
NOx Emission
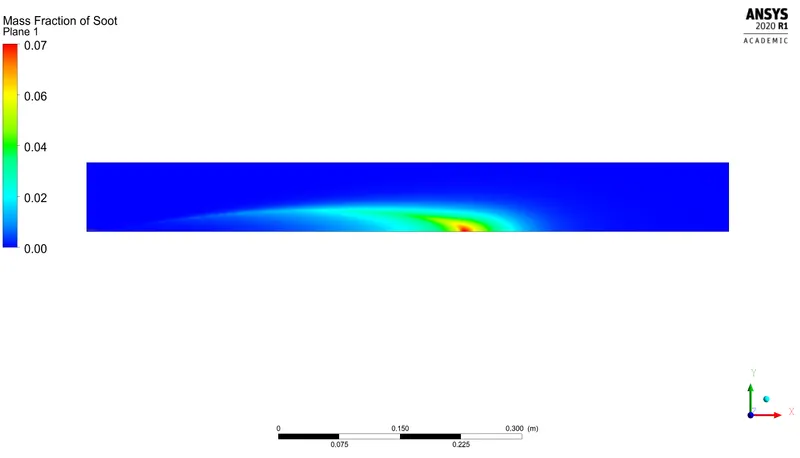
Soot formation
Plot the variation of the mass fraction of the different species’ in the simulation using line probes at different locations of the combustor
CO2 CHART
H2O CHART
CH4 CHART
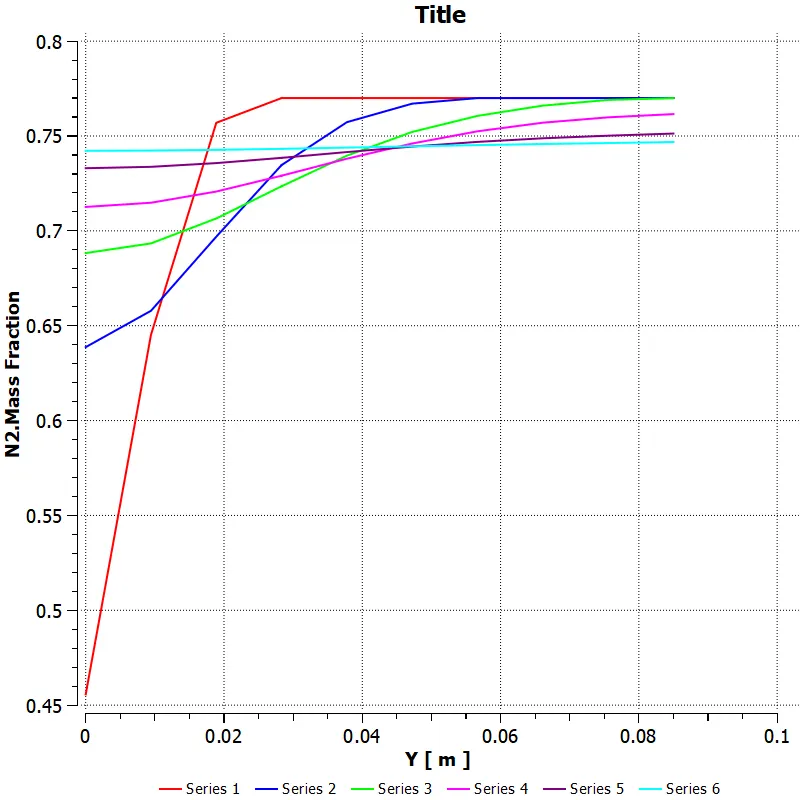
N2 CHART
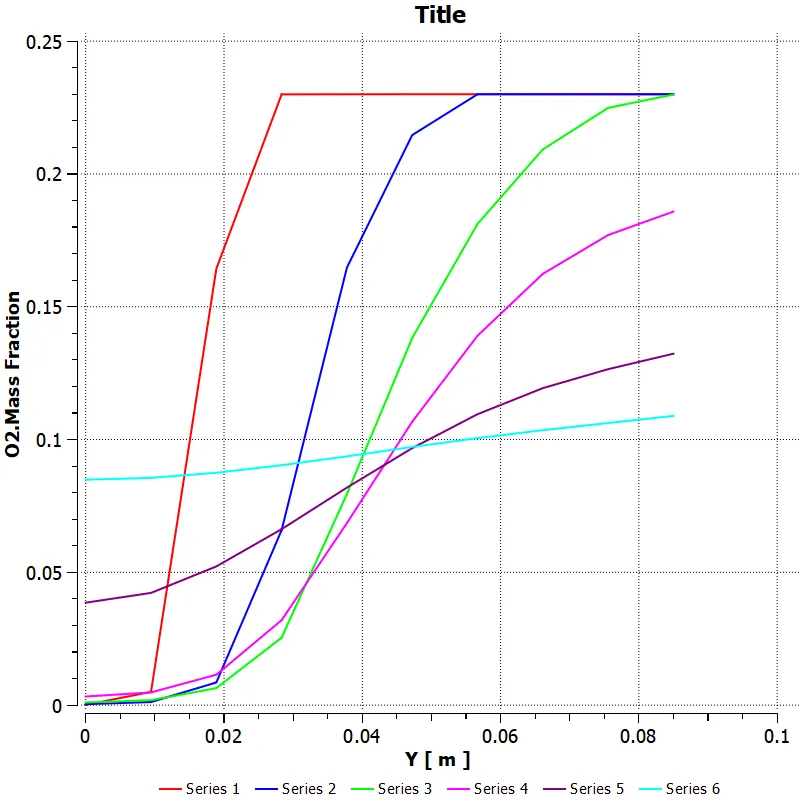
O2 CHART
NOx CHART
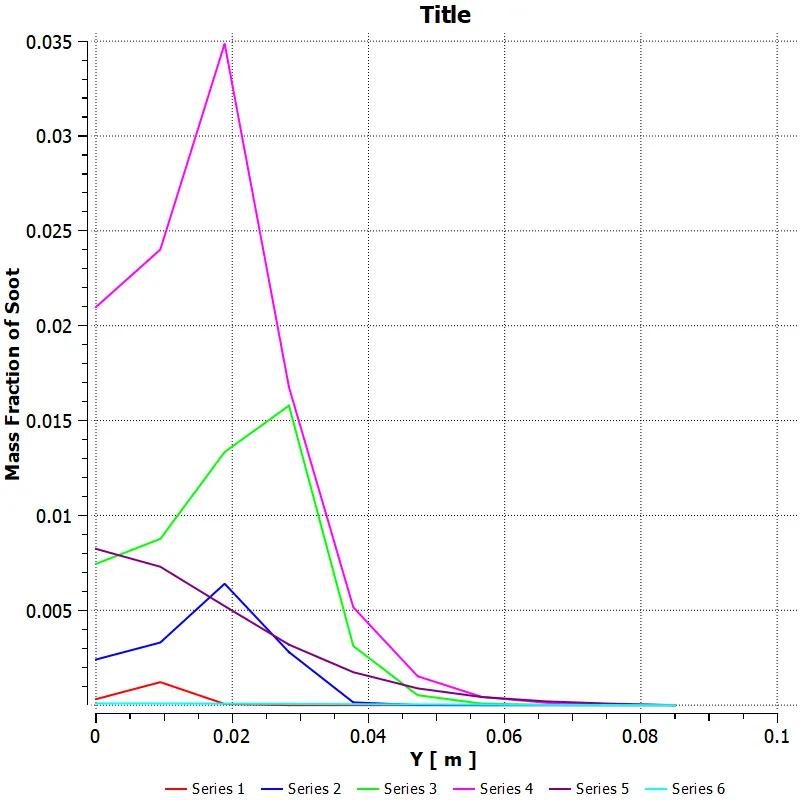
Soot formation CHART
CASE 3:
TEMPERATURE CHART :
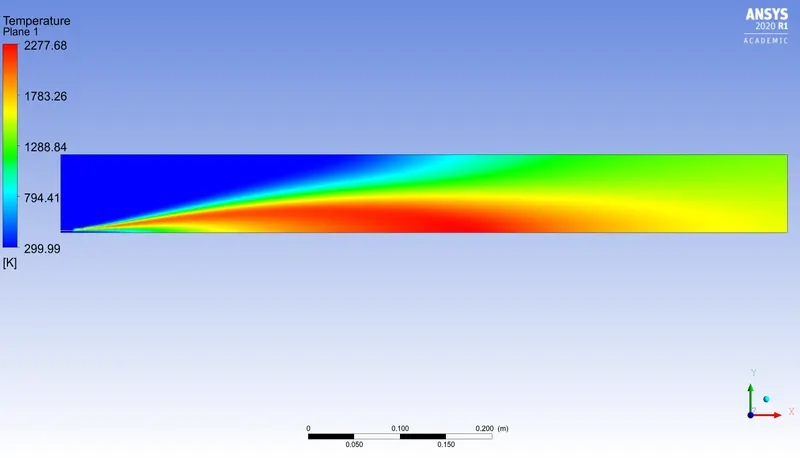
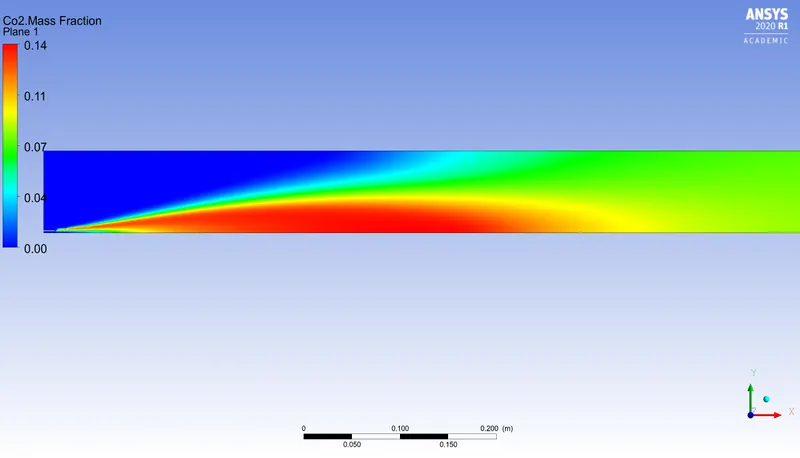
CO2
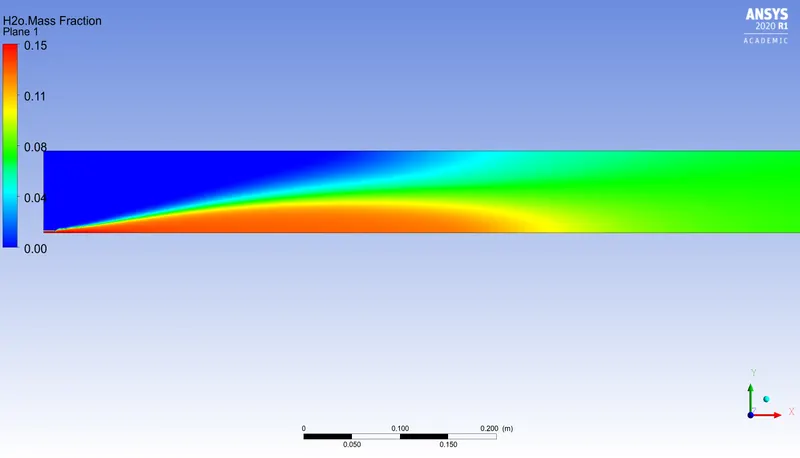
H2O
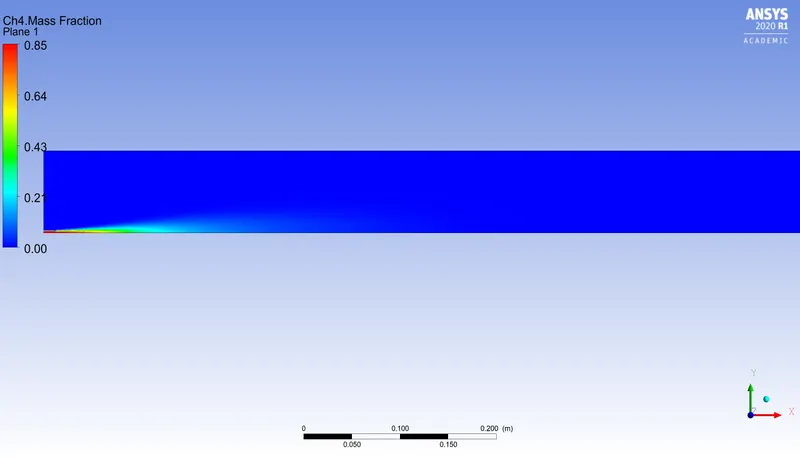
CH4
N2
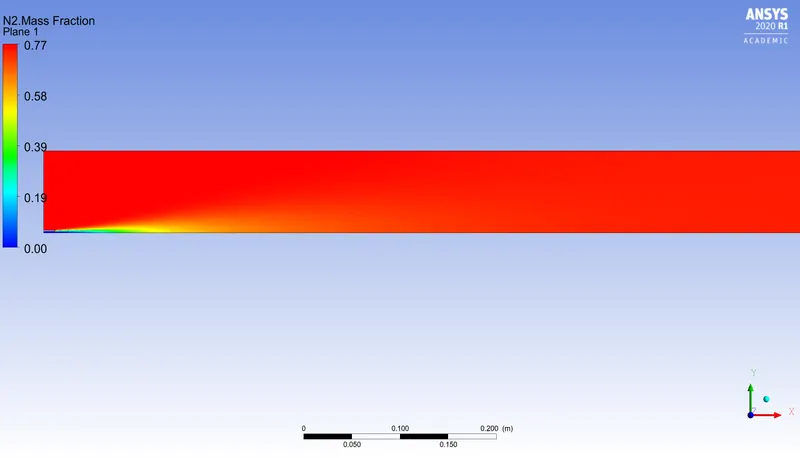
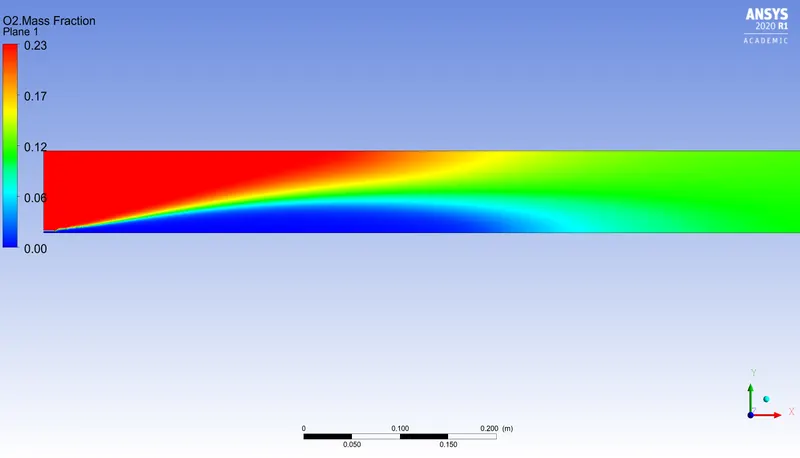
O2
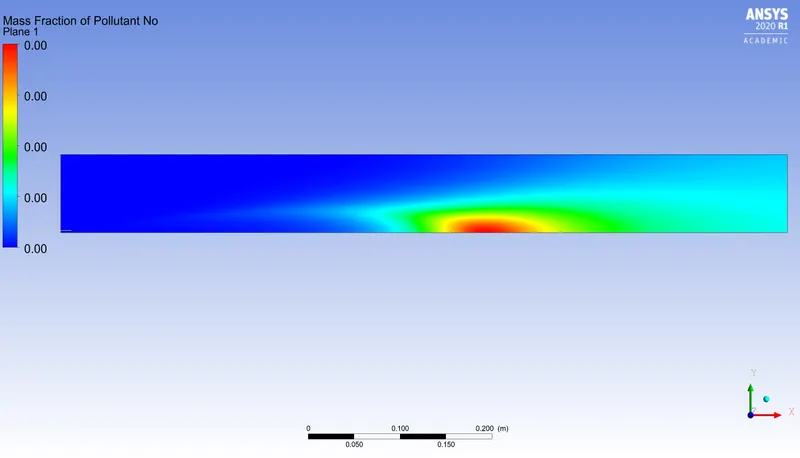
NOx Emission
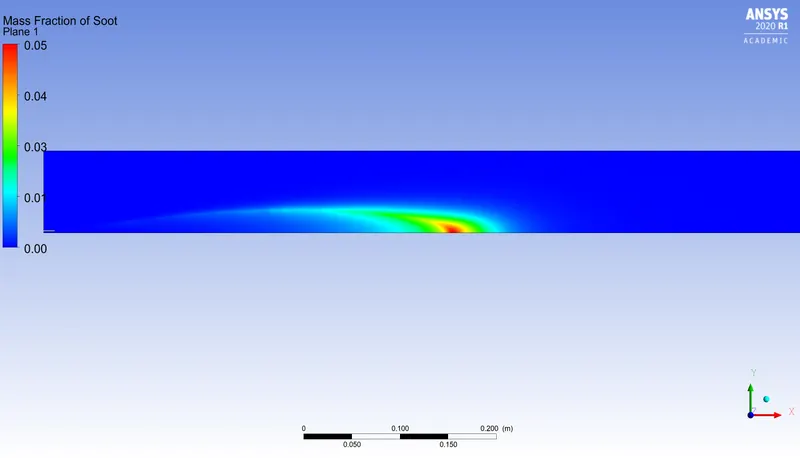
Soot formation
Plot the variation of the mass fraction of the different species’ in the simulation using line probes at different locations of the combustor
CO2 CHART
H2O CHART
CH4 CHART
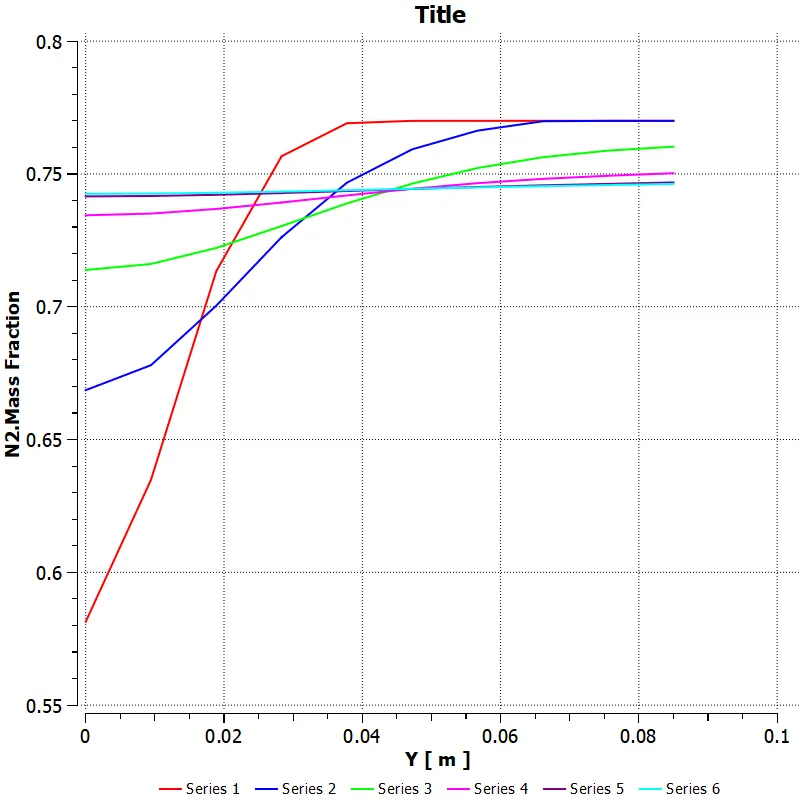
N2 CHART
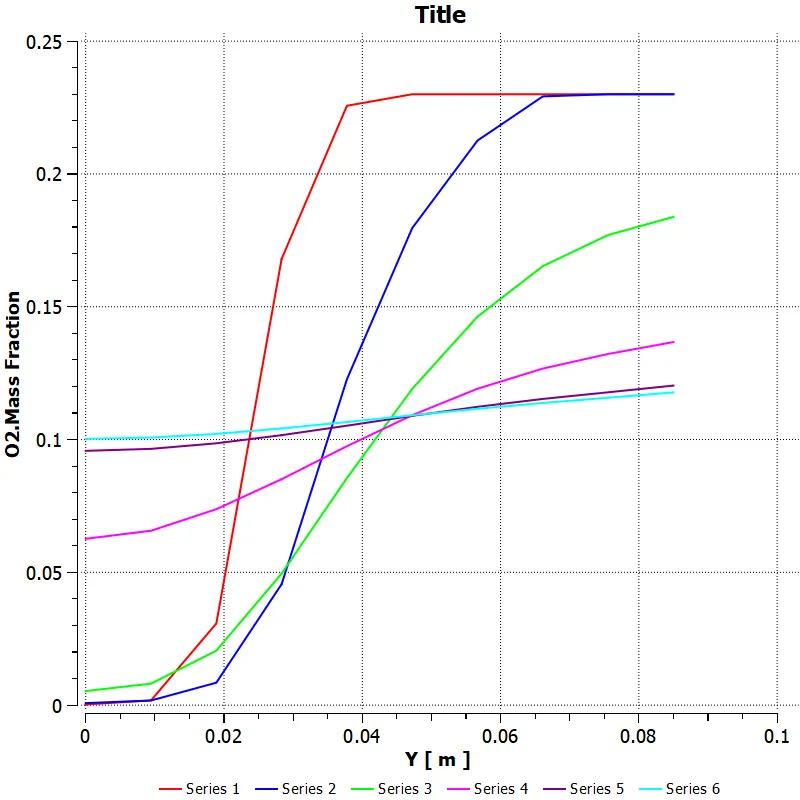
O2 CHART
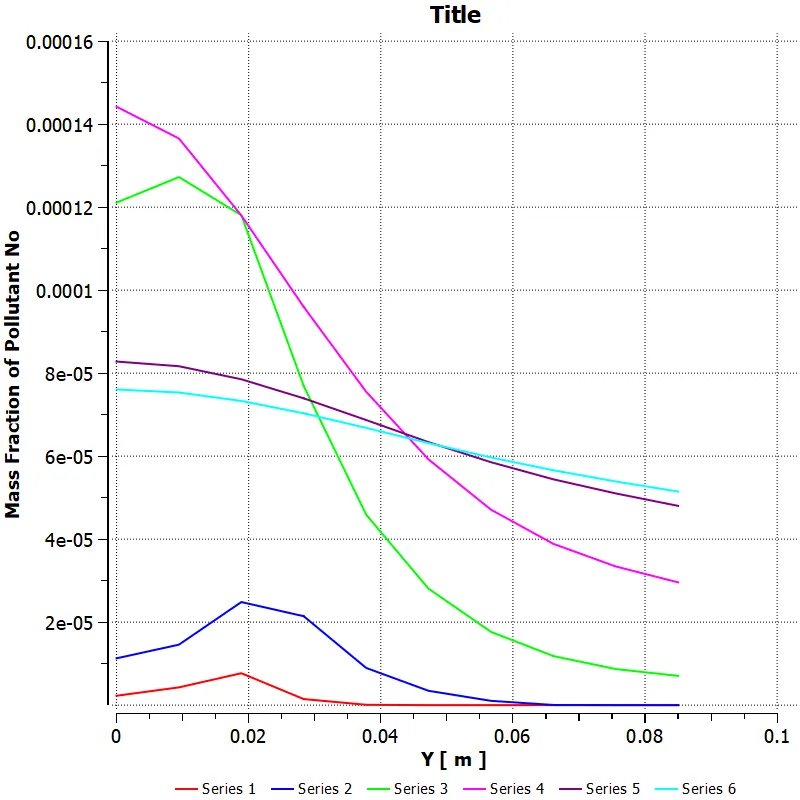
NOx Emission CHART
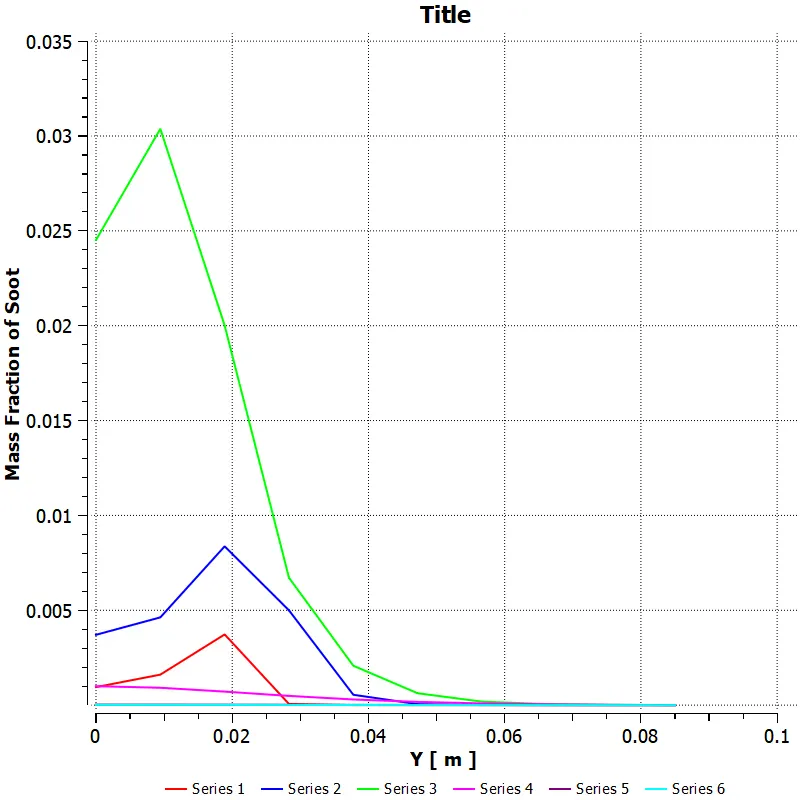
Soot formation CHART
CASE 4:
TEMPERATURE CONTOUR :
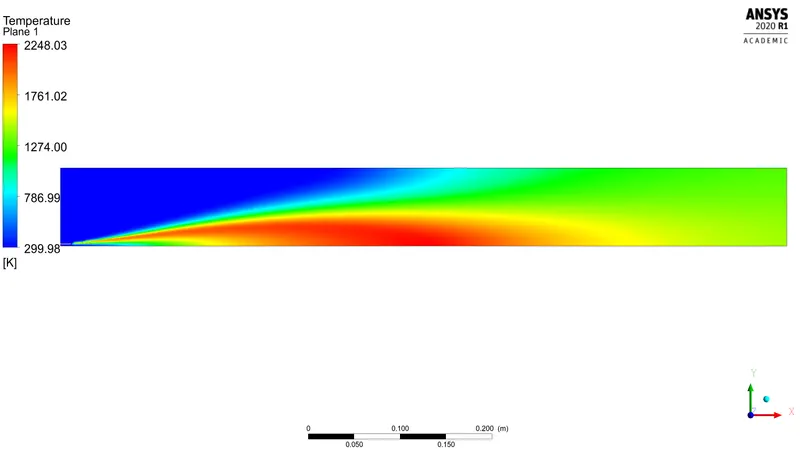
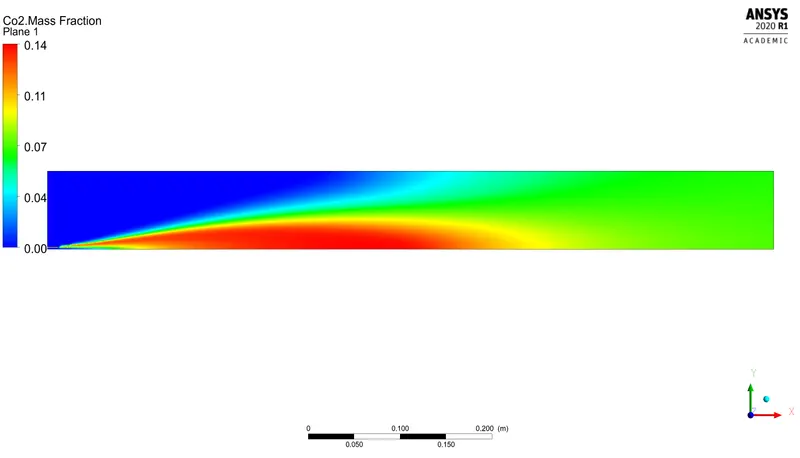
CO2
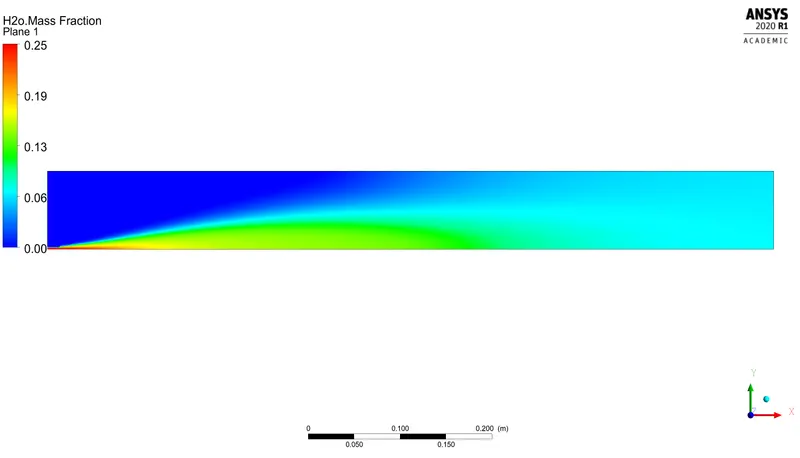
H2O
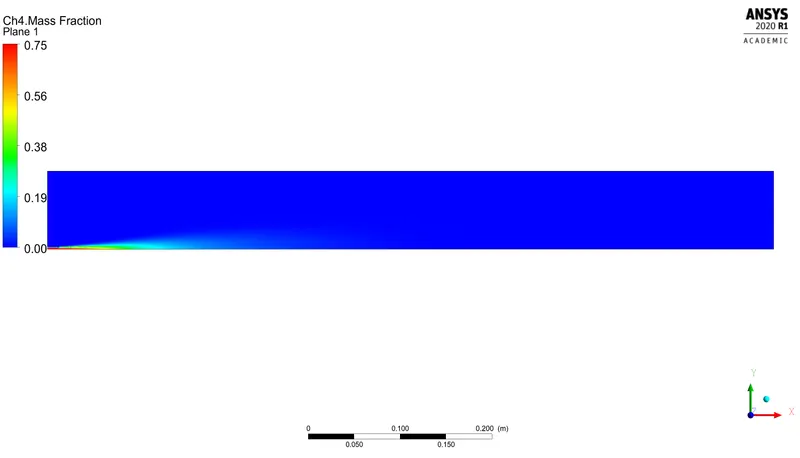
CH4
N2
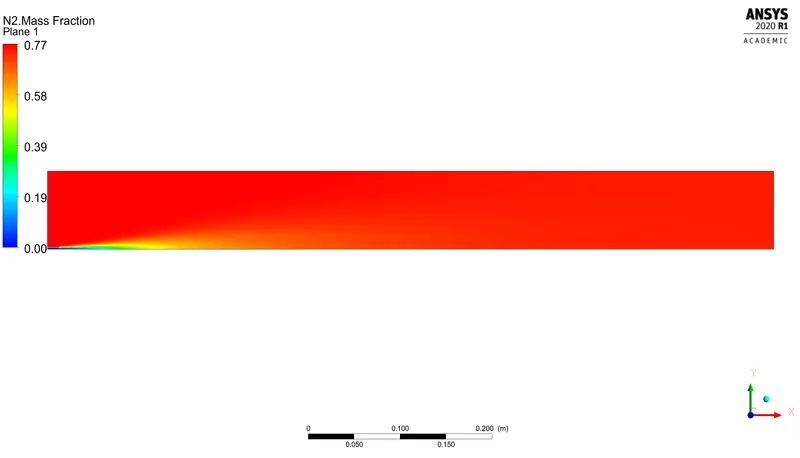
O2
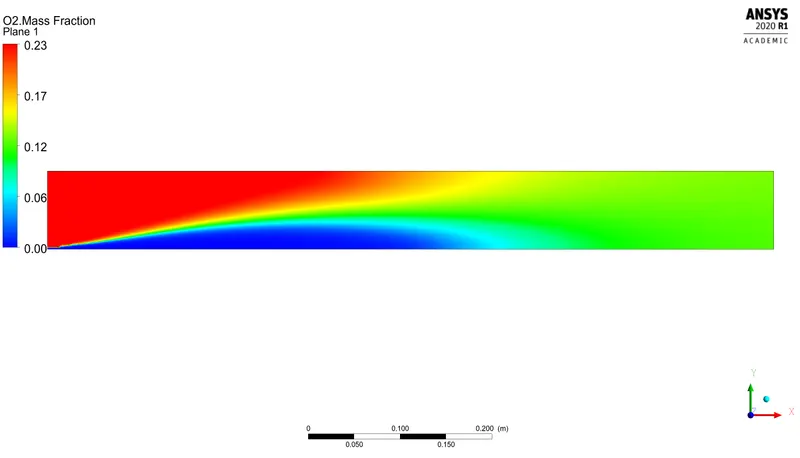
NOx Emission
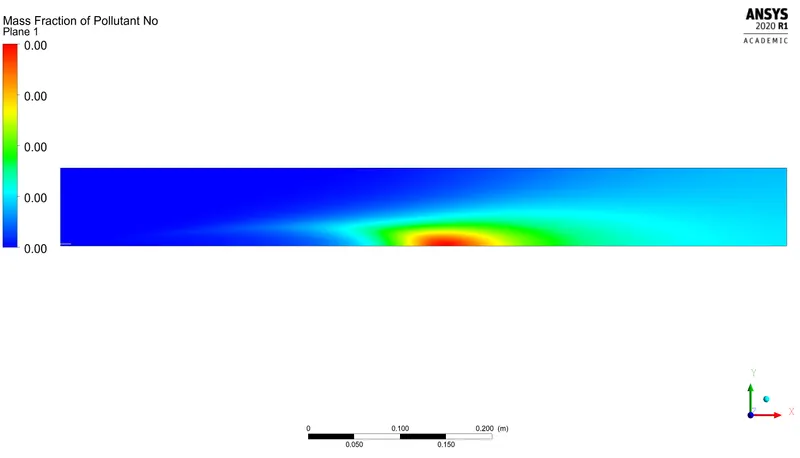
Soot formation
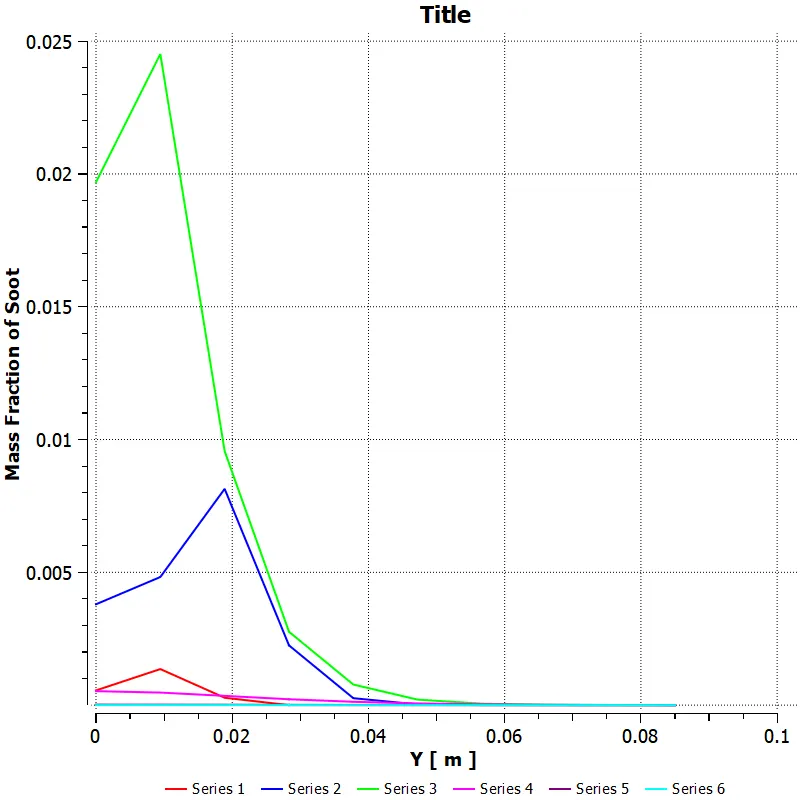
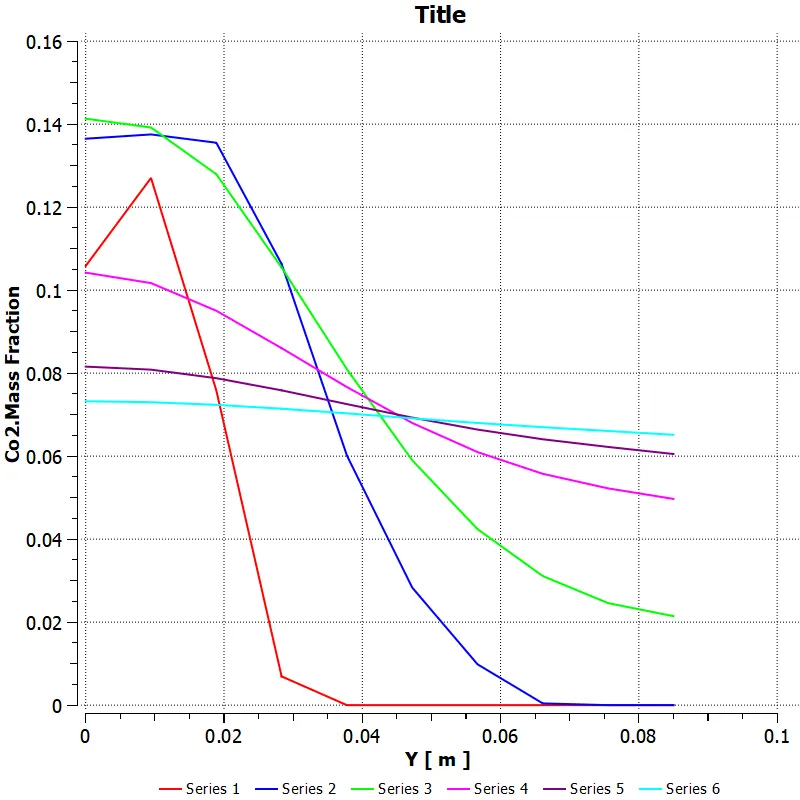
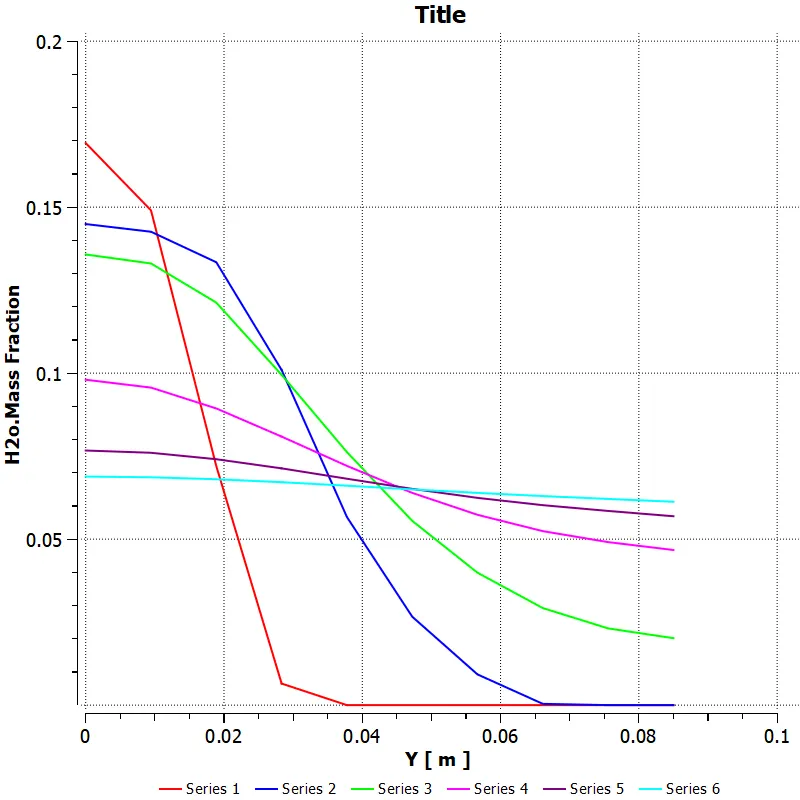
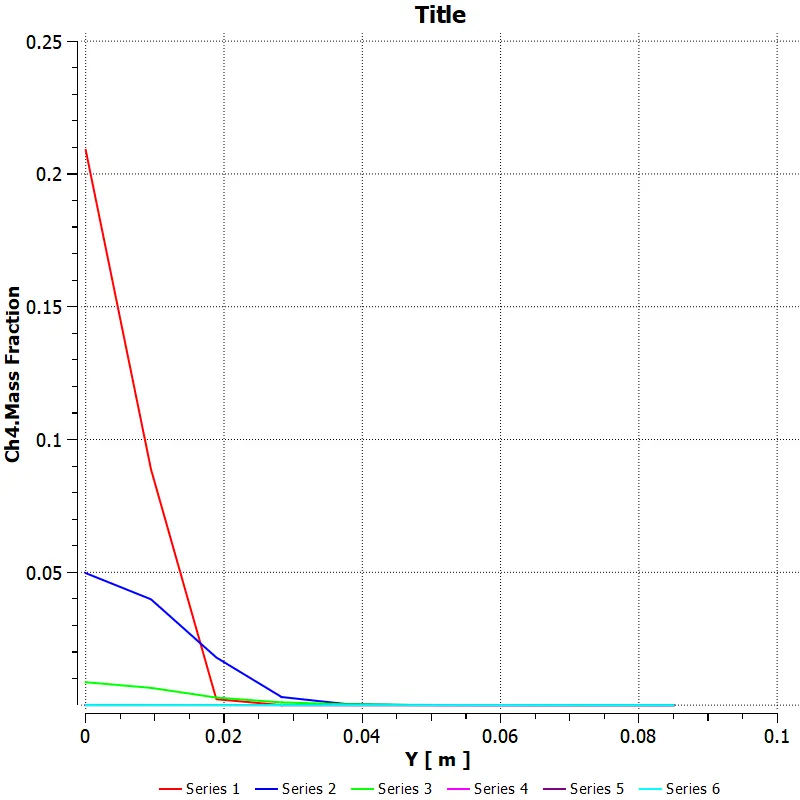
Plot the variation of the mass fraction of the different species’ in the simulation using line probes at different locations of the combustor
CO2 CHART
H2O CHART
CH4 CHART
N2 CHART
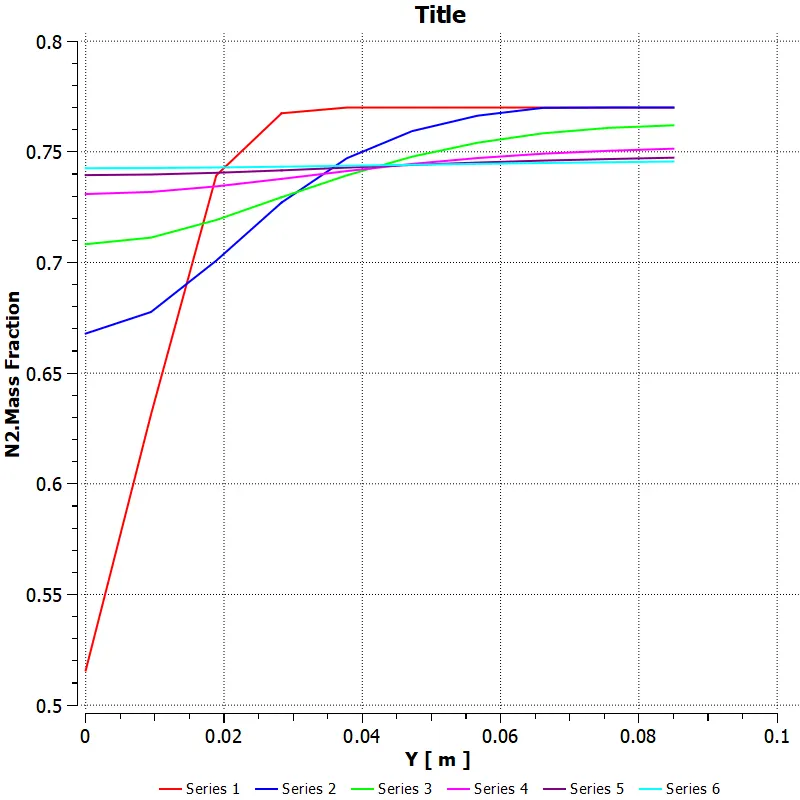
O2 CHART
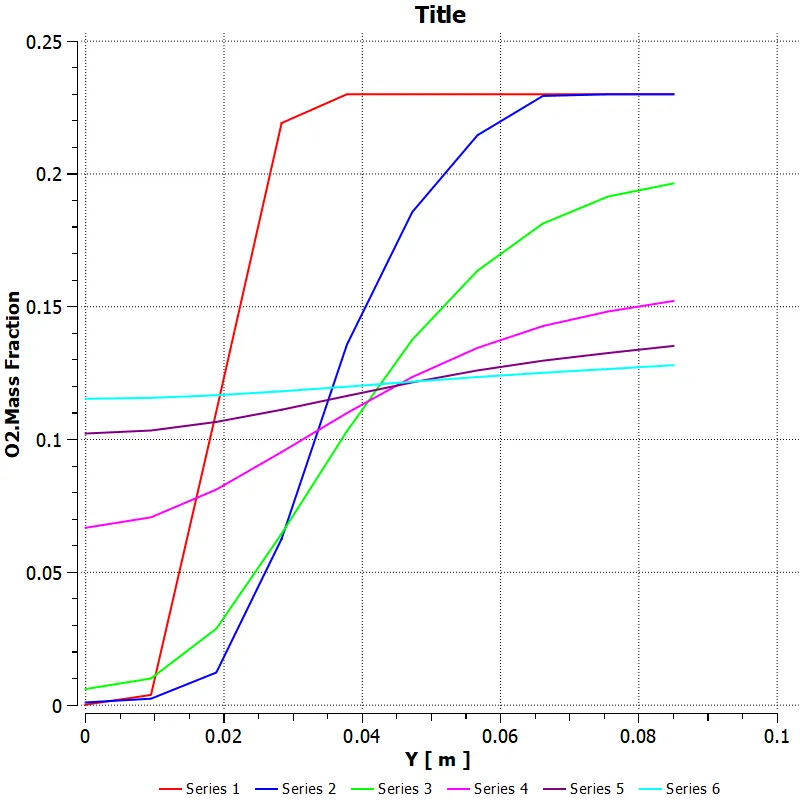
NOx Emission CHART
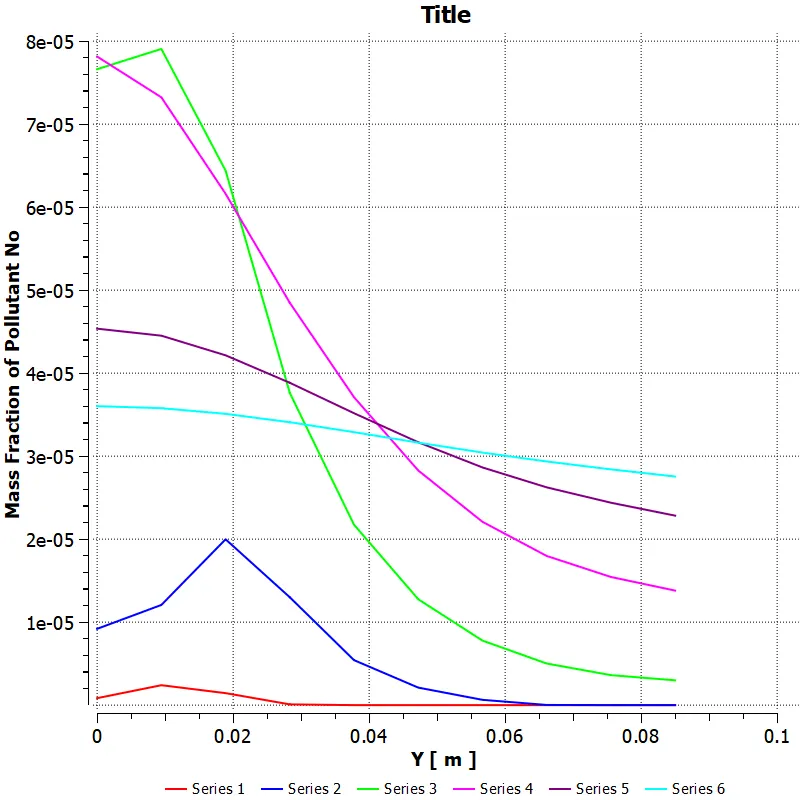
Soot formation CHART
CASE 5:
TEMPERATURE CONTOUR:
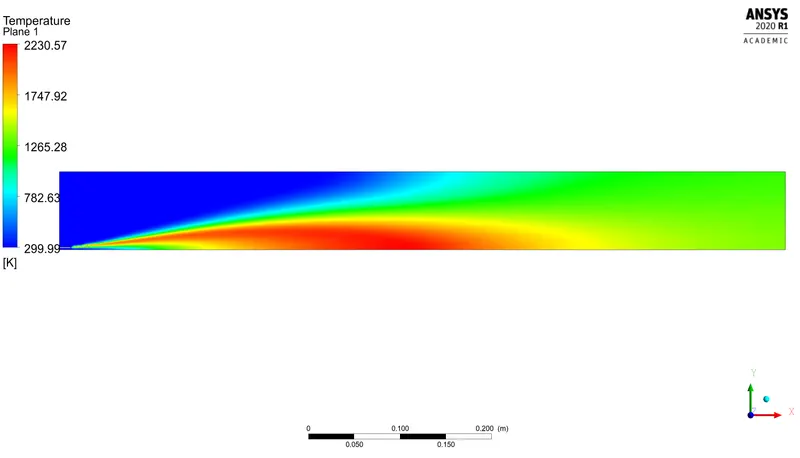
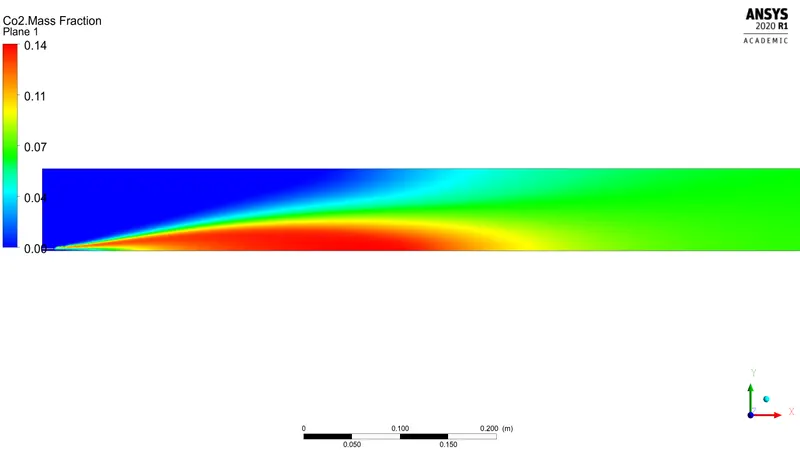
CO2
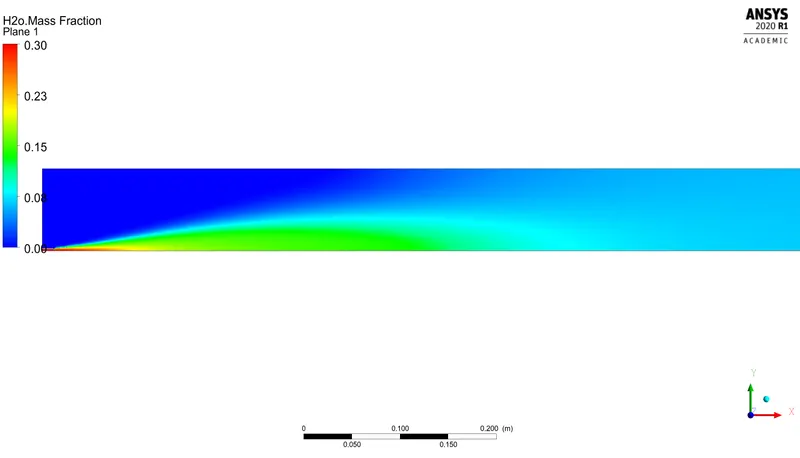
H2O
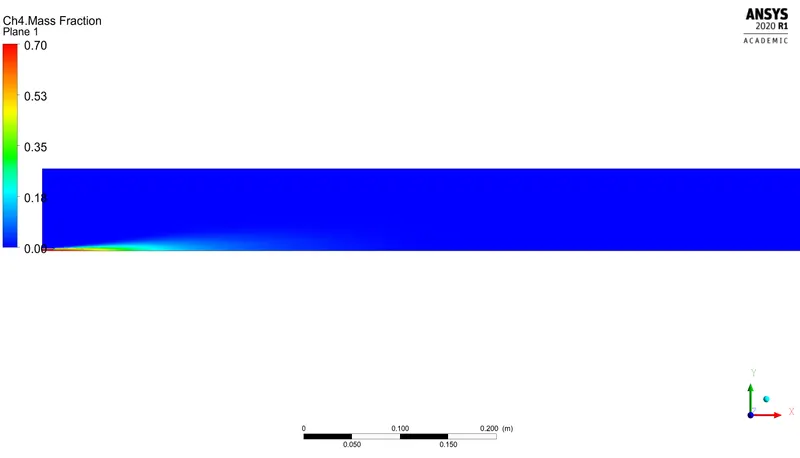
CH4
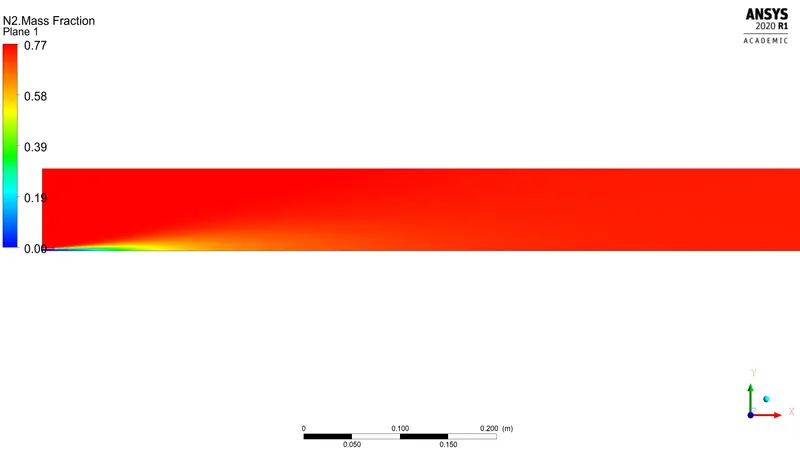
N2
O2
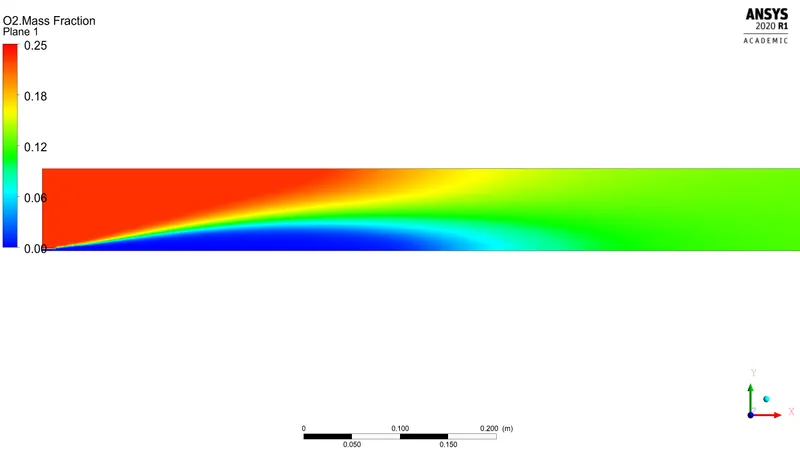
NOx Emission
Soot formation
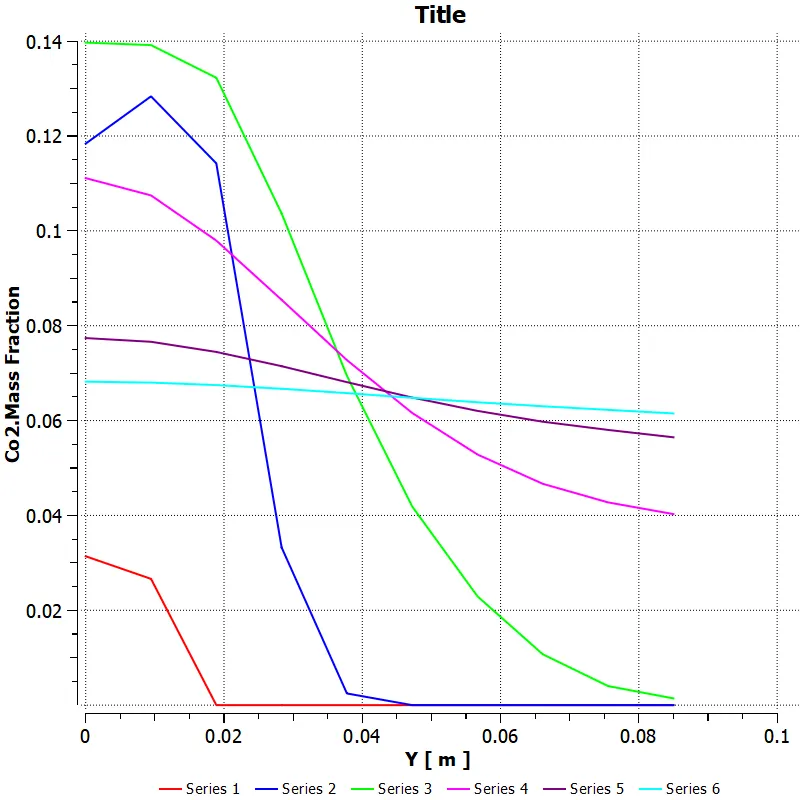
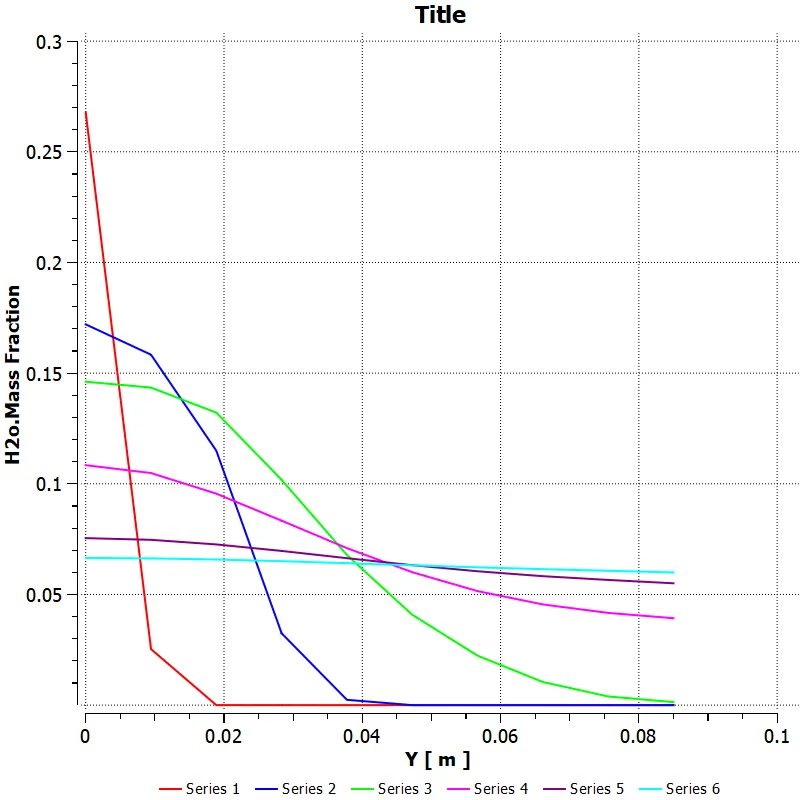
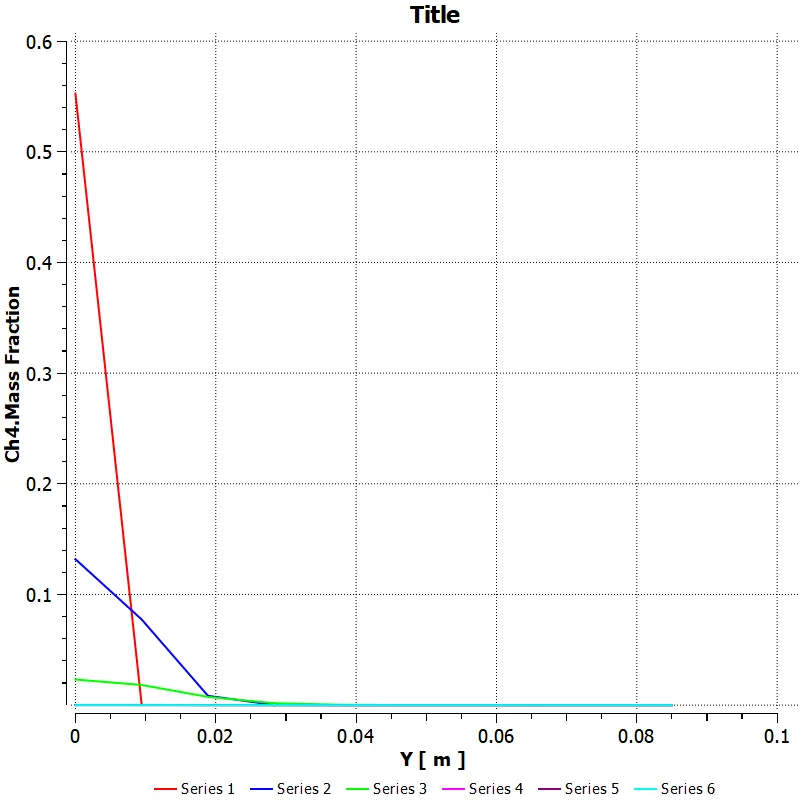
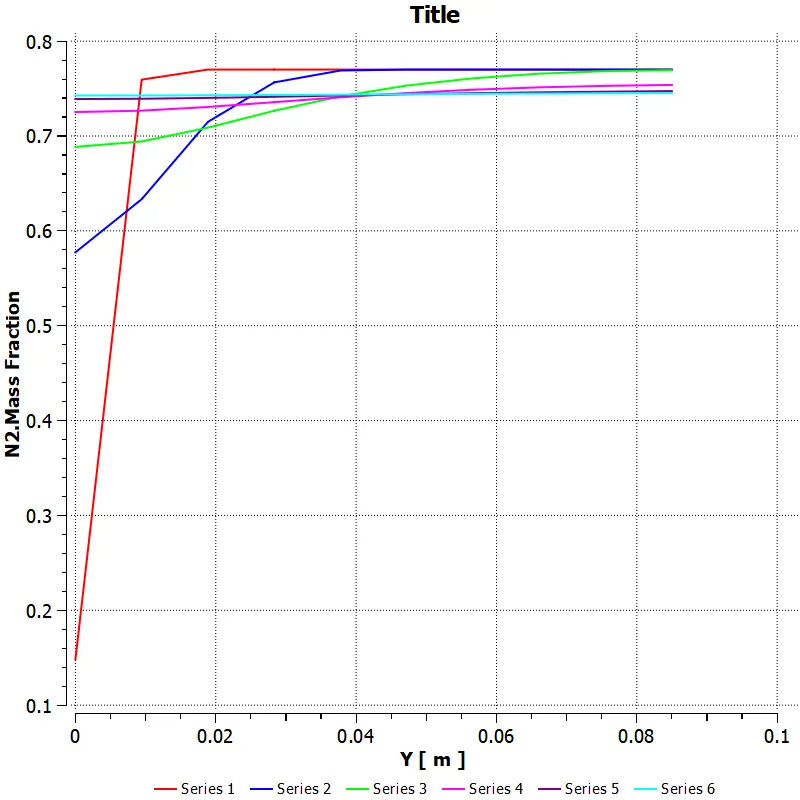
Plot the variation of the mass fraction of the different species’ in the simulation using line probes at different locations of the combustor
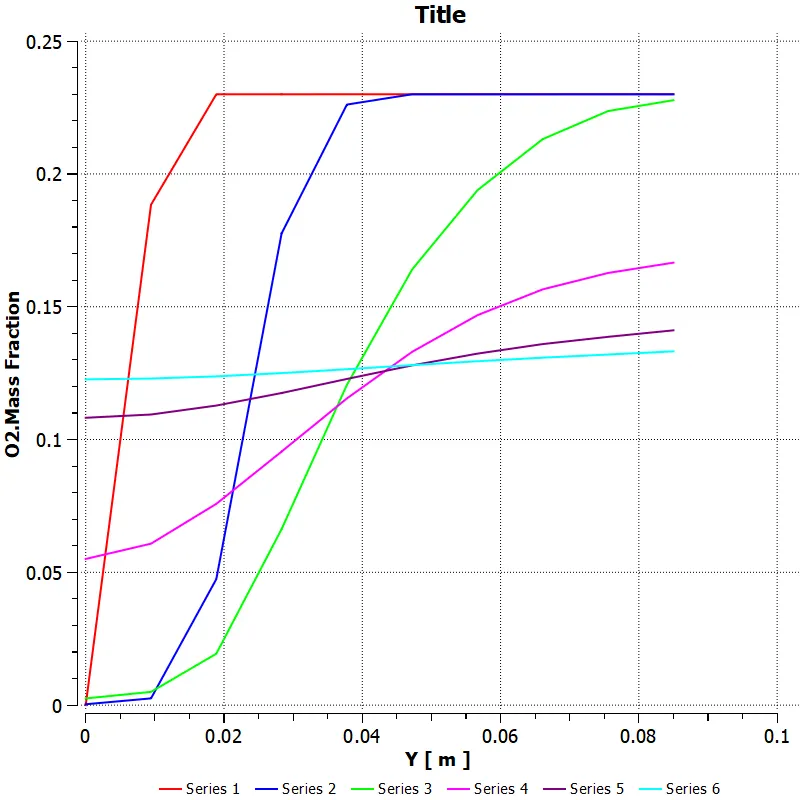
CO2 CHART
H2O CHART
CH4 CHART
N2 CHART
O2 CHART
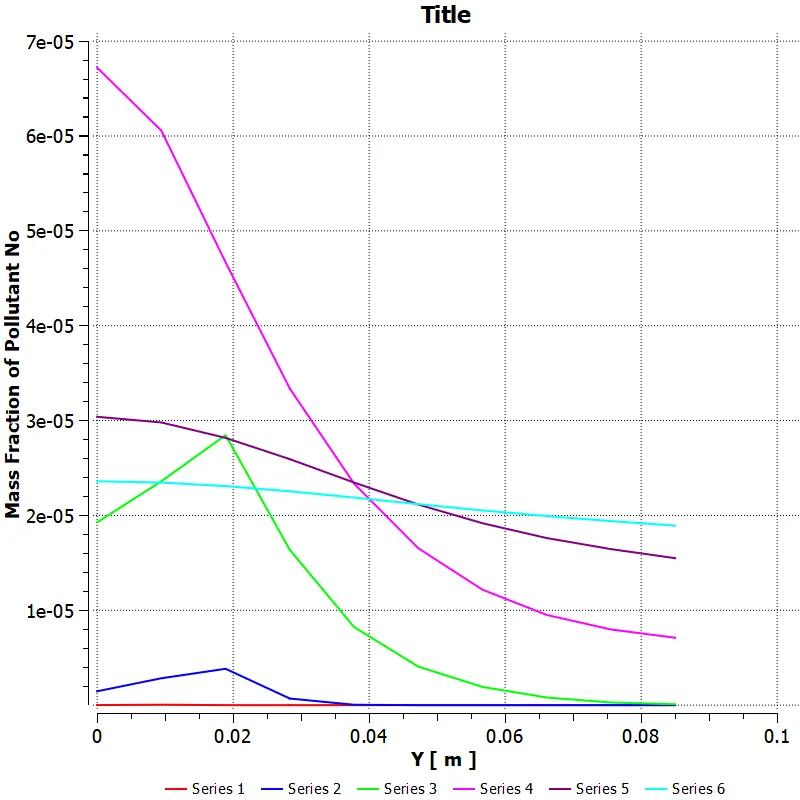
NOx EMMISSION CHART
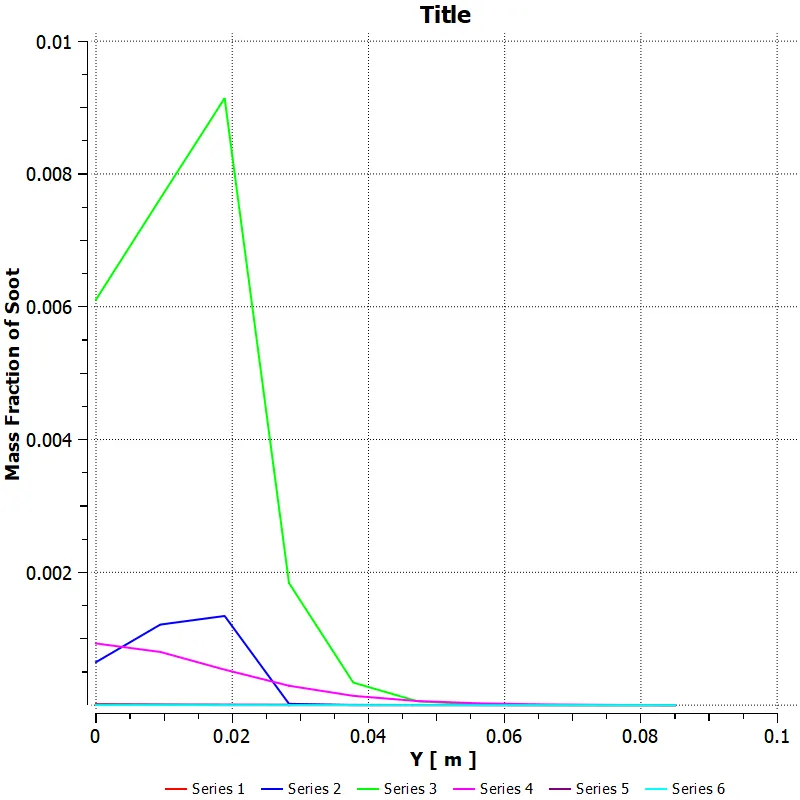
Soot formation CHART
CONCLUSION :
OBSERVED EFFECTS :
| Air inlet species | Fuel inlet species | Water content in the fuel | Temperature in K | NOx | Soot formation |
| `O2=0.23` | `CH_4 = 1` | `H_2O = 0` | 1607.61 | 0.00014 | `4.878e^-05` |
| `O2=0.23` | `CH_4 = 0.95` | `H_2O = 0.5` | 1558.01 | 0.00010 | `1.579e^-05` |
| `O2=0.23` | `CH_4 = 0.85` | `H_2O = 0.15` | 1455.27 | `6.075e^-05 | `2.0967e^-06` |
| `O2=0.23` | `CH_4 = 0.75` | `H_2O = 0.25` | 1345.42 | `3.0695e^-05` | `2.4504e^-07` |
| `O2=0.23` | `CH_4 = 0.7` | `H_2O = 0.3` | 1345.42 | `2.0675e^-05` | `7.709e^-08` |
Eddy-dissipation model helps us to model combustion process via turbulence without the presence of ignition source.
Adding water content in the fuel by 5% to 30% by mole leads to decrease in temperature,NOx emission and soot formation.
Increase in water, decreases temeperature,NOx emission,soot formation, increases in N2,O2.
Decrease in soot in presence of H2O determines the less leakage of fuel and there will be complete combustion process.