Parsing NASA thermodynamic data(MATLAB)
Objective:
- Write a function that extracts the 14 co-efficients and calculates the enthalpy, entropy and specific heats for all the species in the data file.For this I will be reading the file NASA thermodynamic data.
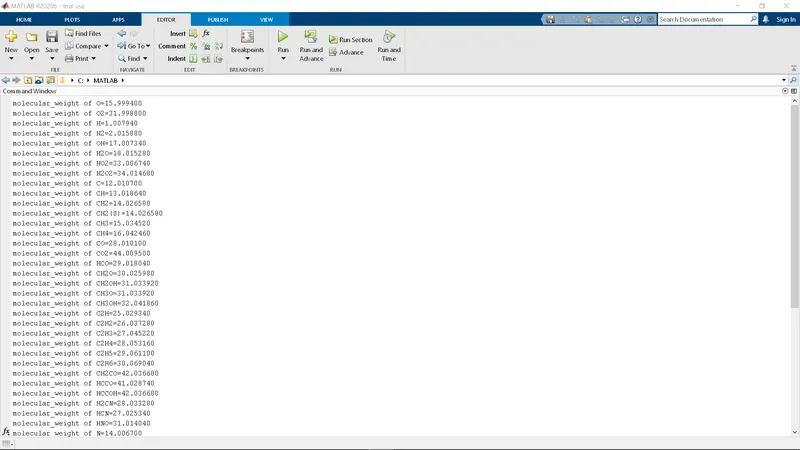
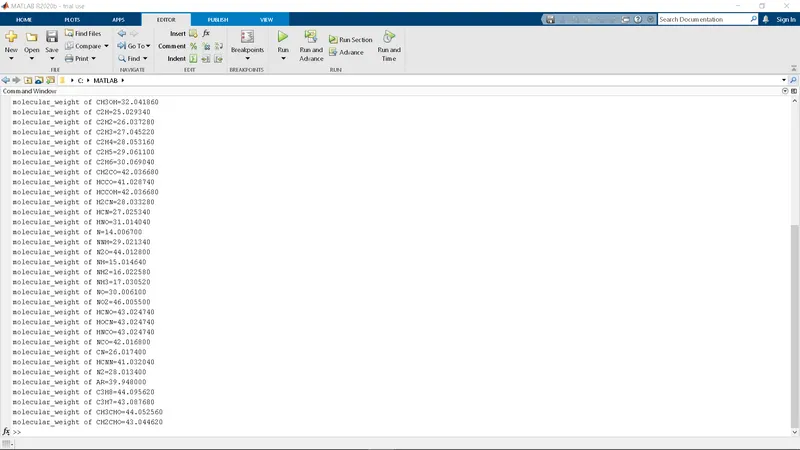
- Calculate the molecular weight of each species and display it in the command window.
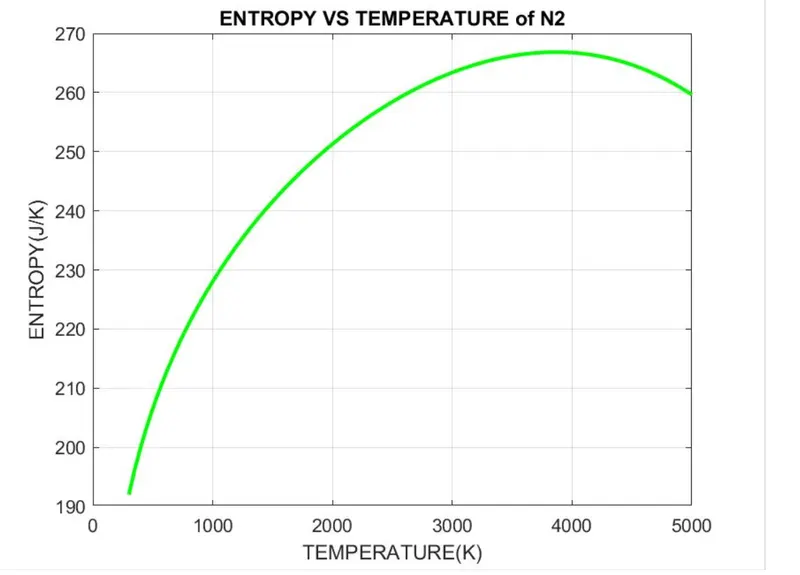
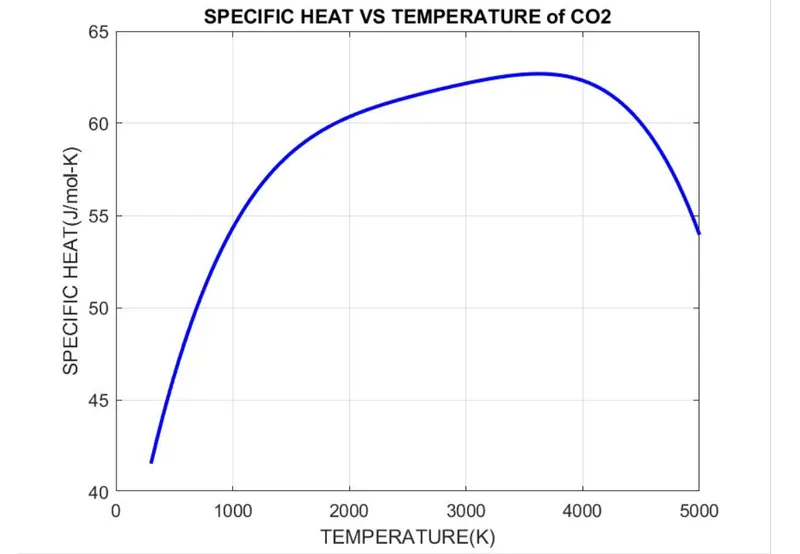
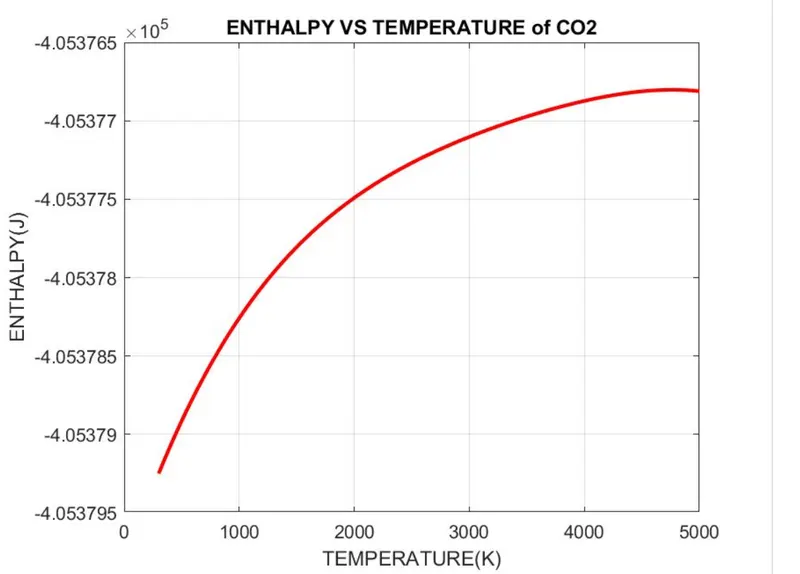
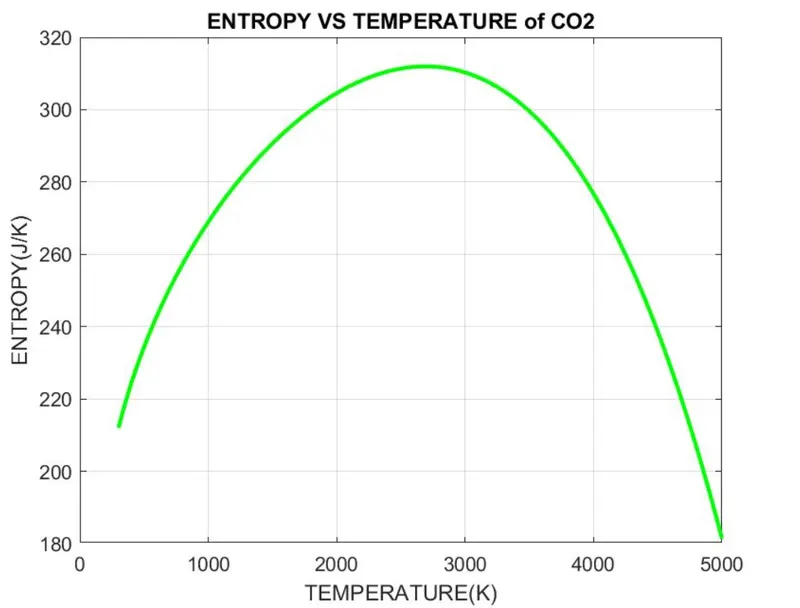
- Plot the Cp, Enthalpy and Entropy for the local temperature range (low temperature : high temperature) specific for each species.
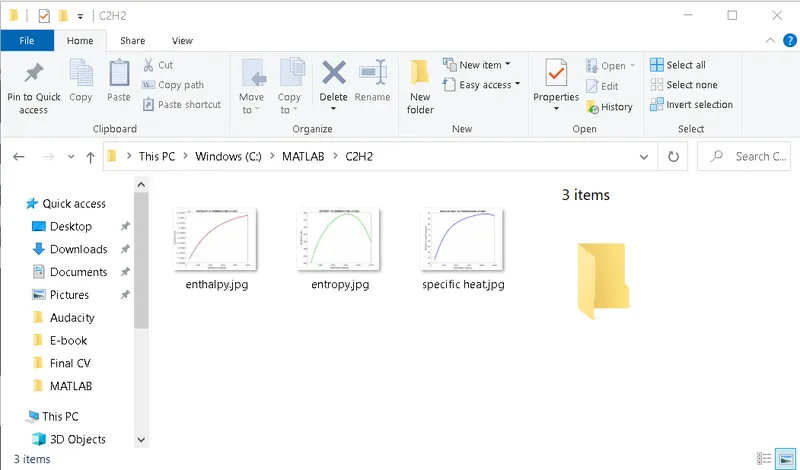
- Save the plots as images with appropriate names and dump them in separate folders for each species with suitable name. All these should be generated automatically.
Solution: NASA came up with the polynomials that can be used to evaluate thermodynamic properties such as Cp, Enthalpy and Entropy.They have also documented the co-efficients that are required to evaluate these polynominal for 53 species.
The formulae are shown below.
Here R is the universal gas constant, T is the temeprature
The FIRST 7 coefficients are HIGH-temperature coefficients and the SECOND 7 coefficients are LOW-temperature coefficients.
File Parsing here refers to how information can be read from a particular text file or any type of file and how that information can be used for computer program.
Code for the Program:
clear all
close all
clc
%open the file for reading
f1=fopen('THERMO.dat','r');
gt=fgetl(f1);
%Reading the Header information
%Global Tempersture
global_temp=fgetl(f1);
%Splitting
t=strsplit(global_temp);
%Converting string cell into num
global_low_temp=str2double(t{2});
global_mid_temp=str2double(t{3});
global_high_temp=str2double(t{4});
%Universal Gas Constant
R=8.314;
t=linspace(global_low_temp,global_high_temp,100);

%Neglecting the 3 lines
for i = 1:3
    gt=fgetl(f1);
end
%Reading species
for i=1:53
    gt=fgetl(f1);
    A=strsplit(gt,' ');
    species_name=(A{1});

    line_1=fgetl(f1);
    b=strfind(line_1,'E');

    %Extracting higher and lower coefficient

    % 1st coefficient
    b1=line_1(1:b(1)+3);
    b1=str2num(b1);

    % 2nd coefficient
    b2=line_1(b(1)+4:b(2)+3);
    b2=str2num(b2);

    % 3rd coefficient
    b3=line_1(b(2)+4:b(3)+3);
    b3=str2num(b3);

    % 4th coefficient
    b4=line_1(b(3)+4:b(4)+3);
    b4=str2num(b4);

    % 5th coefficient
    b5=line_1(b(4)+4:b(5)+3);
    b5=str2num(b5);

    %line two
    line_2=fgetl(f1);

    % 6th coefficient
    b6=line_2(1:b(1)+3);
    b6=str2num(b6);


    % 7th coefficient
    b7=line_2(b(1)+4:b(2)+3);
    b7=str2num(b7);

    % 8th coefficient
    b8=line_2(b(2)+4:b(3)+3);
    b8=str2num(b8);

    % 9th coefficient
    b9=line_2(b(3)+4:b(4)+3);
    b9=str2num(b9);

    % 10th coefficient
    b10=line_2(b(4)+4:b(5)+3);
    b10=str2num(b10);

    %line Three
    line_3=fgetl(f1);

    % 11th coefficient
    b11=line_3(1:b(1)+3);
    b11=str2num(b11);

    % 12th coefficient
    b12=line_3(b(1)+4:b(2)+3);
    b12=str2num(b12);

    % 13th coefficient
    b13=line_3(b(2)+4:b(3)+3);
    b13=str2num(b13);

    % 14th coefficient
    b14=line_3(b(3)+4:b(4)+3);
    b14=str2num(b14);


    %To calculate Specific heat by creating function
    c_p=specific_heat(b1,b2,b3,b4,b5,b6,b7,b8,b9,b10,b11,b12,b13,b14,global_low_temp,global_mid_temp,global_high_temp,t,R);

    %To calculate Enthalpy by creating function
    H=enthalpy(b1,b2,b3,b4,b5,b6,b7,b8,b9,b10,b11,b12,b13,b14,global_low_temp,global_mid_temp,global_high_temp,t,R);

    %To calculate Entropy by creating function
    S=entropy(b1,b2,b3,b4,b5,b6,b7,b8,b9,b10,b11,b12,b13,b14,global_low_temp,global_mid_temp,global_high_temp,t,R);

    %To calulate molecular mass
    W=molecular_weight(species_name);

    %Creating a Folder
    cur_dir=pwd;
    mkdir(['C:',species_name])
    cd(species_name)

    %Plotting for Temperatue Vs Specific Heat

    figure(1);
    plot(t,c_p,'linewidth',2,'color','b');
    xlabel('TEMPERATURE(K)')
    ylabel('SPECIFIC HEAT(J/mol-K)')
    title(sprintf('SPECIFIC HEAT VS TEMPERATURE of %s',species_name))
    grid on
    saveas(figure(1),'specific heat.jpg');

    %Plotting for Temperatue Vs Enthalpy
    figure(2);
    plot(t,H,'linewidth',2,'color','r');
    xlabel('TEMPERATURE(K)')
    ylabel('ENTHALPY(J)')
    title(sprintf('ENTHALPY VS TEMPERATURE of %s',species_name))
    grid on
    saveas(figure(2),'enthalpy.jpg');

    %Plotting for Temperatue Vs Entropy
    figure(3);
    plot(t,S,'linewidth',2,'color','g');
    xlabel('TEMPERATURE(K)')
    ylabel('ENTROPY(J/K)')
    title(sprintf('ENTROPY VS TEMPERATURE of %s',species_name))
    grid on
    saveas(figure(3),'entropy.jpg');

    cd(cur_dir);

end
Function for Specific Heat:
function [c_p]=specific_heat(b1,b2,b3,b4,b5,b6,b7,b8,b9,b10,b11,b12,b13,b14,global_low_temp,global_mid_temp,global_high_temp,t,R)

if t<=global_mid_temp
    c_p=(b8+b9.*t+b10.*t.^2+b11.*t.^3+b12.*t.^4)*R;
else
     c_p=(b1+b2.*t+b3.*t.^2+b4.*t.^3+b5.*t.^4)*R;
end
end
Function for Enthalpy:
function [H]=enthalpy(b1,b2,b3,b4,b5,b6,b7,b8,b9,b10,b11,b12,b13,b14,global_low_temp,global_mid_temp,global_high_temp,t,R)
if t<=global_mid_temp
     H=(b8+(b9.*t)/2+(b10.*t.^2)/3+(b11.*t.^3)/4+(b12.*t.^4)/5+(b13./t))*R.*t;
else
    H=(b1+(b2.*t)/2+(b3.*t.^2)/3+(b4.*t.^3)/4+(b5.*t.^4)/5)+(b6./t)*R.*t;
   end
end
Function for Entropy:
function[S]=entropy(b1,b2,b3,b4,b5,b6,b7,b8,b9,b10,b11,b12,b13,b14,global_low_temp,global_mid_temp,global_high_temp,t,R)
if t<=global_mid_temp
     S=(b8.*log(t)+b9.*t+(b10.*t.^2)/2+(b11.*t.^3)/3+(b12.*t.^4)/4+b14)*R;
else
   S=(b1.*log(t)+b2.*t+(b3.*t.^2)/2+(b4.*t.^3)/3+(b5.*t.^4)+b7)*R;
end
end
Function for Molecular weight:
function[W]=molecular_weight(species_name)


Atomic_name=['O','H', 'C','N','A'];
Atomic_weight= [15.9994 1.00794 12.0107 14.0067 39.948];

W=0;
for i=1:length(species_name)
    for j=1:length(Atomic_name)
    if strcmp(species_name(i),Atomic_name(j))
      W= W+Atomic_weight(j);
      u = j;
    end
    end

n= str2num(species_name(i));
if n>1
    W=W +Atomic_weight(u)*(n-1);

end
end
fprintf('molecular_weight of %s=%fn',species_name,W)
end
Code Explanation:
Syntax used for coding
| Fopen: | Open a file or obtain information about open file |
| 'r': | Open the file for reading |
| fgetl: | Read line from file |
| strsplit | Split string or character vector at specified delimiter |
| str2num | Convert character array or string into numeric array |
| strfind | Find one string with another |
| pwd | Identify current directory |
| mkdir | make new directory |
| cd | change working directory |
- Open the file THERMO.dat using fopen command and for reading the file use 'r' command.
- For reading the line in text file using fgetl command.
- To obtain the temperature range from the file,using strsplit command to split the temperature into a particular string cell.Using str2num for converting string cell into numbers.(i.e,dividing the temperature into string and then into numbers so that this temperature values can be used to solve the program).
- Now in order to skip the next three lines which are called as comments,for&end loop is used.
- Using for loop to read all 53 species in a file to plot the Specific Heat(Cp), Enthalpy(H),Entropy(S) and molecular weight(W).Using linespace command for specified temperature range.(i.e, low to high temperature coefficient).
- Extracting higher and lower temperature coefficient by reading line by line from all species.
- Calling Specific heat,ethalpy,entropy and molecular weight function in order to get desired results.
- Plotting the results obtained with labels and titles .
Errors obtained while programming: Basic typo errors were obtained which was solved by observing the code again.
RESULTS:
1.Molecular weight of each species displayed in command window:
2.Screenshot of the window where all the folders are saved:

3.PLOT'S:
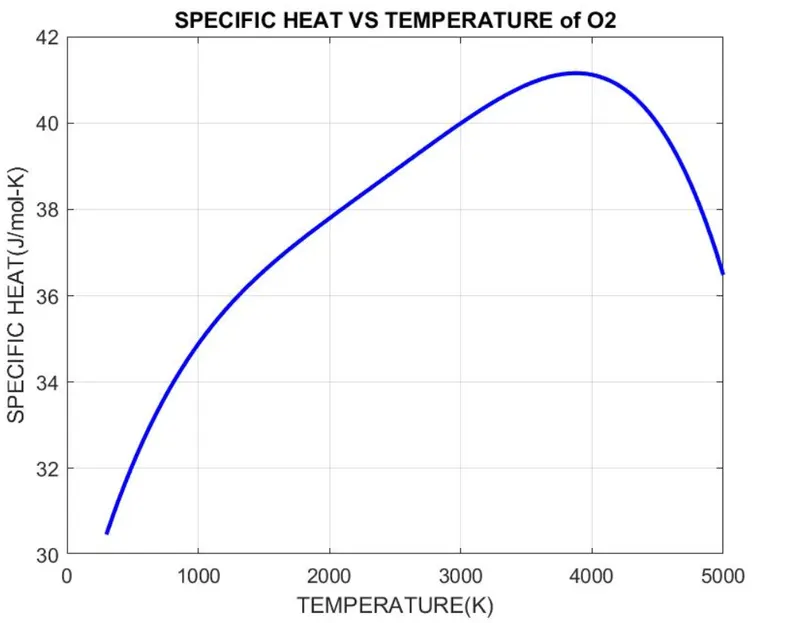
1. Plot for O2:-
a.Variation of Specific heat with temperature for O2
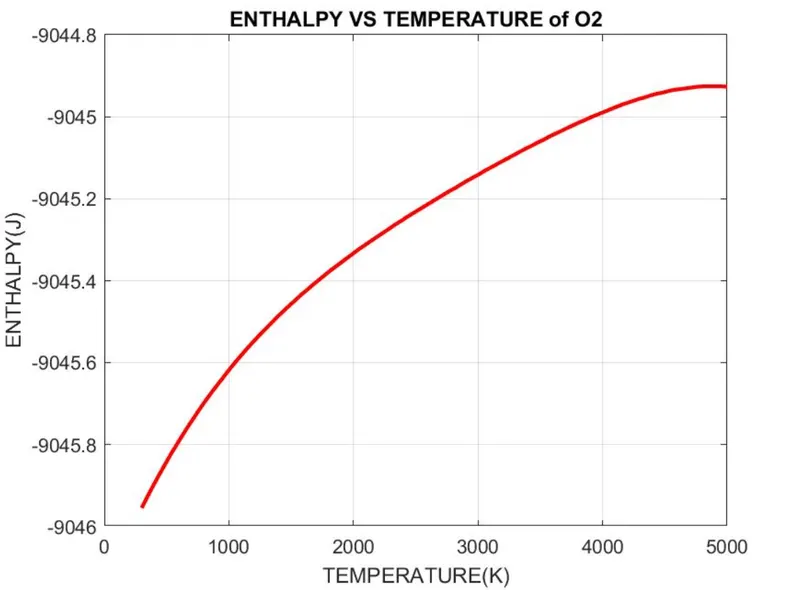
b.Variation of Enthaly with temperature for O2
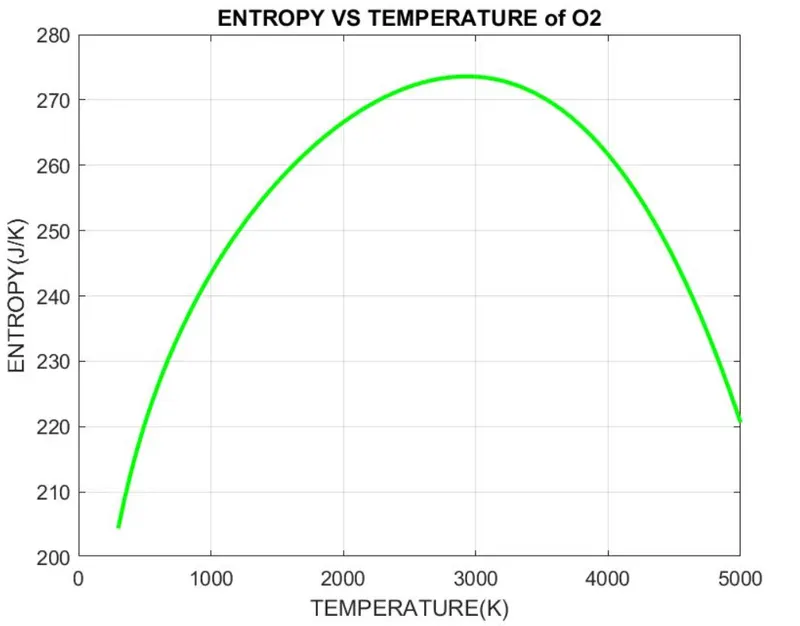
c.Variation of Entropy with temperature for O2
2. Plot for N2:-
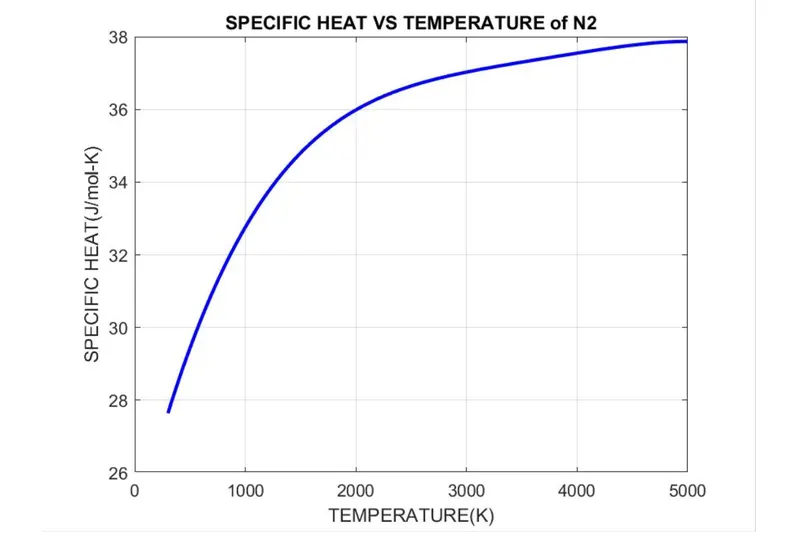
a.Variation of Specific heat with temperature for N2
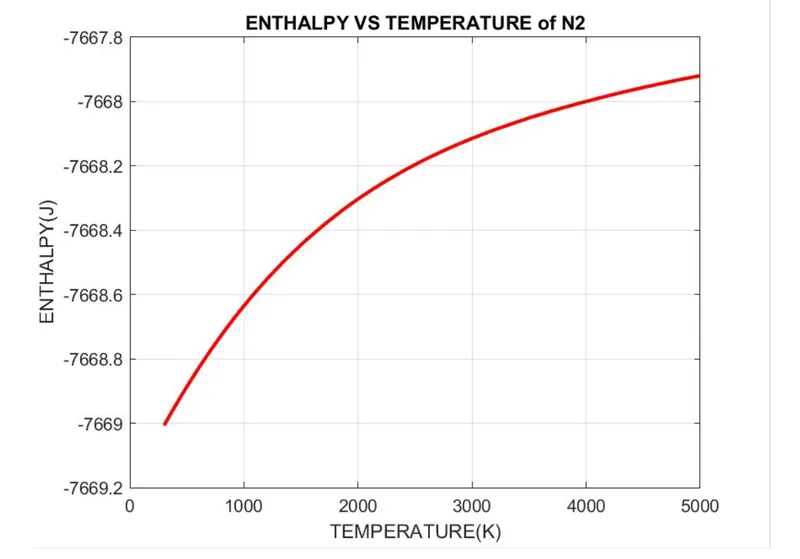
b.Variation of Enthaly with temperature for N2
c.Variation of Entropy with temperature for N2
2. Plot for CO2:-
a.Variation of Specific heat with temperature for CO2
b.Variation of Enthaly with temperature for CO2
c.Variation of Entropy with temperature for CO2
Conclusion:
Using Matlab code,the necessary coefficients required to evaluate various thermodynamic parameter for different species are extracted from NASA thermodynamic data file.The specific heat,enthalpy and entropy for all the species are calculated and plotted against the temperature range.The molecular weight is also calculated for all species.