Plot a function using basic Simulink blocks
Aim : To plot a function y(x) = (x-1) * (x-3)^2 * (x-9)^2 using basic Simulink blocks.
SIMULINK:
Simulink is a MATLAB based graphical program for modelling. Simulink blocks in MATLAB provide the interface for the function callers where we can call a function to get the result and plots for the function.
Block Diagram:
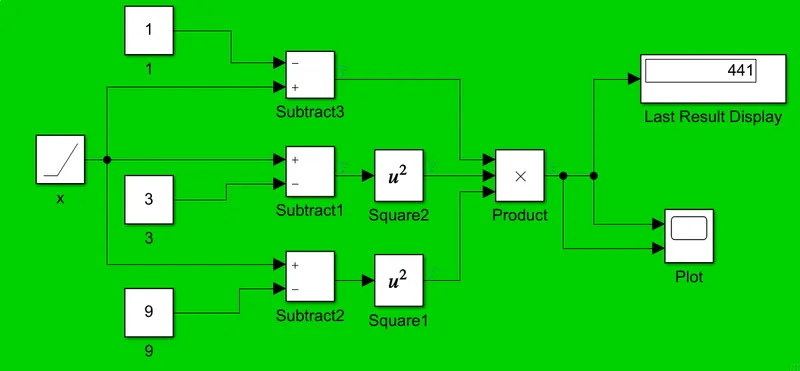
Fig. A - Simulink Model
- The Ramp block generates a signal that starts at a specified time and value and changes by a specified rate. The block's Slope, Start Time, and Initial output parameters determine the characteristics of the output signal. All must have the same dimensions after scalar expansion.
- The Constant block generates a real or complex constant value signal. Use this block to provide a constant signal input. The block generates scalar, vector, or matrix output
- A mathematical operation like -, *, and square are used
Output result using the scope :
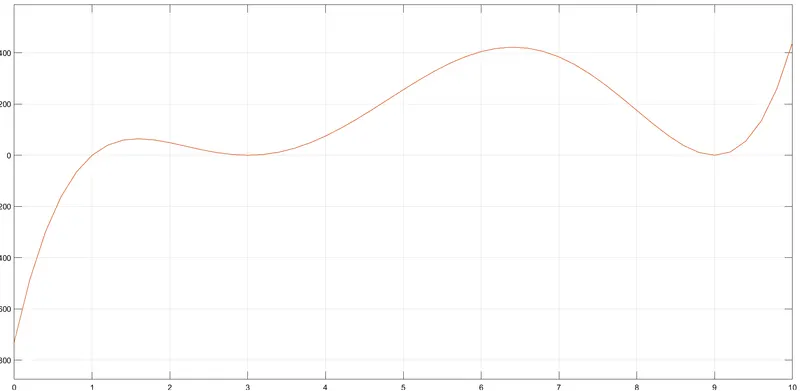 Fig.B - Plot for the given mathematical model
Here we can see from the graph that as the value of 'x' changes for the time the value of product changes respectively
CONCLUSION:
Thus, using Simulink blocks the given function (yx=(x-1)*(x-3)^2*(x-9)^2) has been plotted.