Gate Valve Parametric Study
PARAMETRIC STUDY ON GATE VALVE
Aim
- To obtain the mass flow rate at the output for each design point
- To calculate Flow coefficcient and Flow factor for each opening and to plot it in the graph
Introduction
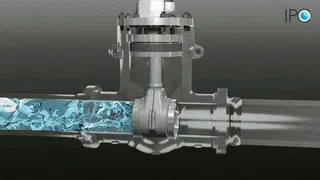
A gate valve, also known as a sluice valve, is a valve that opens by lifting a barrier (gate) out of the path of the fluid. Gate valves require very little space along the pipe axis and hardly restrict the flow of fluid when the gate is fully opened. The gate faces can be parallel but are most commonly wedge-shaped (in order to be able to apply pressure on the sealing surface).
Gate valves work by inserting a rectangular gate or wedge into the path of a flowing fluid. They are operated by a threaded stem which connects the actuator (generally a hand wheel or motor) to the stem of the gate.
Bonnets provide leakproof closure for the valve body.
Theory
One reason that gate valves are not normally used to regulate flow is that the flow rate of the fluid is not proportional to the amount that the valve is open. Moreover, a partially open gate valve may suffer from vibration in which the valve may move from its assigned position. Also the gate and seat may be subject to excessive wear if the valve is partially open.
One reason that gate valves are not normally used to regulate flow is that the flow rate of the fluid is not proportional to the amount that the valve is open. Moreover, a partially open gate valve may suffer from vibration in which the valve may move from its assigned position. Also the gate and seat may be subject to excessive wear if the valve is partially open.Gate valves are generally not suitable for regulating flow or pressure or operating in a partially open condition. For this service, a plug valve or a control valve should be used. It must be noted that because of the type of construction a gate valve requires many turns of the hand wheel to completely open or close the valve. When fully opened, gate valves offer little resistance to flow and its equivalent length to diameter ratio (L/D) is approximately 8.
Flow Coefficient:
The flow coefficient of a device is a relative measure of its efficiency at allowing fluid flow. It describes the relationship between the pressure drop across an orifice valve or other assembly and the corresponding flow rate.
Mathematically the flow coefficient Cv (or flow-capacity rating of valve) can be expressed as :

where:
- Q is the rate of flow (expressed in US gallons per minute),
- SG is the Specific gravity of the fluid (for water = 1),
- ΔP is the pressure drop across the valve (expressed in psi).
in our experiment the pressure drop across the valve is 10pa
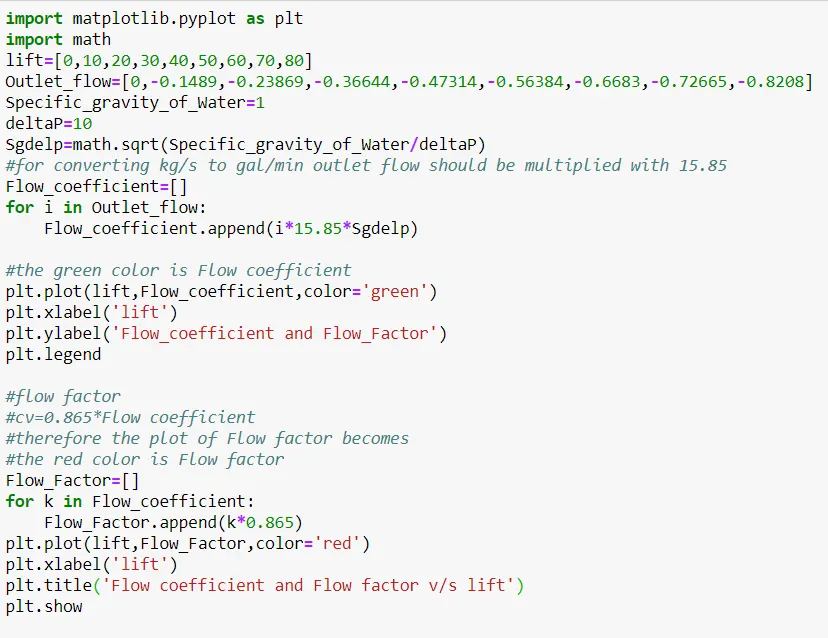
as 1 kg/s =15.85 gal/min the conversion will be easier
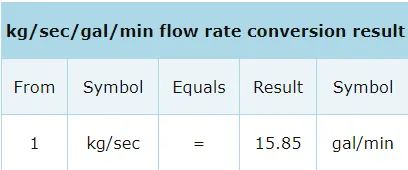
for example 0.1489 kg/s to gal/min=0.1489*15.85=2.36 gal/min
For Flow Factor
he metric equivalent flow factor (Kv; commonly used in Europe and Asia) is calculated using metric units :

where
- Kv is the flow factor
 .
. - Q is the flowrate (expressed in cubic metres per hour [
 ]),
]), - SG is the Specific gravity of the fluid (for water = 1),
- ∆P is the differential pressure across the device (expressed in [bar]).
As Kv can be calculated from Cv using the equation:

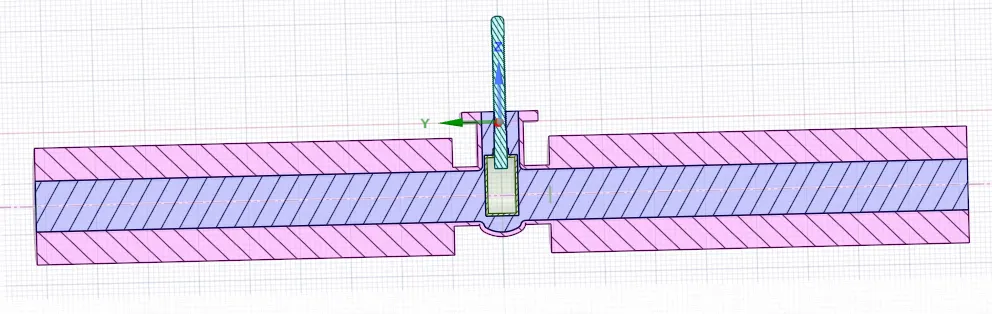
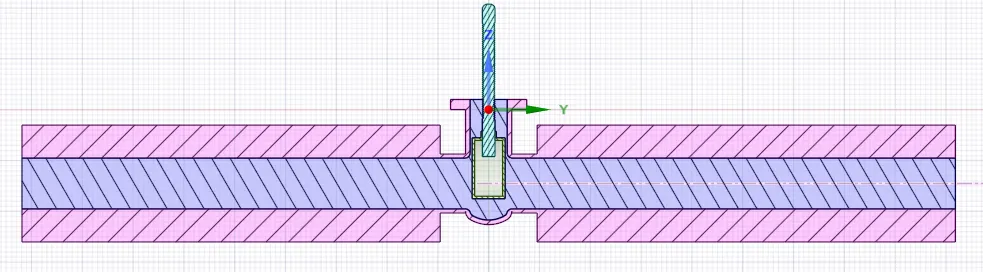
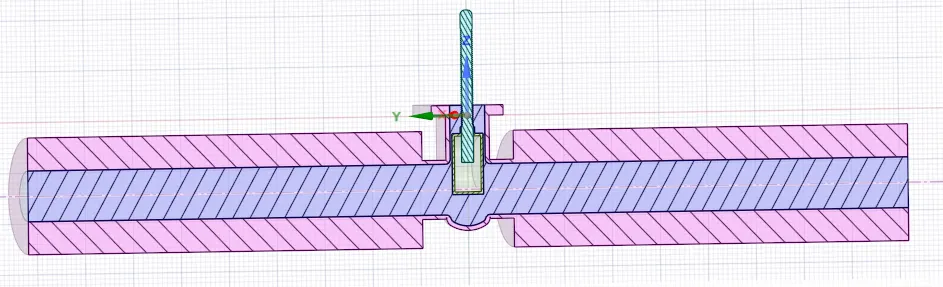
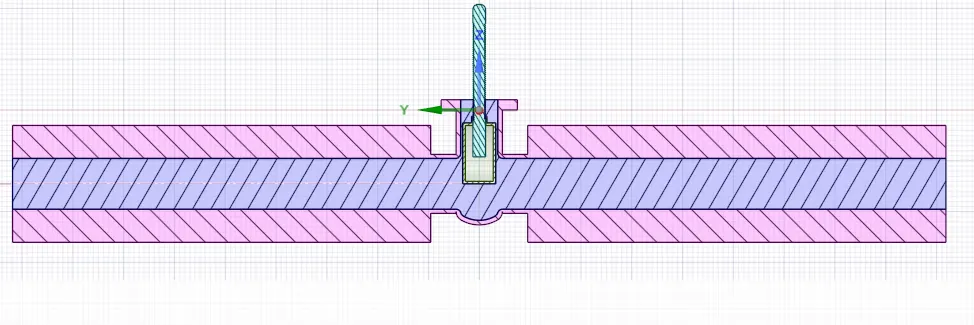
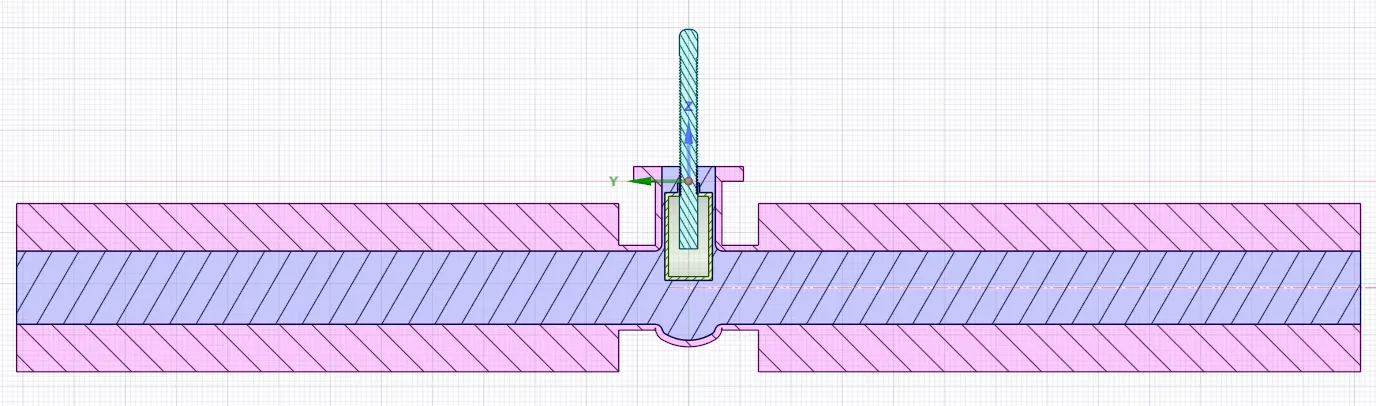
Sectional view of 10mm lift :
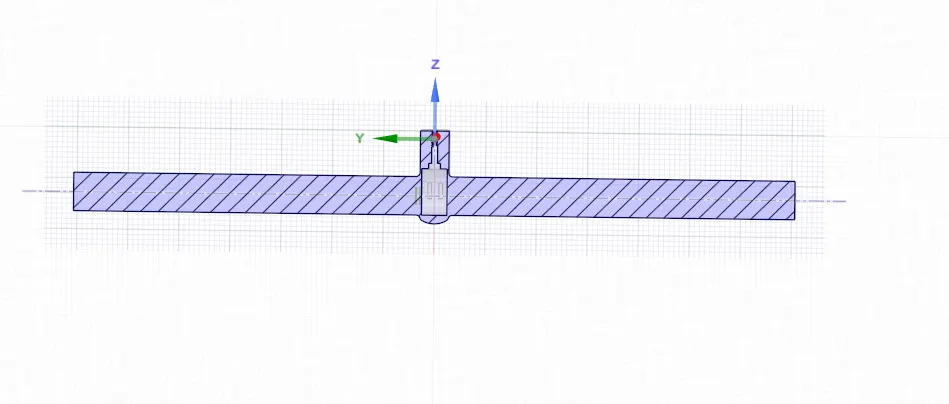
10 mm lift with enclosed volume
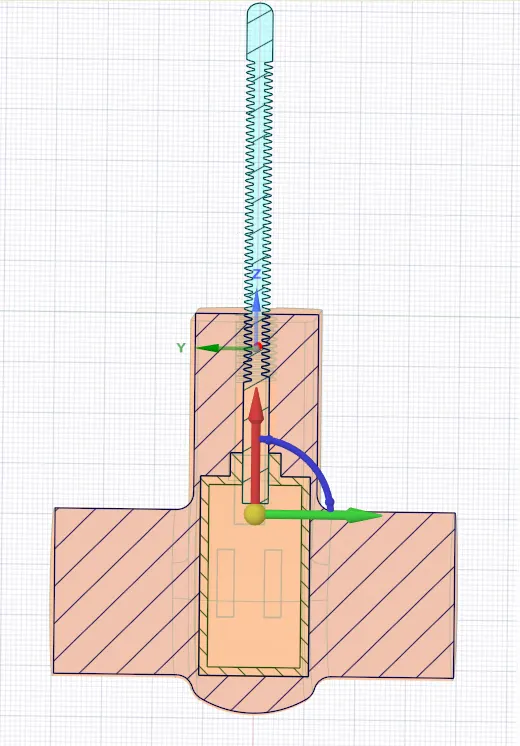
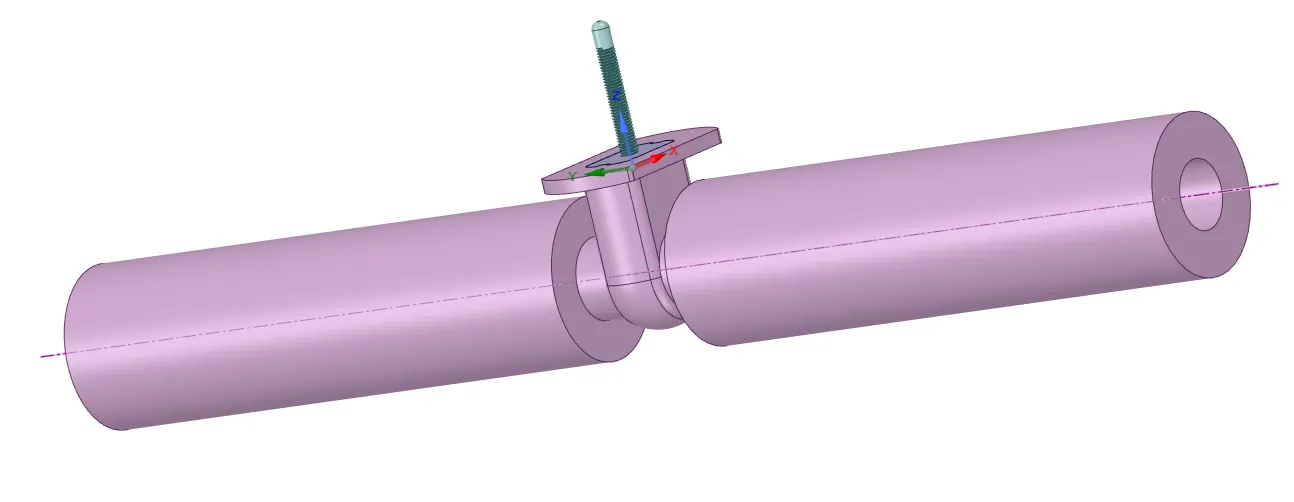
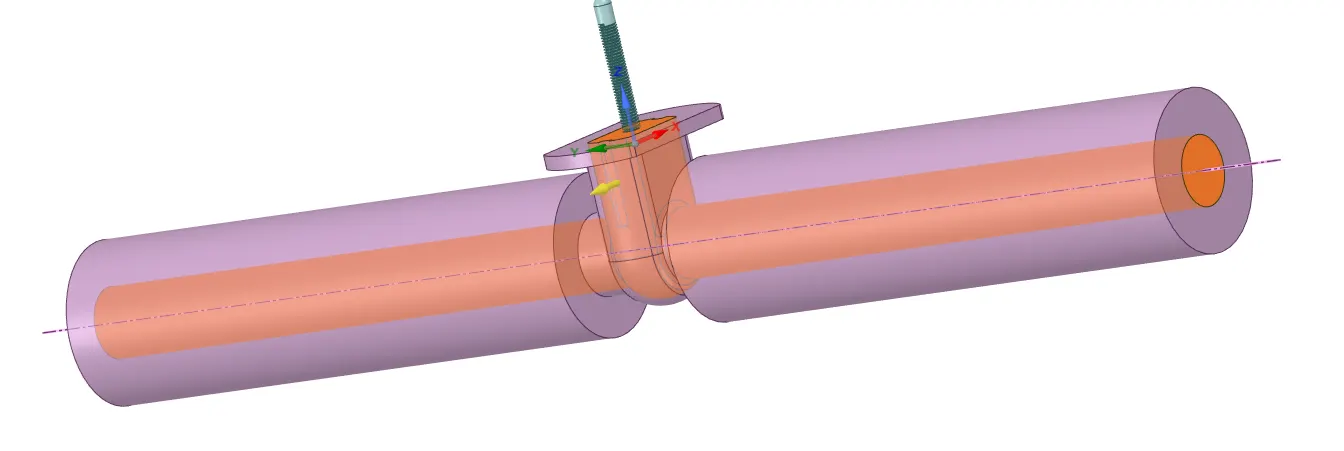
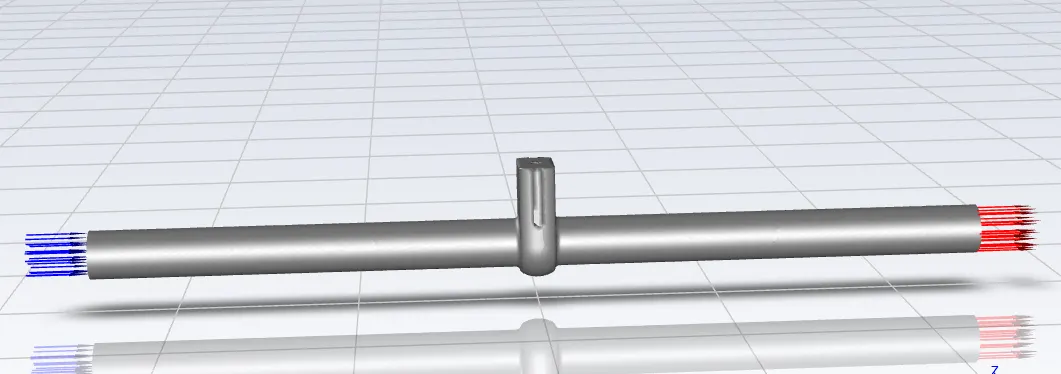
inlet and Outlet:
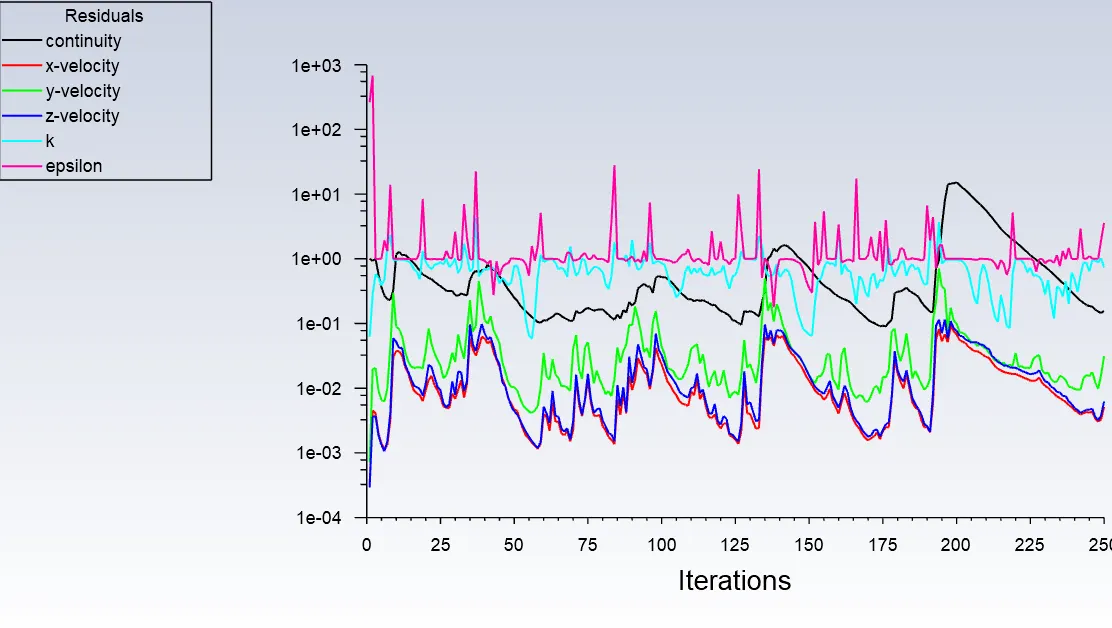
Meshed Geometry:With 190312 mesh elements
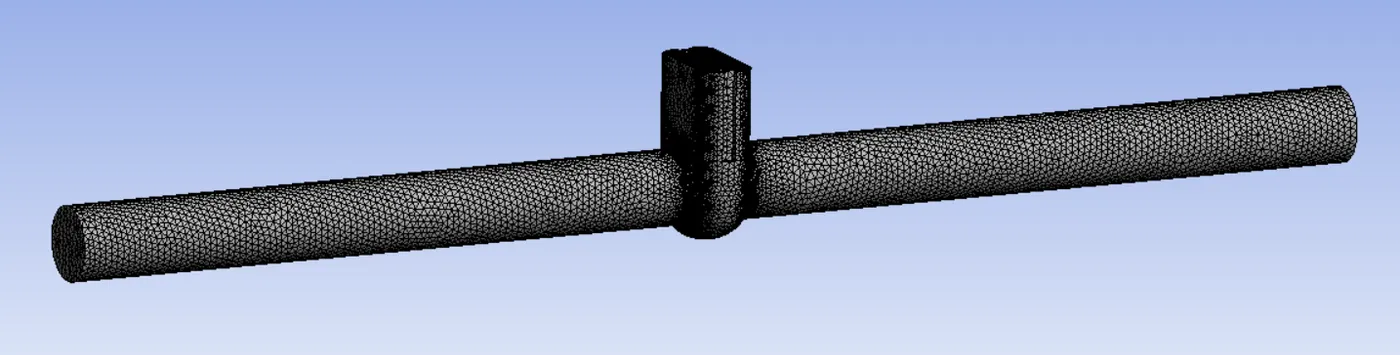
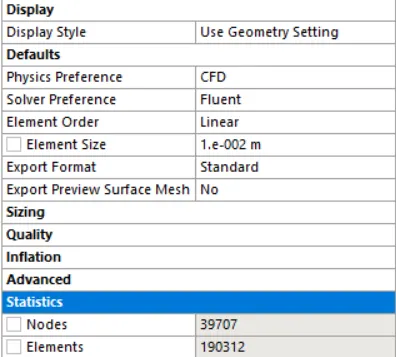
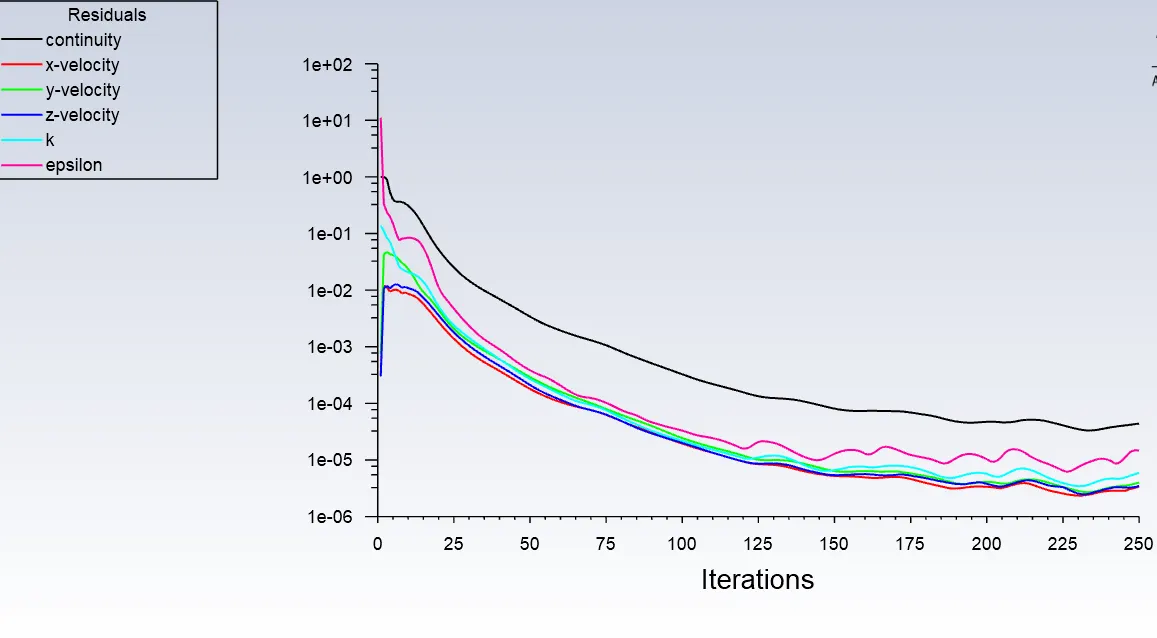
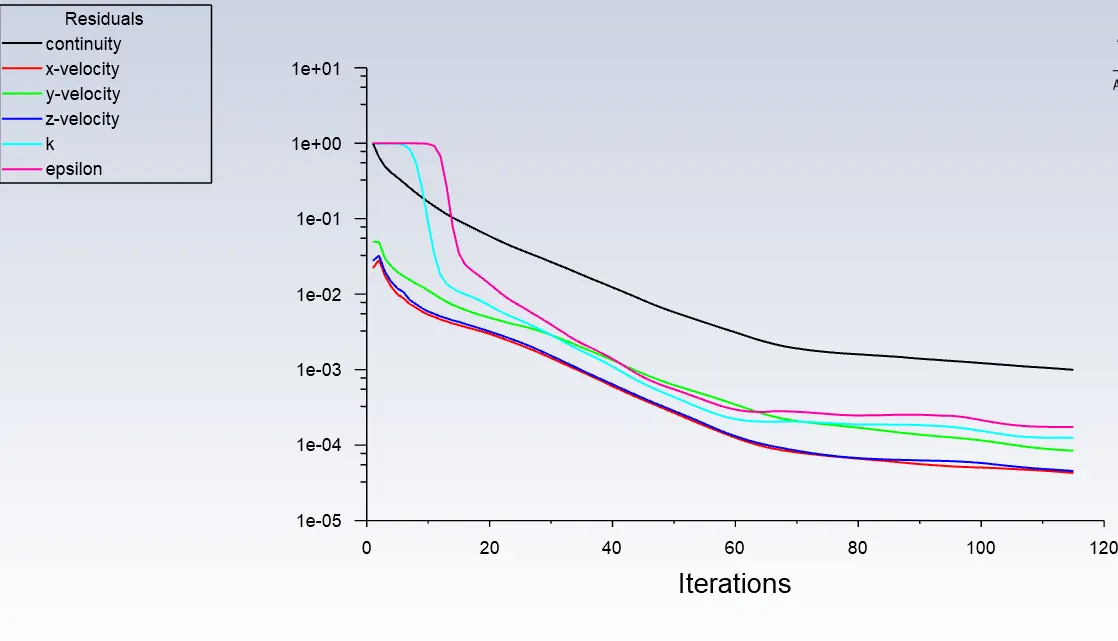
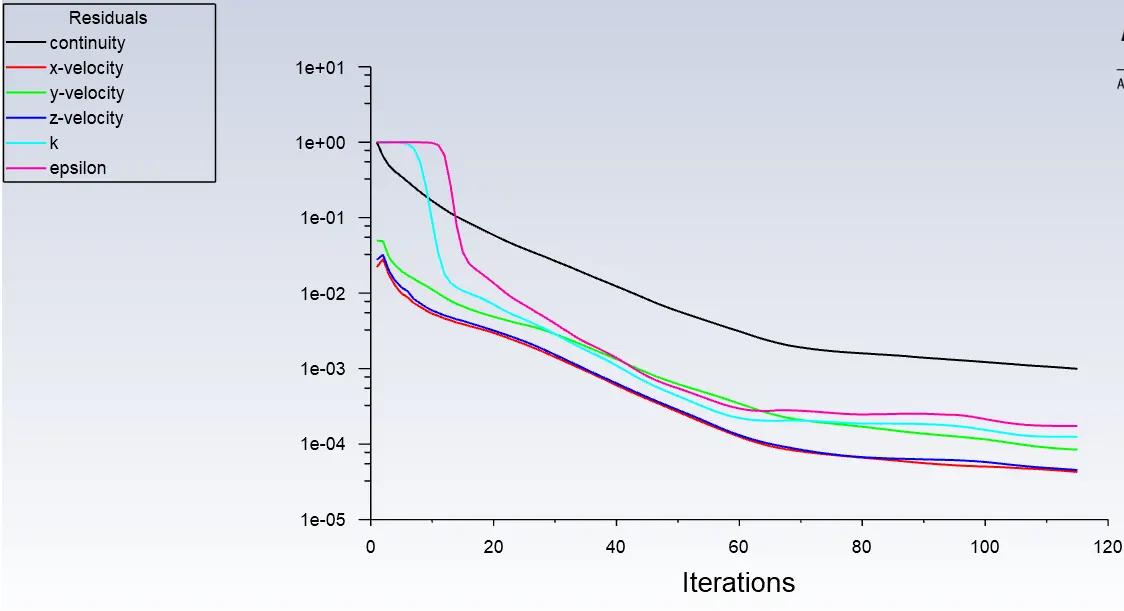
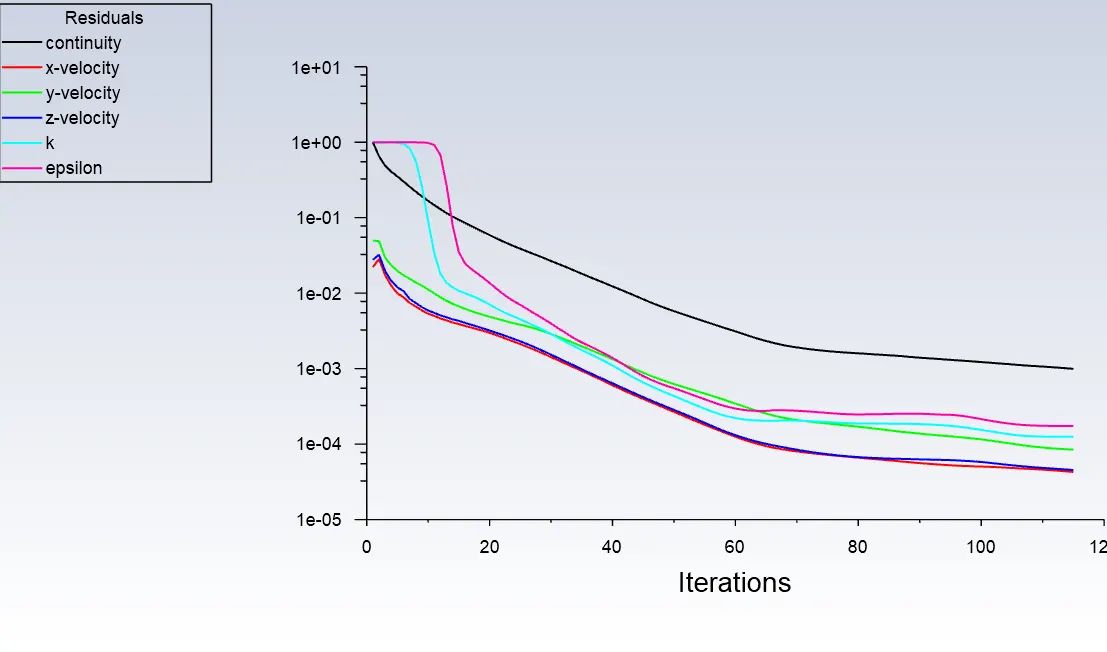
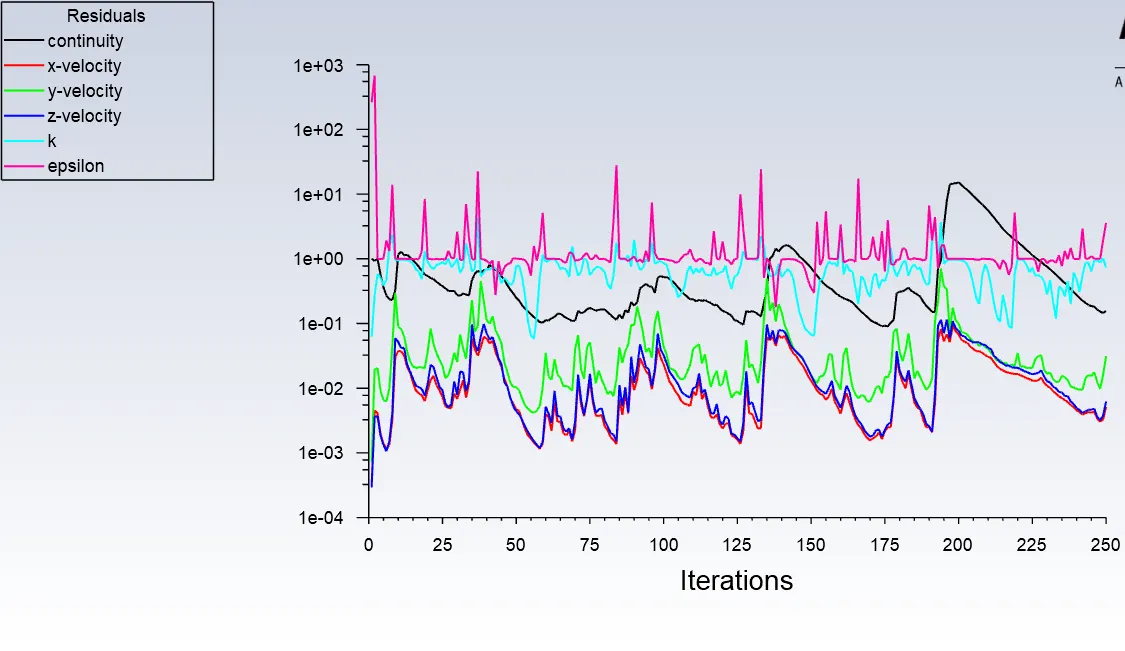
Turbulance model used: k-epsilon Realizable model with enhanced wall fucnction
Boundary conditions:pressure inlet10 pa
Results:
DP0:10mmlift:
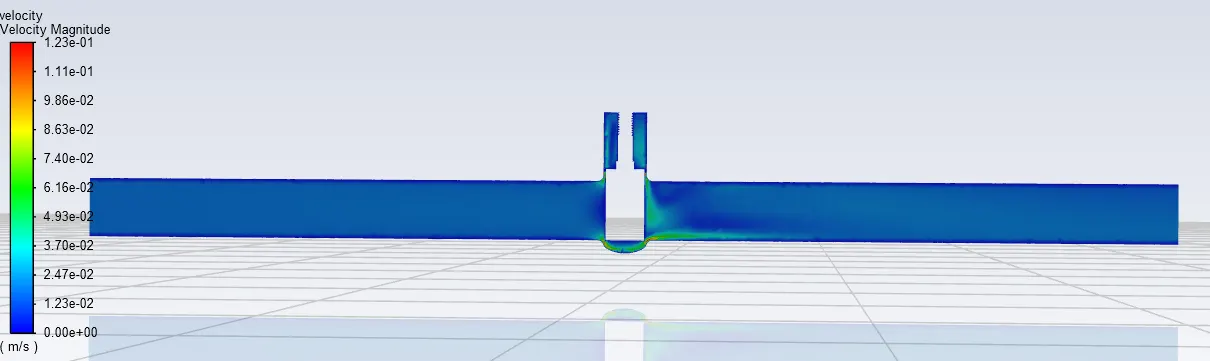
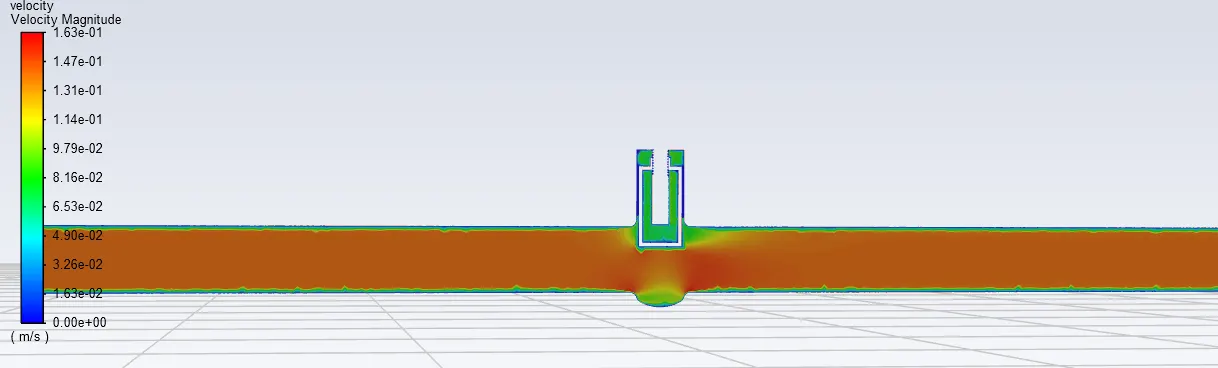
veloity contour
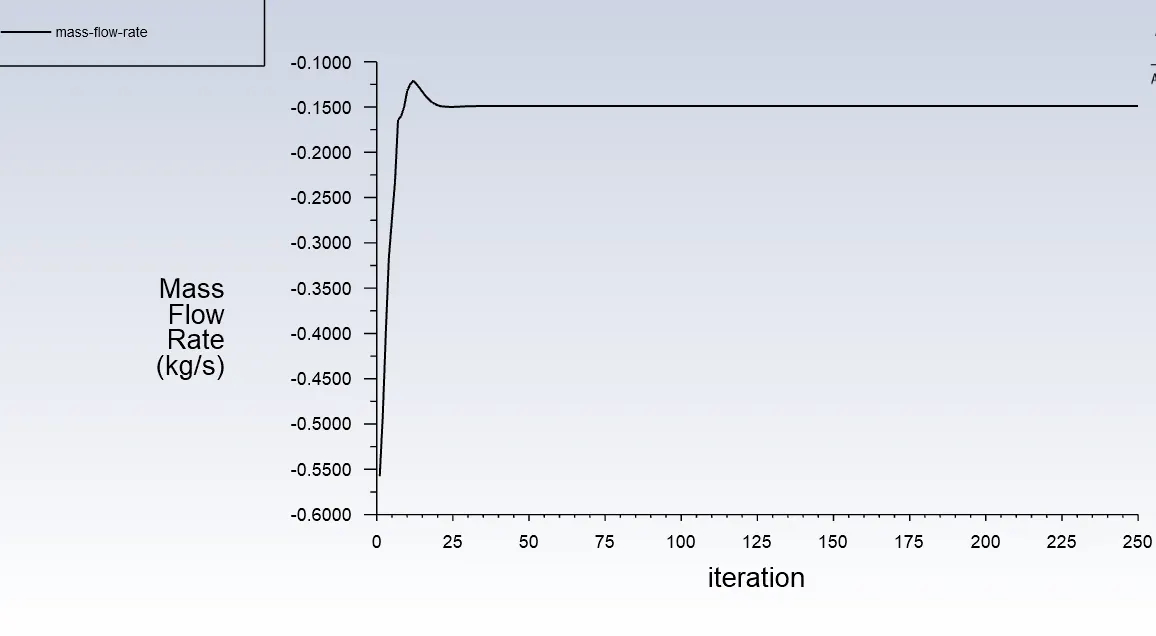
mass flow rate
outlet -0.14896615 kg/s
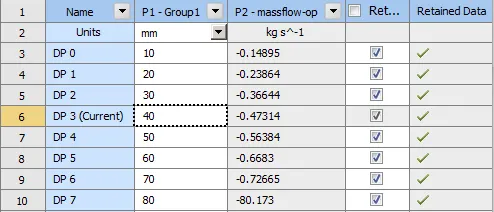
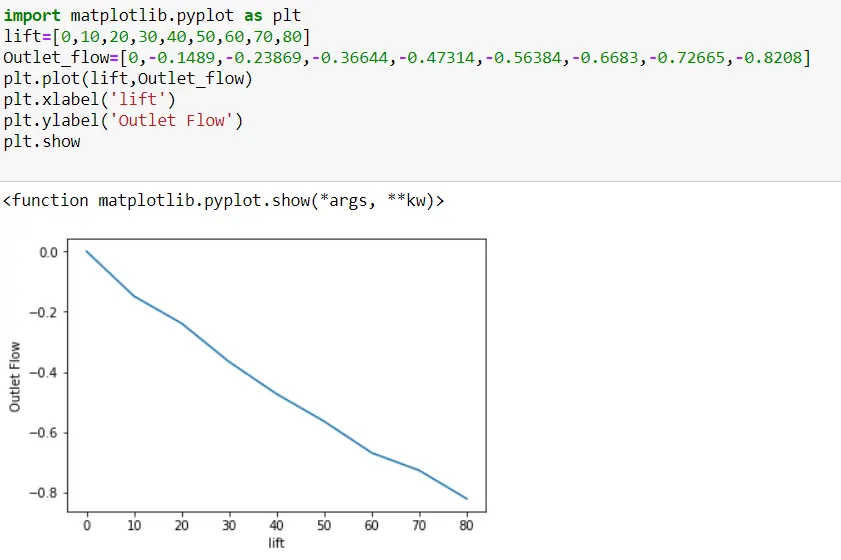
note:The DP7 value Shown at positio10 is incorrect ,a mistake made by Ansys.Re-Running the solution Provided the value of -0.8208 kg/s.
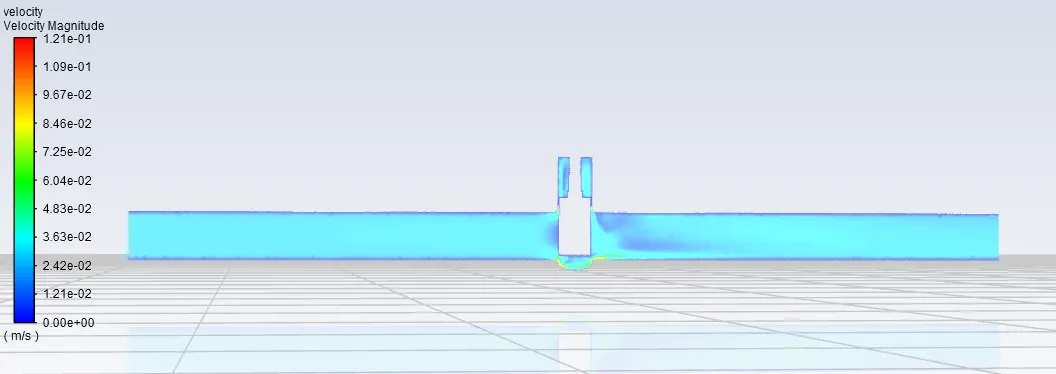
DP 1:(20mm)
Velocity Contour:
Animation file:
https://drive.google.com/drive/u/1/folders/11emehpSxrgpxuqe7cneQUWsGUq5zdlfG
DP 2 :(30mm)
Velocity Contour:
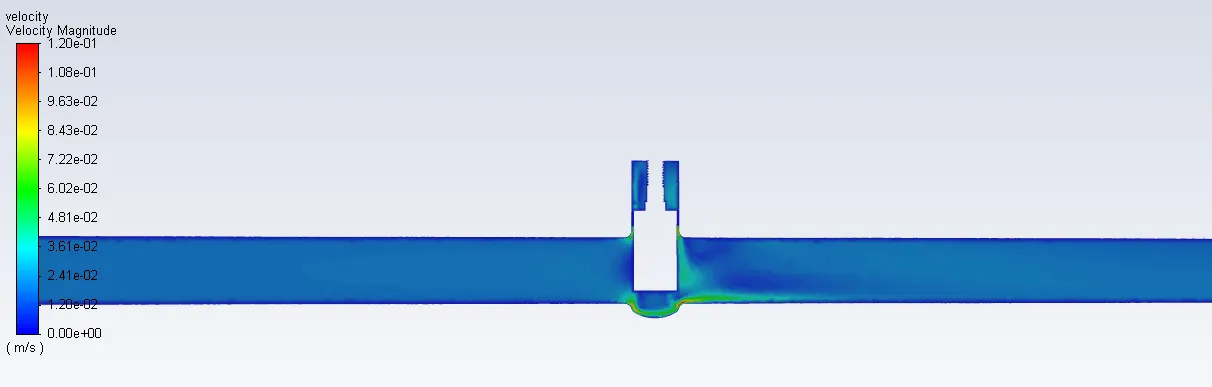
Animation Files:
https://drive.google.com/drive/u/1/folders/11emehpSxrgpxuqe7cneQUWsGUq5zdlfG
DP3:(40mm)
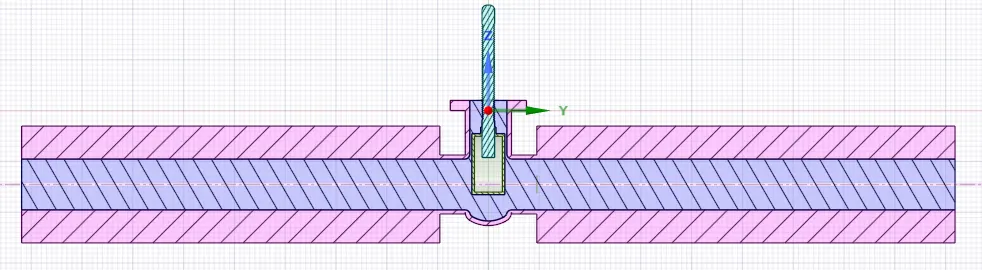
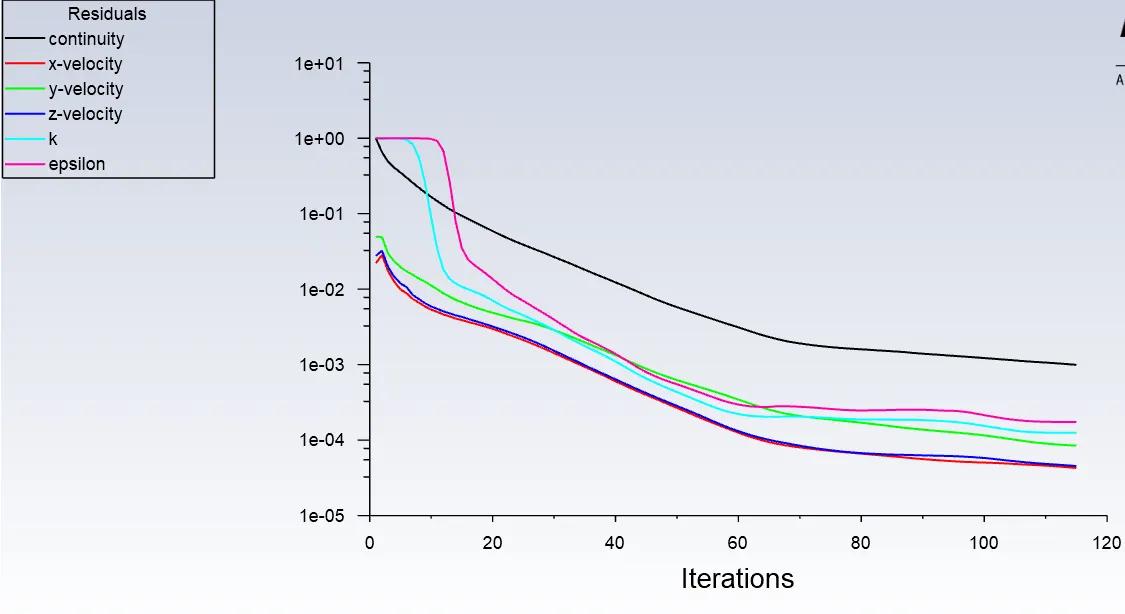
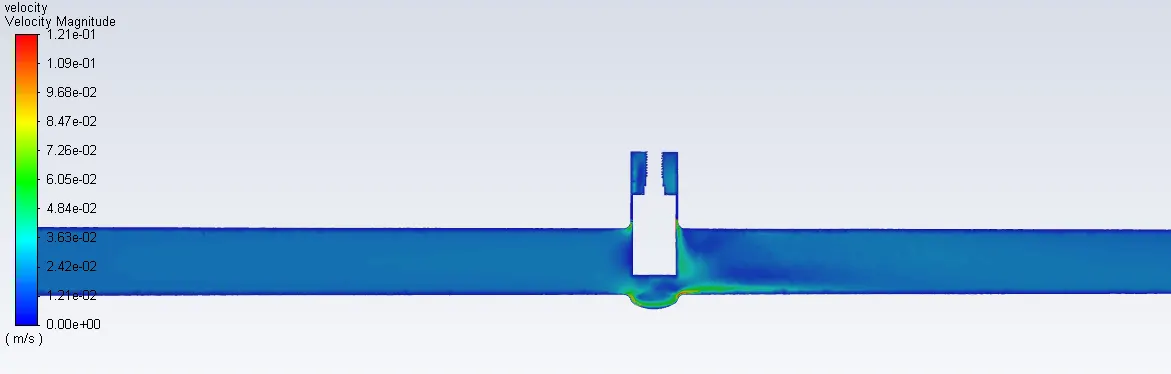
Velocity Contour:
Animation Files:
https://drive.google.com/drive/u/1/folders/11emehpSxrgpxuqe7cneQUWsGUq5zdlfG
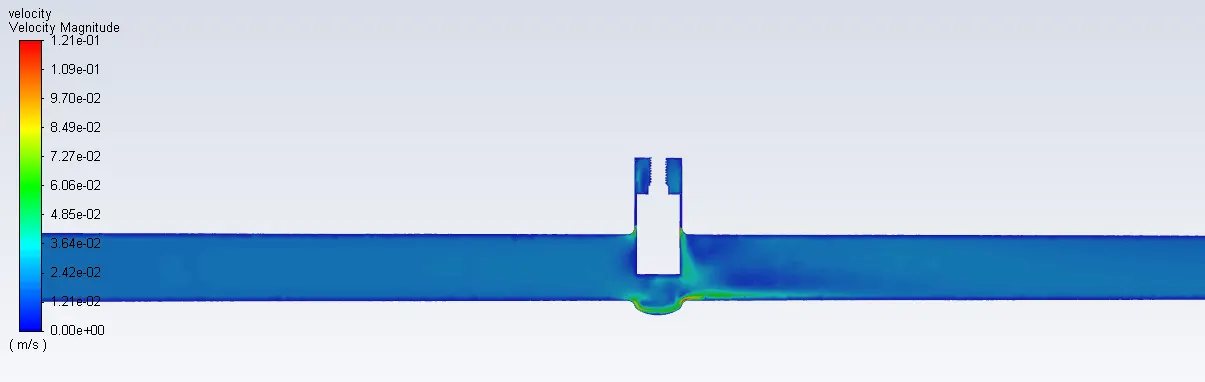
DP4:(50mm)
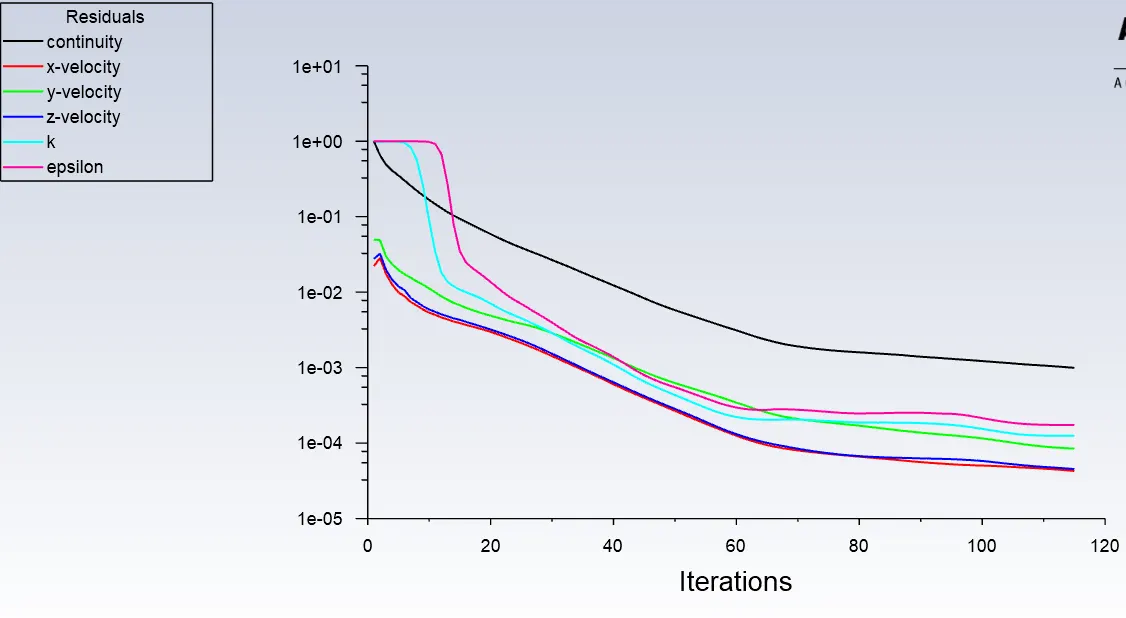
Velocity Contour:
Animation FIles:
https://drive.google.com/drive/u/1/folders/11emehpSxrgpxuqe7cneQUWsGUq5zdlfG
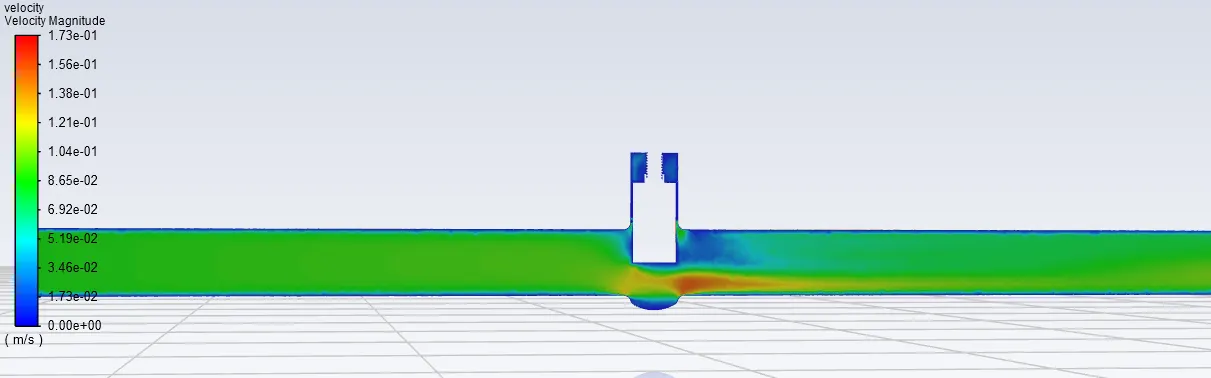
DP5:(60mm)
velocity Contour:
Animation Files:
https://drive.google.com/drive/u/1/folders/11emehpSxrgpxuqe7cneQUWsGUq5zdlfG
DP6:(70mm)
Velocity Contour:
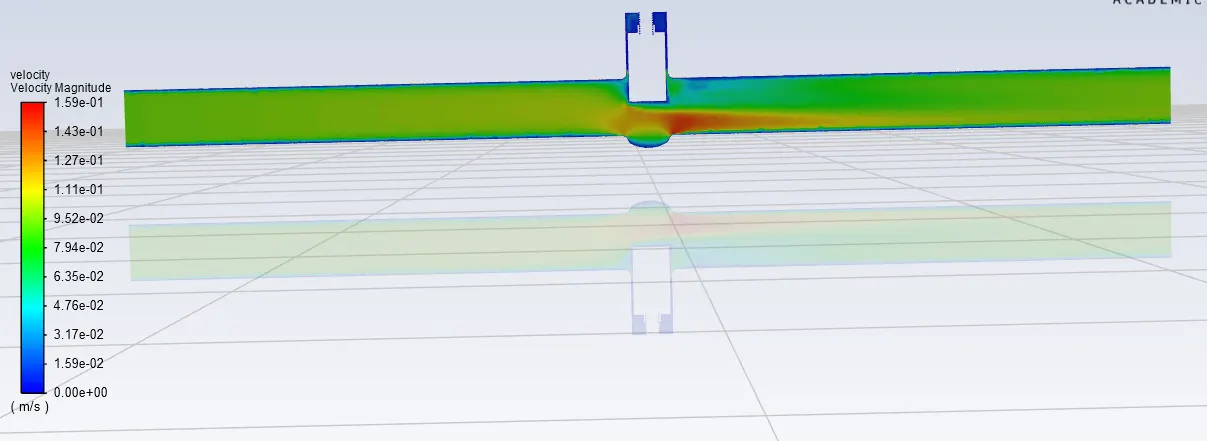
Animation Files:
https://drive.google.com/drive/u/1/folders/11emehpSxrgpxuqe7cneQUWsGUq5zdlfG
DP7:(80mm)
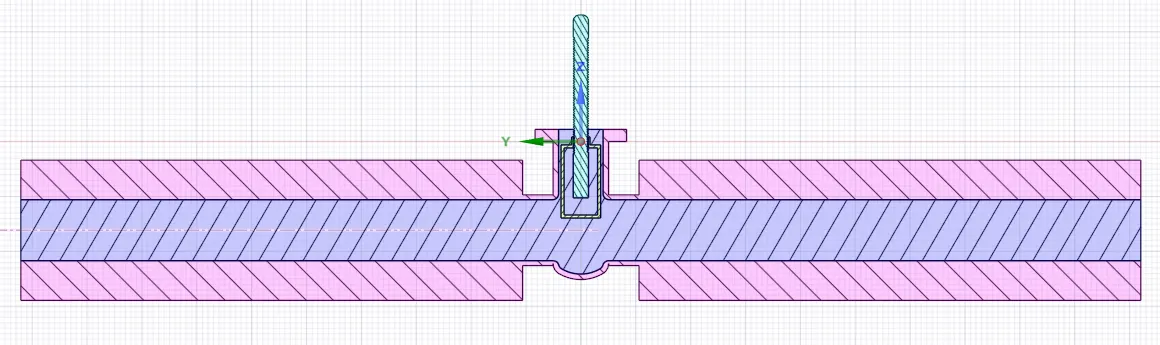
Velocity Contour Plot
Animation FIles:
https://drive.google.com/drive/u/1/folders/11emehpSxrgpxuqe7cneQUWsGUq5zdlfG
Conclusion:
(Jupiter-Python 3 code)
Note :the negative sign doesn't implies the flow rate is decreasing,this is because of sign conversion with x ,y and z axis of the geometry.i.e the inlet has +ve flow rate while outlet has -ve.
Plot 1)Outlet Flow v/s Lift
plot2 (Flow coefficient and Flow factor v/s lift)
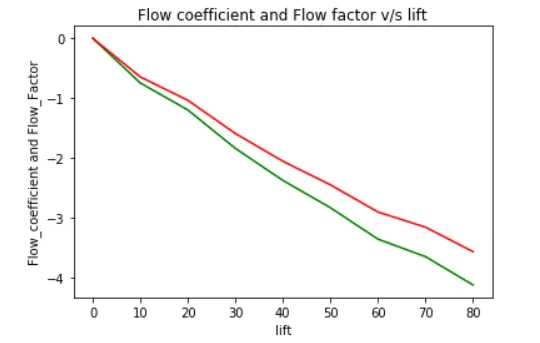
Plot 3:massflowrate v/s Flow coefficient
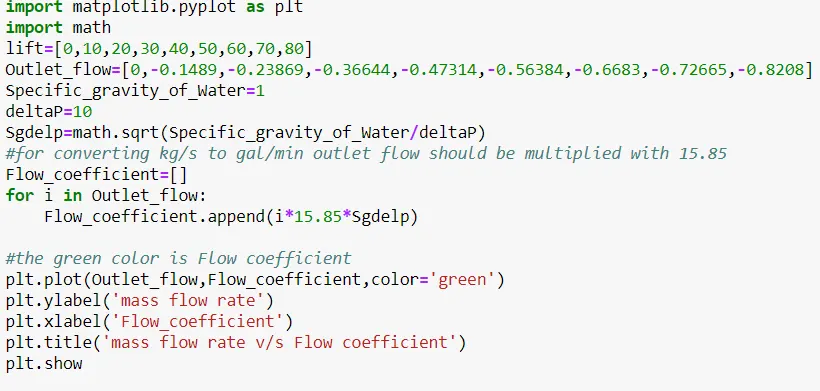
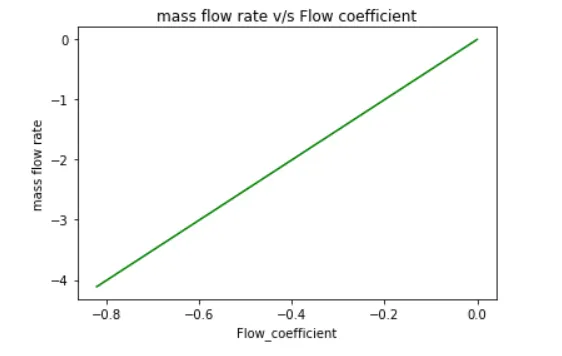
From the graphs we can conclude that:
- as the lift increases massflow rate increases
- Mass flow rate and flow coefficient are directlty proportional i.e they varies linearly
- Flow factor=0.865* Flow Coefficient
References:
https://www.sciencedirect.com/topics/engineering/gate-valve
https://en.wikipedia.org/wiki/Gate_valve
https://en.wikipedia.org/wiki/Flow_coefficient