FSAE Car Project
SIMPLE FORMULA CAR AERO PERFORMANCE SIMULATION
AIM:
To simulate the car for two different conditions and obtain the aero performance.
INTRODUCTION:
Formula car has different components, which are designed to produce and withstand high downforce levels. The body of the car generally creates a lift at high speed, and to overcome that, and to provide high grip levels, aero performance is analysed, where components such as front wing, rear wing are designed to provide additional downforce to the car to provide grip at high speed corners.
CASE SETUP:
Two conditions are simulated here.
1) The car encountering the turns with an average speed of 45 km/hr. Since the average speed is only given, and we need the velocity data of the car around the corner at 45 degree turns, simulating this condition with an average speed of 45 km/hr (Inlet boundary condition is assigned with a velocity of 45 km/hr) around the corner.
2) The speed of the car at the straights is 150 km/hr (Inlet boundary condition is assigned with a velocity of 150 km/hr)
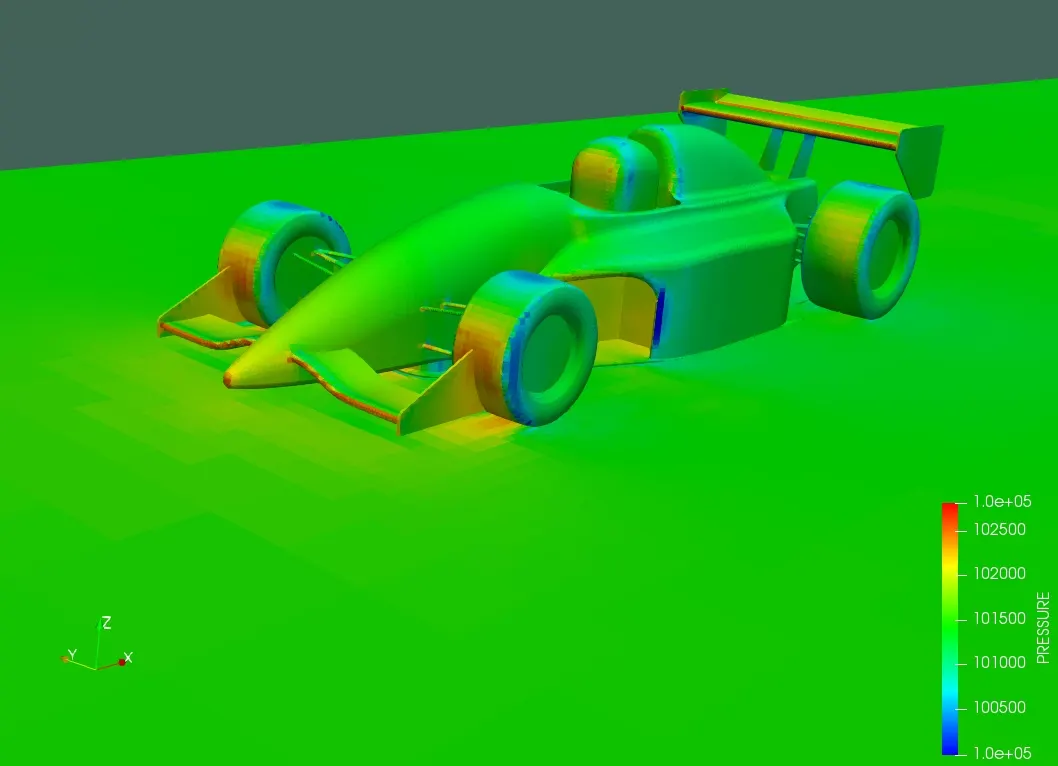
For both the situations, outlet boundary condition is assigned to atmospheric pressure (101325 Pa).
The sidewalls and top wall is assigned to symmetry boundary condition.
The downwall and the car is assigned as law of wall boundary condition.
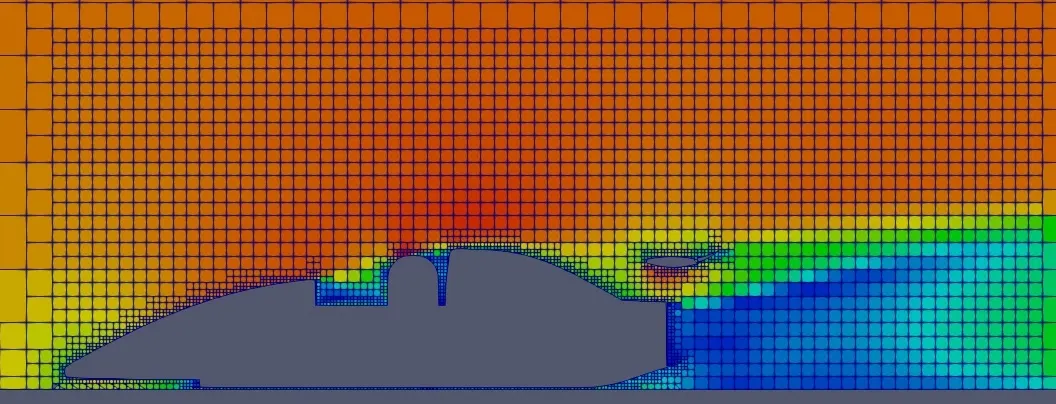
Base grid size: dx = dy = dz = 0.4 m.
Fixed embedding is given for each boundaries of the car (Front wing, Rear wing, Body, Front tyres, Rear tyre, Helmet, Underbody, front suspension , rear suspension) with a scale level of 5
Box type fixed embedding is given around the area of the car to capture the flow around the car with a scale size of 3.
AERO PERFORMANCE SIMULATION AND RESULTS:
Race 1 conditions: Cornering at average speed of 45 km/hr
The conditions are simulated using CONVERGE CFD , and the datas are obtained and processed in Matlab.
MESH VISUALISATION:
PRESSURE CONTOUR:
DRAG AND DOWNFORCE DISTRIBUTION:
A horizontal chart with the values of drag and downforce is attached.
DRAG DISTRIBUTION IN THE CAR:
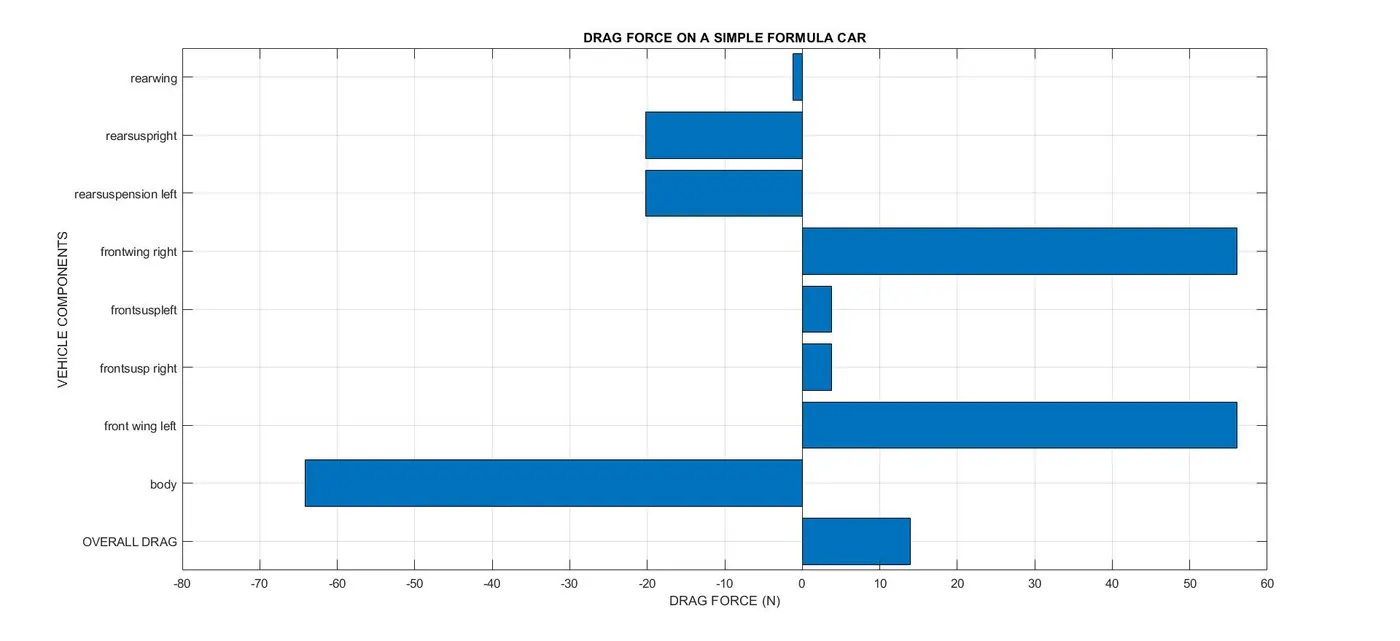
The overall drag force of the vehicle is around 15 N.
DOWNFORCE DISTRIBUTION IN THE CAR
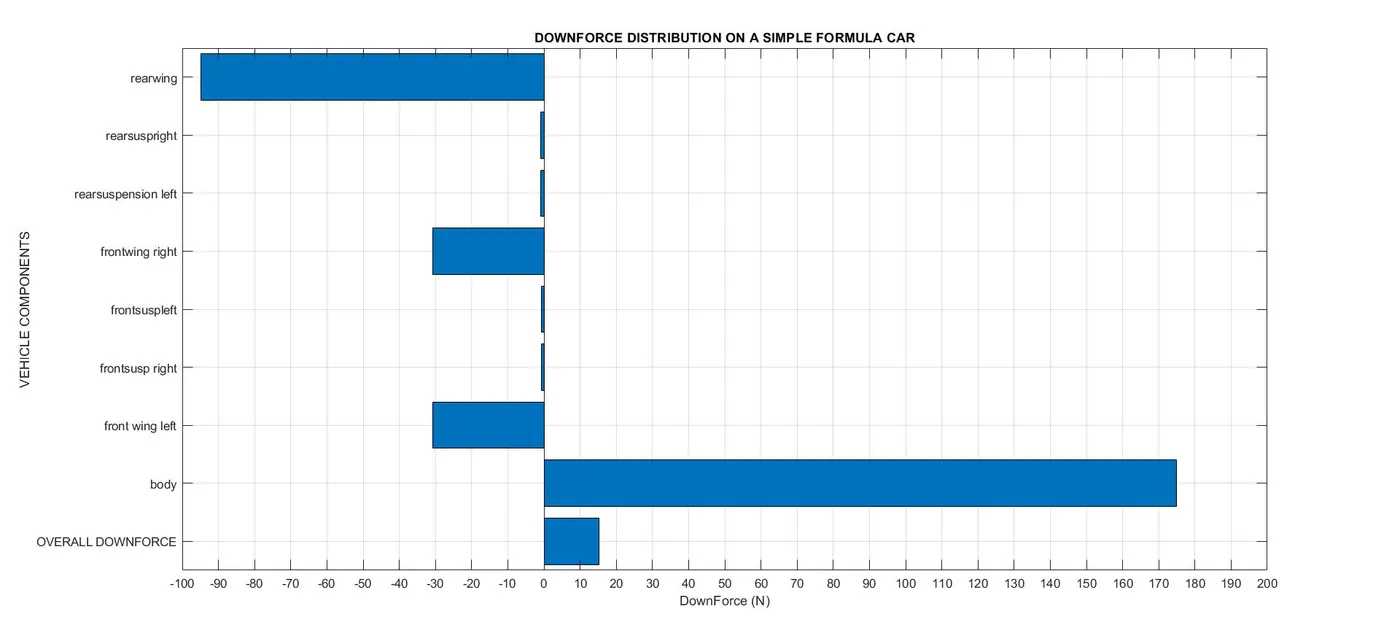
At low speeds, the overall downforce is positive, meaning it is creating a lift of 15 N. Modifying the diffuser angle and the rear suspension design, could contribute to additional downforce in the car, as the high diffuser angle is causing the flow to separate leading to detachment of flow from the diffuser.
RACE 2 CONDITIONS :
Straight line speed (150 km/hr)
The conditions are simulated using CONNVERGE CFD , and the datas are obtained and processed in Matlab.
MESH VISUALISATION:
PRESSURE CONTOUR:
VELOCITY CONTOUR:
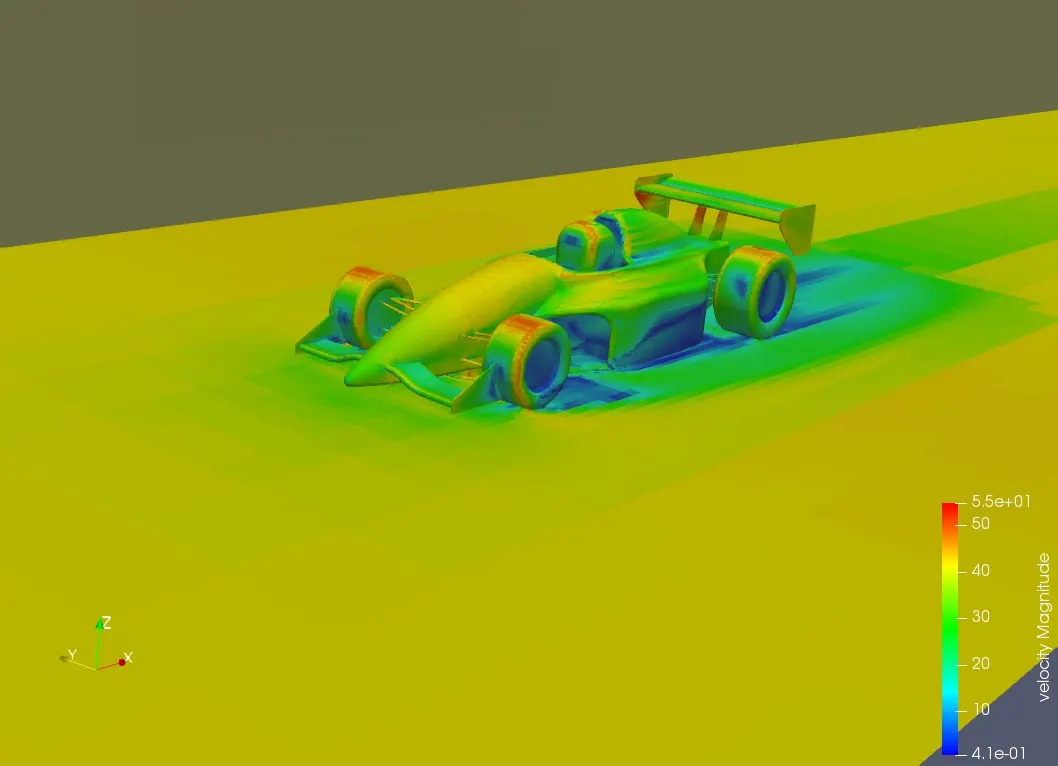
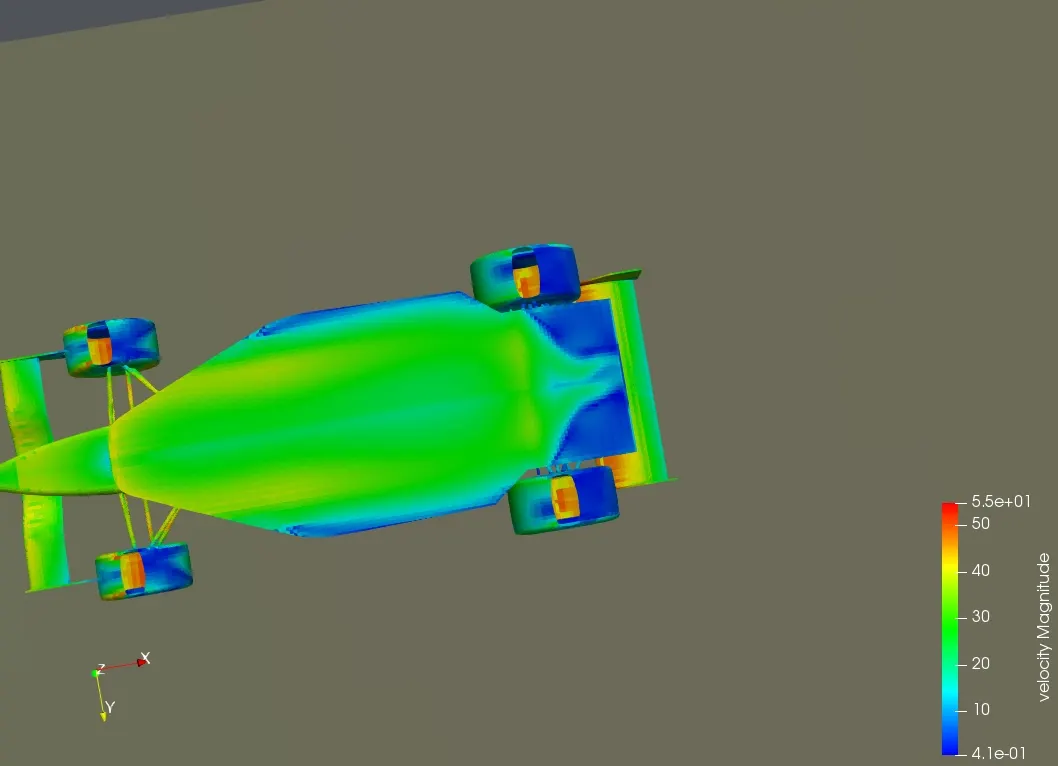
UNDERBODY VELOCITY DISTRIBUTION:
DRAG AND DOWNFORCE DISTRIBUTION IN THE CAR:
A horizontal chart with the values of drag and downforce is attached.
DRAG DISTRIBUTION:
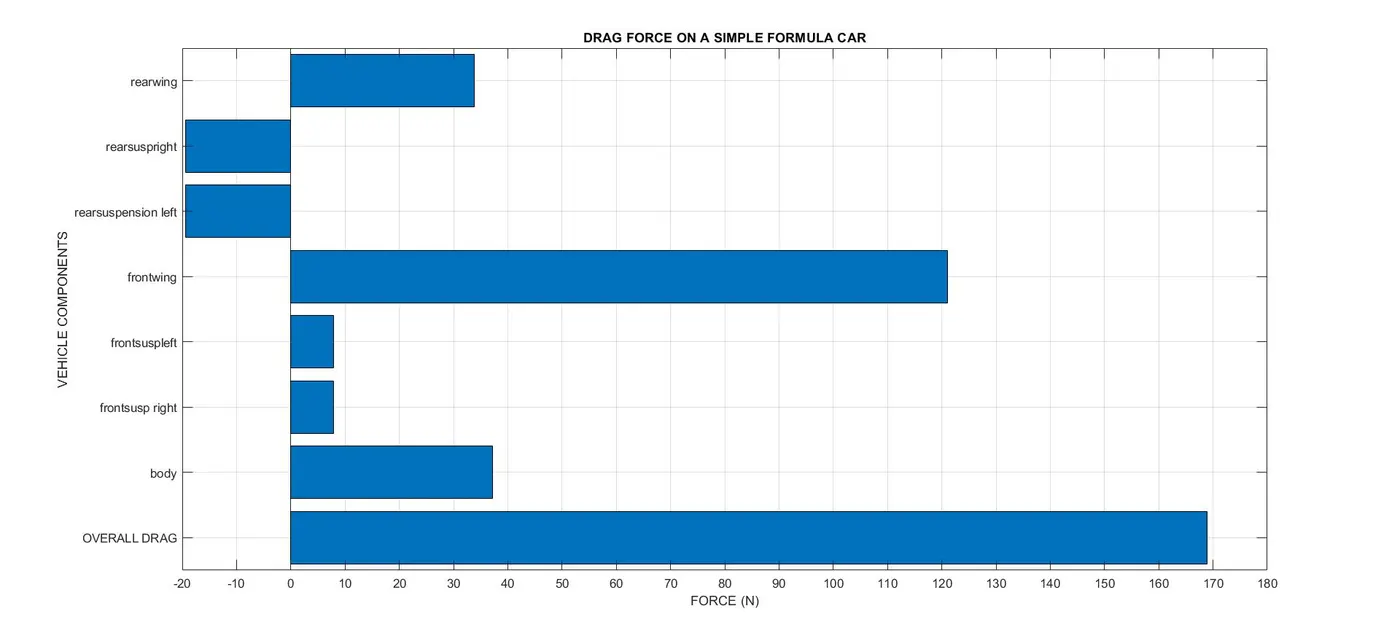
The overall drag force on the car is 169 N.
DOWNFORCE DISTRIBUTION:
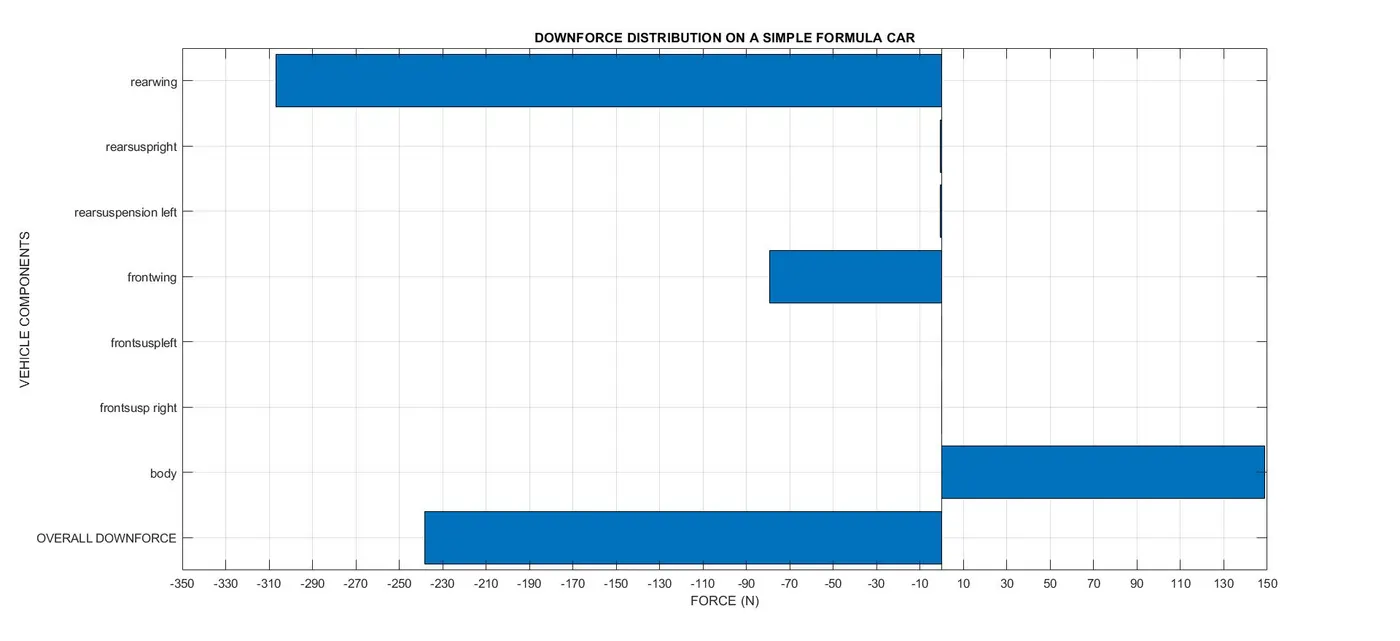
The overall downforce on the car is 238 N. The negative sign indicates the force is acting downwards and creating additional grip to the car.
CONCLUSION:
Thus the two conditions are simulated in Converge CFD, and the data is processed and visualised in a graphical way to easily understand the behaviour of the car. By visualising the graph, one could understand the aero performance of different components and could get an idea on the components which needs improvement, thereby increasing the overall aero performance of the car.