Project Steady state simulation of flow over a throttle body
STEADY STATE SIMULATION OF FLOW OVER A THROTTLE BODY
AIM:
To simulate flow over a throttle body by fixed embedding.
INTRODUCTION:
This simulation is done for visualising flow over the body, and how the velocity of the flow affects near the throttle body region, and to know what happens when a flow is obstructed by a body, such as throttle body.
Mesh: dx = 0.002m dy = 0.002m, dz = 0.002m
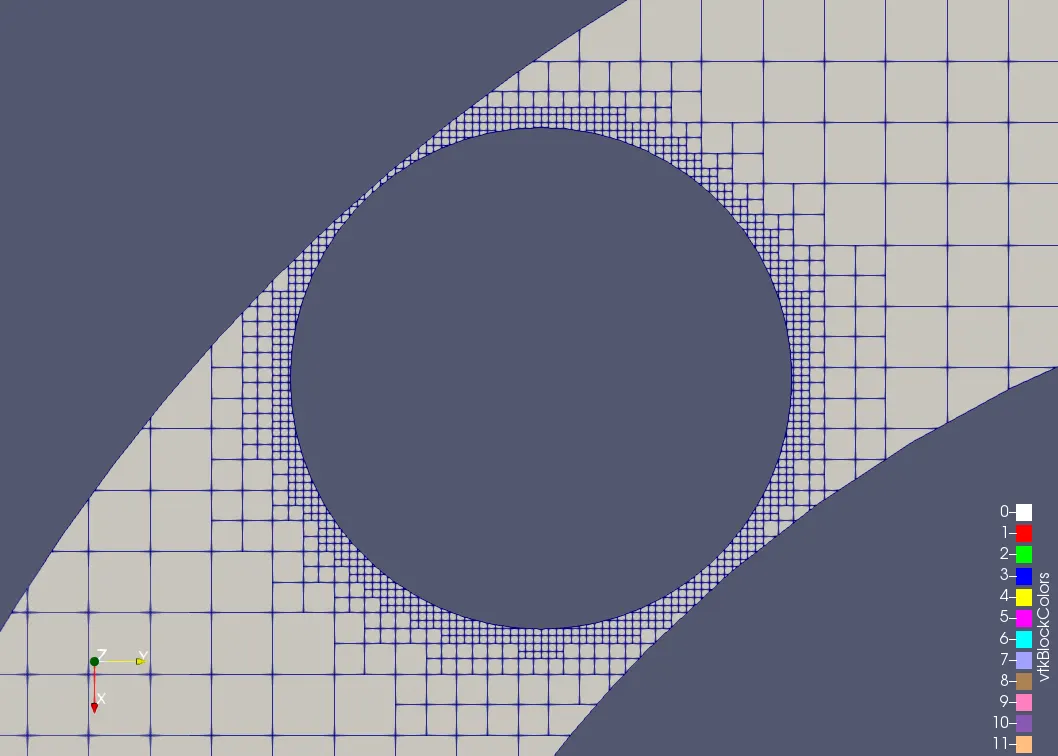
Fixed embedding : Embedding layers : 2, scale 3
CASE SETUP:
The inlet boundary condition is given as pressure with a value of 150000 Pa.
The outlet boundary condition is given as pressure with a value of 100000 Pa.
The boundary condition for throttle body and the hose is given as wall. For this simulation, the throttle body is kept at zero degree and flow is simulated over the body.
MESH SURFACE:
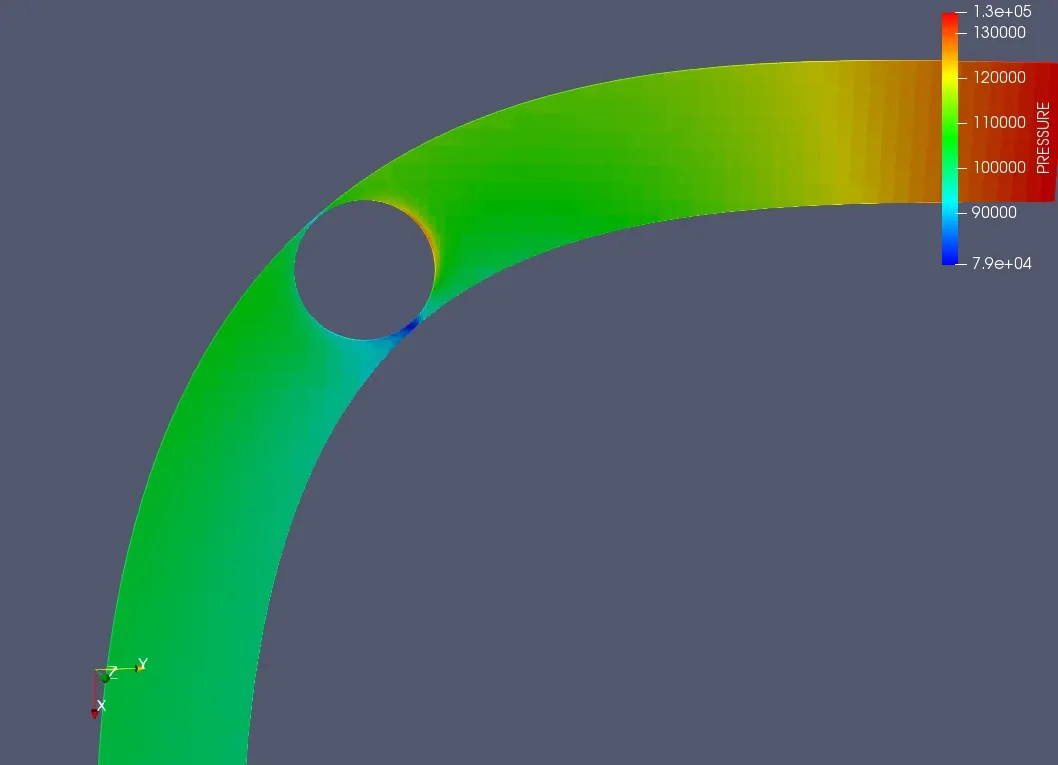
PRESSURE CONTOUR:
VELOCITY CONTOUR:
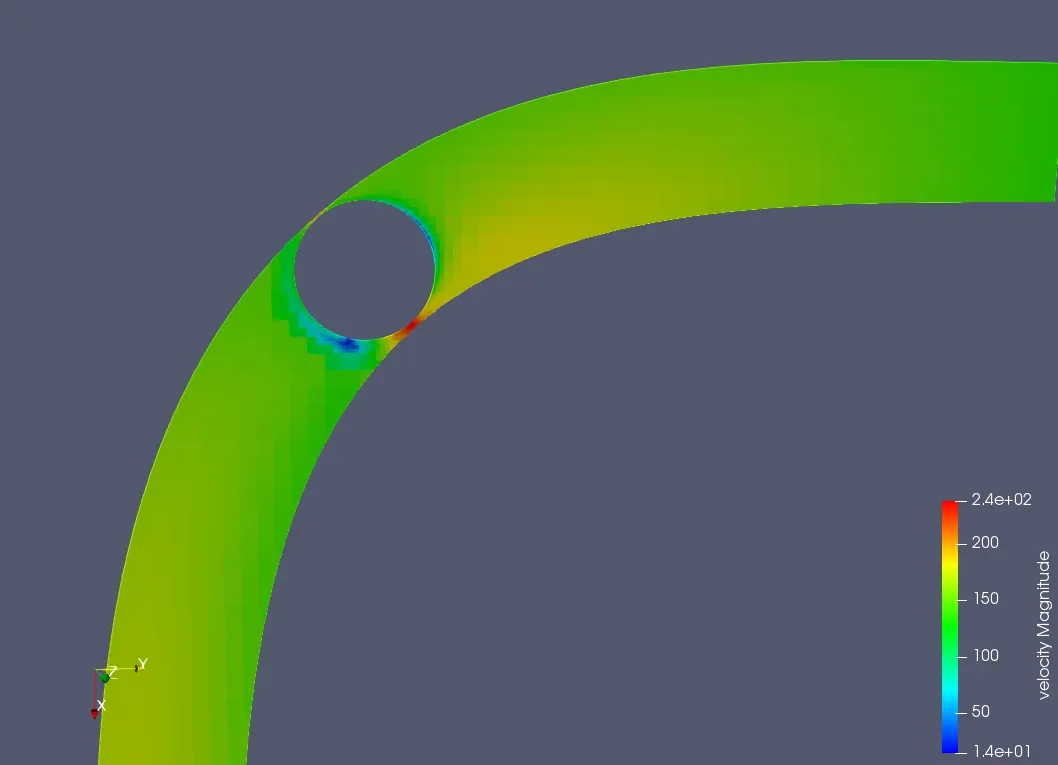
The velocity plot shows the red region under the throttle body which indicates high velocity. Since there is no shaft placed for the throttle body, there is a gap in the area, and since the area is small the velocity increases, leading to pressure drop.
PLOTS:
PRESSURE PLOT (INLET):
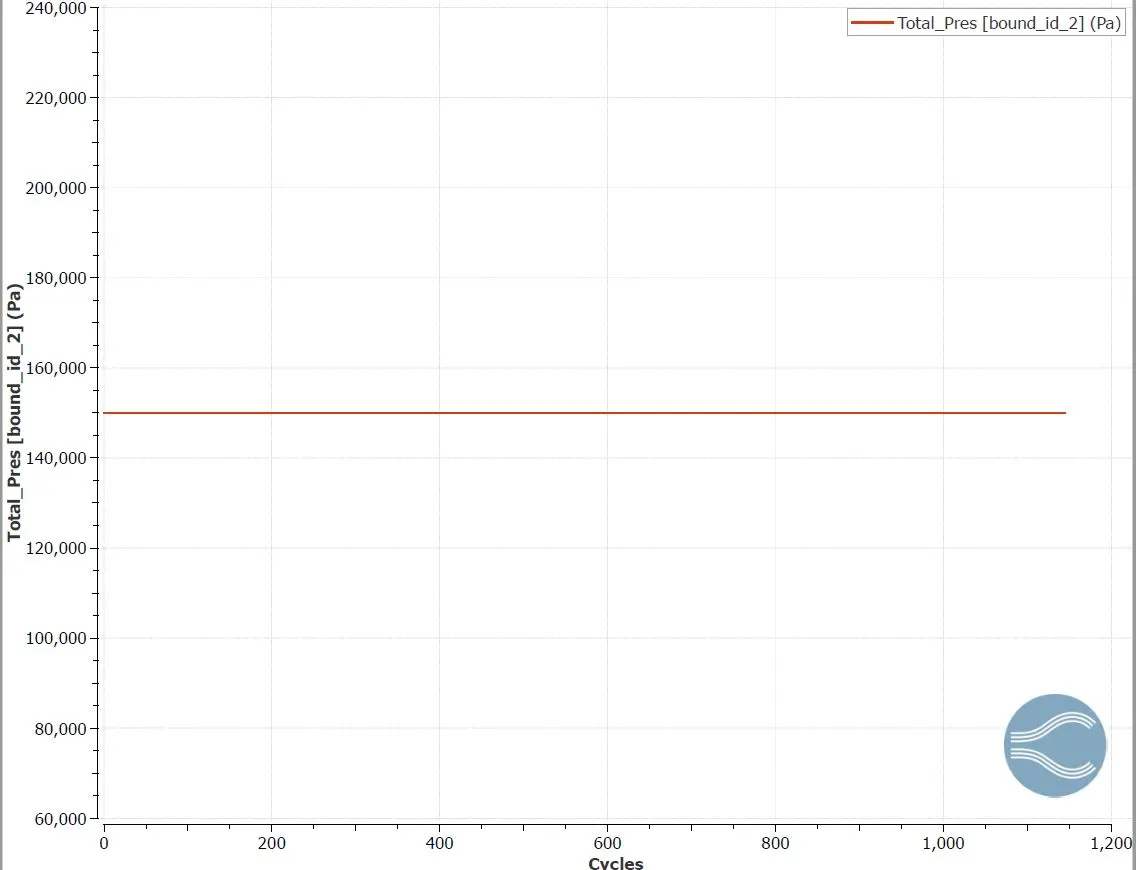
The pressure indicates the initial condition which is given, since this is measured at the inlet.
PRESSURE PLOT (OUTLET):
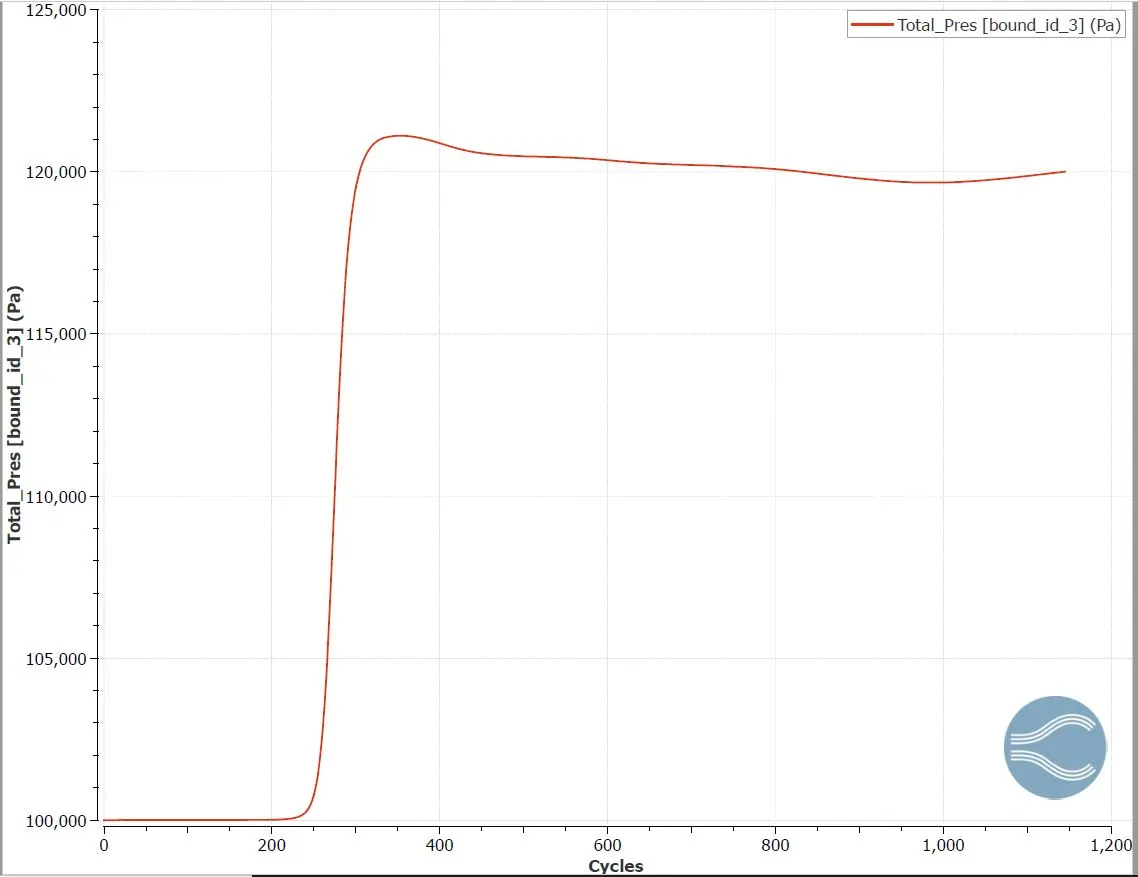
The total pressure indicates the static pressure and the dynamic pressure measured at the outlet.
VELOCITY PLOT (INLET) :
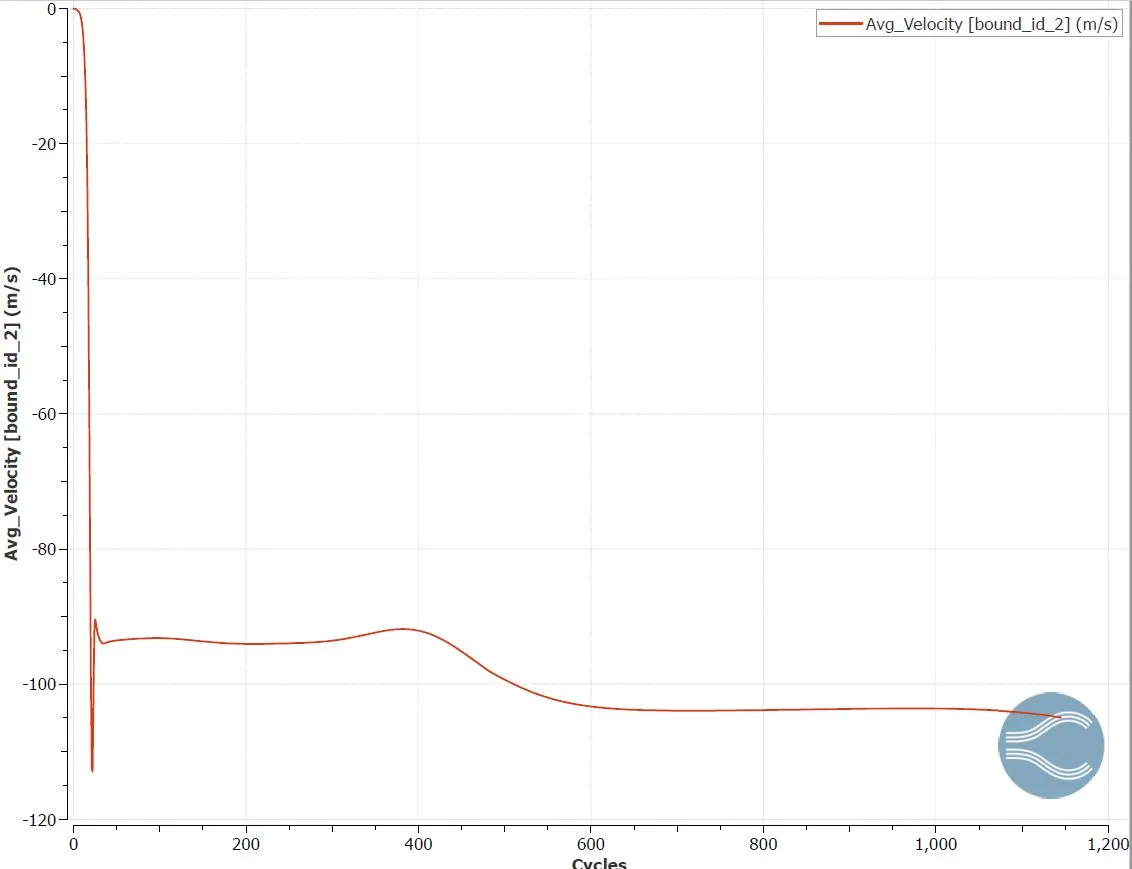
The velocity plot indicates the average velocity measured at the inlet.
VELOCITY PLOT (OUTLET) :
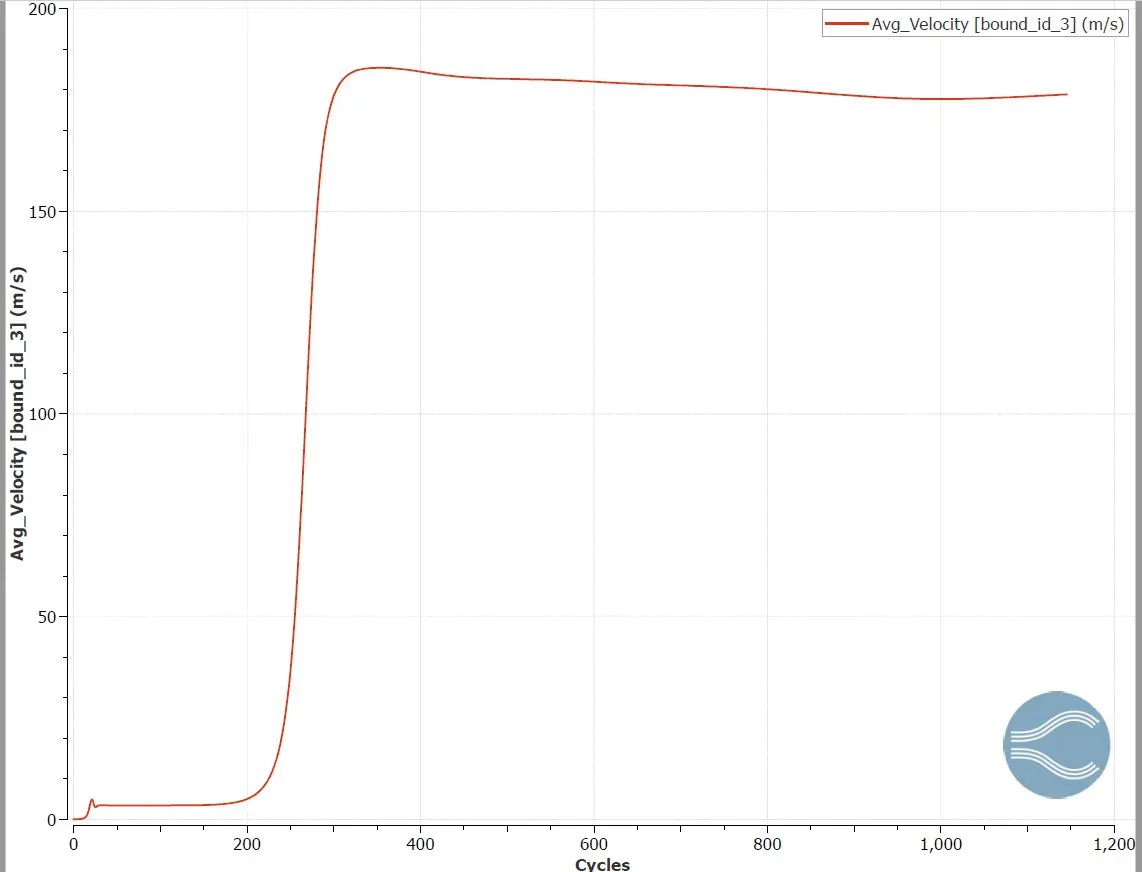
The velocity plot indicates the average velocity measured at the outlet, and this velocity is created due to the pressure difference of 50000 Pa between the inlet and outlet.
MASS FLOW RATE (INLET) :
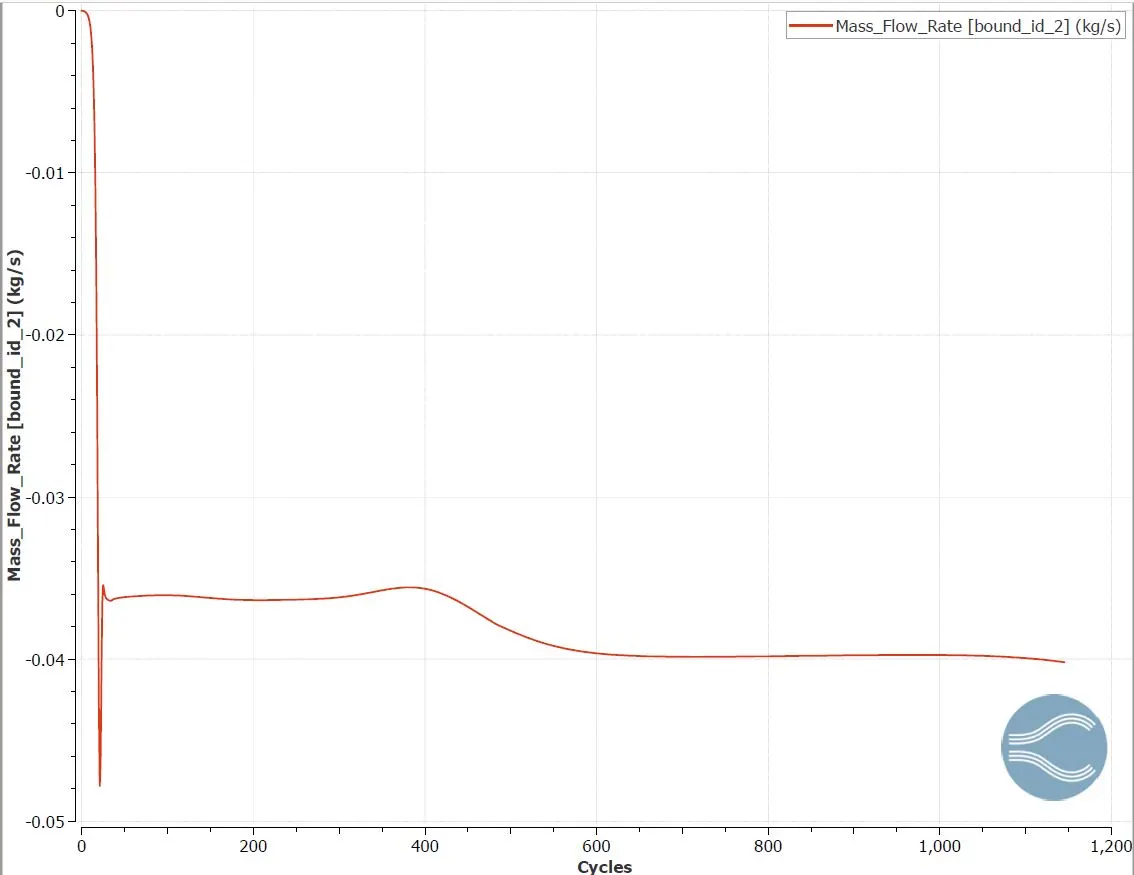
This indicates the mass flow rate from inlet which has converged to approximately -0.04 kg/s.
MASS FLOW RATE (OUTLET) :
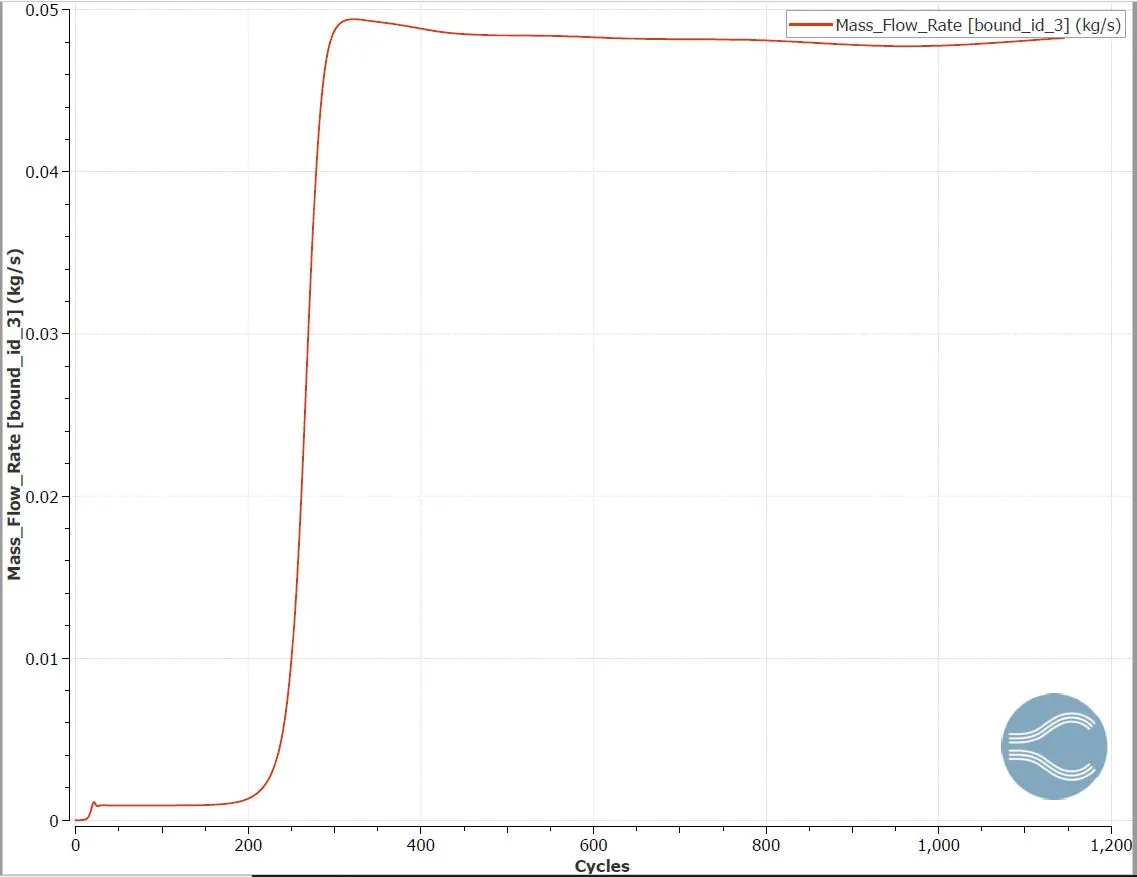
This indicates the mass flow rate measured at the outlet which has converged to approximately 0.048 kg/s.
TOTAL CELL COUNT:
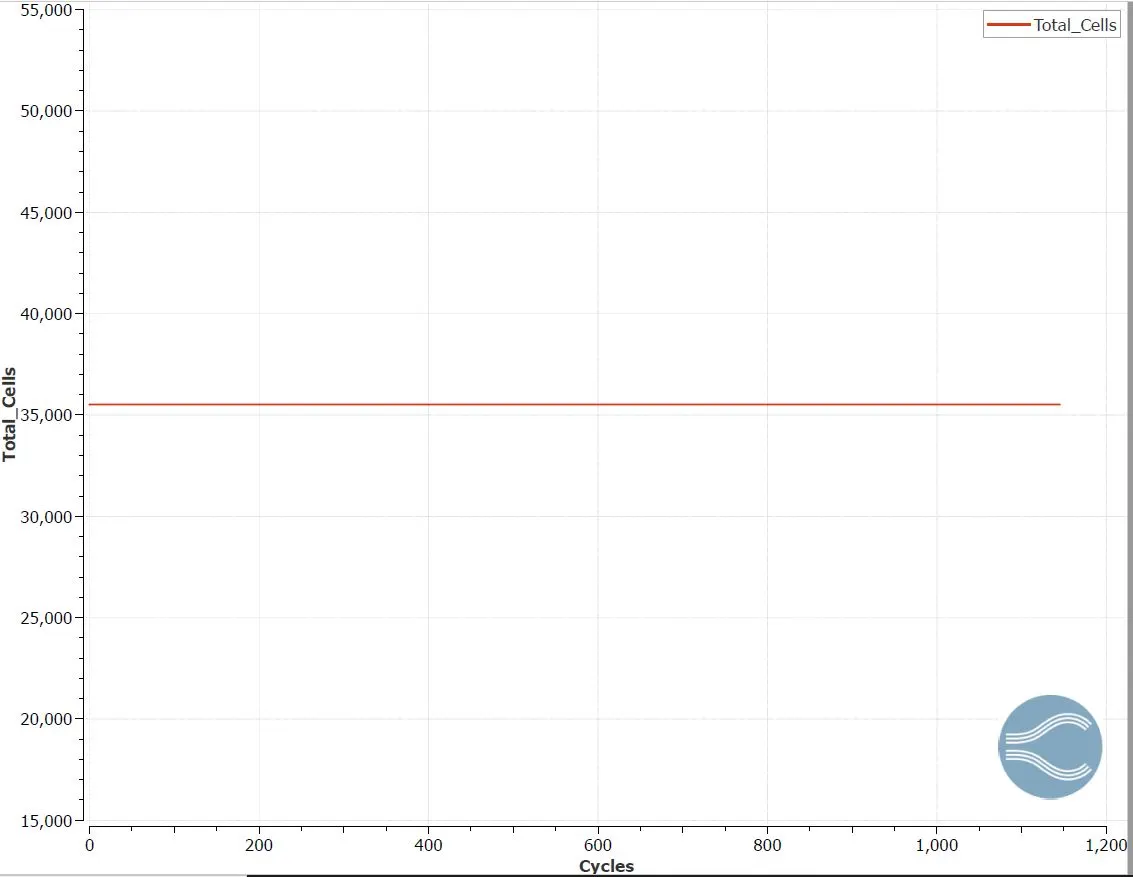
The total cell count for this simulation is around 35500.
CONCLUSION:
This simulation is done to understand the flow behaviour when it is obstructed by a body such as throttle body. This simulation also shows the flow over reduced area , which increases the velocity over the area and hence reduced pressure.