Flow Over Bicycle
AIM :
To Calculate the Drag Force (Fd) experienced by cyclist while travelling L.H.S to R.H.S at particular Velocity (v) using MATLAB program.
GOVERNING EQUATION :
`F_D=1/2 ρv^2 AC_D`
Where,
`F_D` = Drag force,N
`ρ` = density of fluid on which object is resisting ,Kg/
A = Frontal area of object (front view ofcyclist along with bicycle),
v = velocity of bicycle travelling forward,m/s
`C_(D )=` The Drag Co-efficient, non-dimensional
Objectives
- As cyclist is moving L.H.S to R.H.S he/she is experiencing Drag force,i.e Cylist has to overcome windforce while driving.calculate the drag force as following.
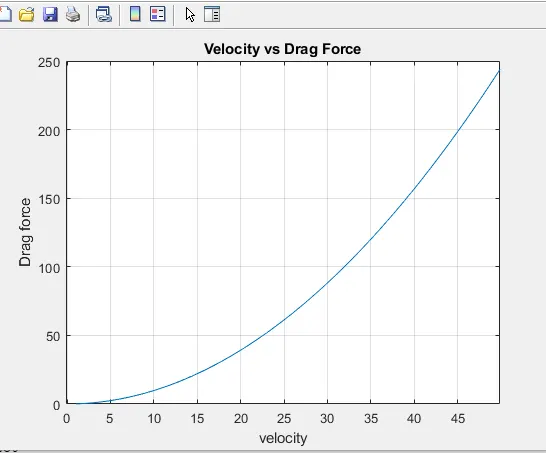
1)To write a program to plot Velocity vs Drag Force.(taking Drag C Constant)
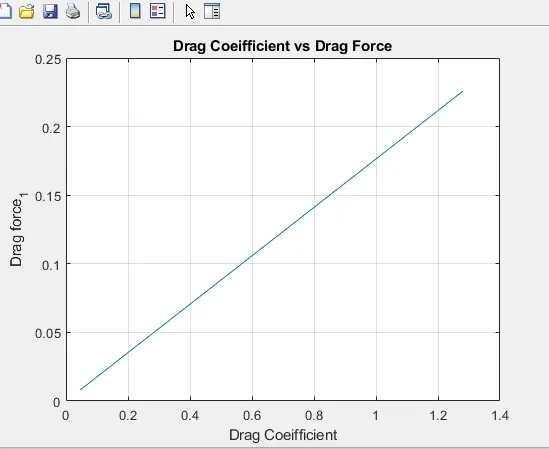
2)To write program to plot Drag Co-efficient vs Drag Force.(taking velocity as Constant)
ASSUMED INPUT DATA :
1.Frontal area of cyclist is constant i.e(0.2)
2.Density of fluid against which body is resisting is taken as 1.225 kg/
3. Taking different Drag coefficient (m/s) as follow for constant velocity of 1.2 (m/s)
C_D_diff = [ 0.8 1.28 1.14 0.045 0.295 ]
Matlab program :
clear all
close all
clc

 % Task_1

% Inputs
% Drag coefficient
c_d = 0.8;

%Area m^2
A = 0.2;

%Density  kg/m^3
 rho = 1.225;


% velocity m/s
v = [1:50];


%Drag Force for particular Drag co-efficient at varrying velocities

drag_force = rho*A*v.^2*c_d*0.5;

%plot between Velocity and Drag Force
plot(v,drag_force)
title('Velocity vs Drag Force')
xlabel('velocity')
ylabel('Drag force')
grid on;


% Task_2

% Inputs
% Drag coefficient
c_d = 0.8

%Area m^2
A = 0.2

%Density  kg/m^3
rho = 1.225
% taking constant velocity for varrying Drag Coefficient (m/s)
V=1.2;

%Drag Force for particular Velocity at different Drag Coefficient
C_D_diff=[ 0.8 1.28 1.14 0.045 0.295 ];

drag_force_1= rho*A*V.^2*C_D_diff*0.5;

% plot between Drag Force and Drag Coeifficient

plot(C_D_diff,drag_force_1)
title('Drag Coeifficient vs Drag Force')
xlabel('Drag Coeifficient')
ylabel('Drag force_1')
grid on;
Result : Task_1 figure for Velocity vs Drag force
Task_2 figure for Drag coeifficient vs Drag force
Conclusion :
- From Result 1(graph 1)we see that , so it follows parabolic path
- From Result 2(graph 2)we see that so it follows straight line.
- Drag force is directly proportional to frontal area ,