Exhaust Port Challenge
EXHAUST PORT SIMULATION
Aim
To analyse Conjugate Heat Tranfer through an Exhaust Manifold
Inroduction
The term conjugate heat transfer (CHT) is used to describe processes which involve variations of temperature within solids and fluids. The exchange of thermal energy between the two physical bodies is called study of Heat Transfer, the rate of transferred heat is directly proportional to the temperature difference between the bodies.From this experiment we are ought to find the wall/surface heat transfer coefficient on the internal solid surface and visualise the velocity and temperature contours
Theory
Conjugate heat transfer corresponds with the combination of heat transfer in solids and heat transfer in fluids. In solids, conduction often dominates whereas in fluids, convection usually dominates. Efficiently combining heat transfer in fluids and solids is the key to designing effective coolers, heaters, or heat exchangers. Forced convection is the most common way to achieve high heat transfer rate. In some applications, the performances are further improved by combining convection with phase change (for example liquid water to vapor phase change).
Heat transfer in solids and heat transfer in fluids are combined in the majority of applications. This is because fluids flow around solids or between solid walls, and because solids are usually immersed in a fluid.
Solving and Modelling approach
The Modelling approach is divided into 2 cases first the base line mesh and the coarse mesh.
First we need to Repair the model then Use volume Extract to extract the Volume of the exhaust,taking to two different volumes called fluid volume and solid volume.
Meshing should be Non conformal mesh as solid and fluid volume are two parts
Geometry:
inlet
outlet
Wall
Fluent settings was set to 150 iteration with time scale factor 1.
method is hybrid and Steady state with energy equation turned on.along with pressure based Solver
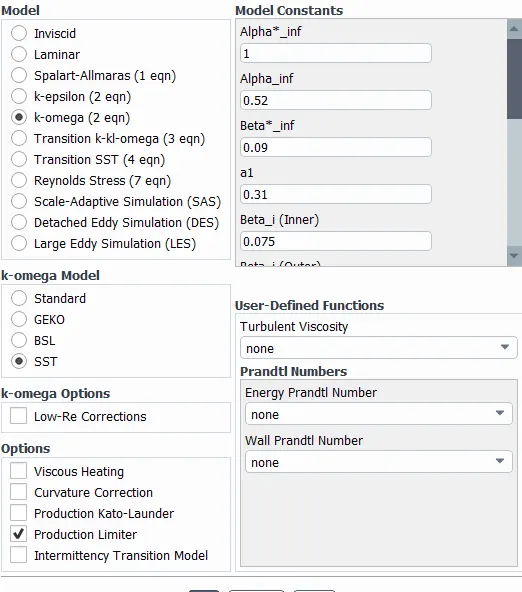
The Turbulence model is changed to k-omega SST as it is best and designed to be applied throughout the boundary layer.k-omega SST uses near-Wall model approach
From law of the wall we can see y plus ranges for different layers,As for k-omega Turbulence model the y plus should be between 0-5 while as for k-epsilon it should be at 30-300 range
as it is a log-log plot the curve line is in linear variation while the straigh line is logarithmic.
Solver Setting
Boundary conditions
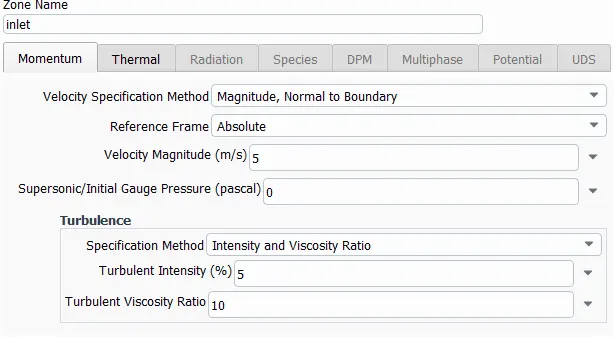
Inlet velocity as 5 m/s with 700k as inlet temperature.
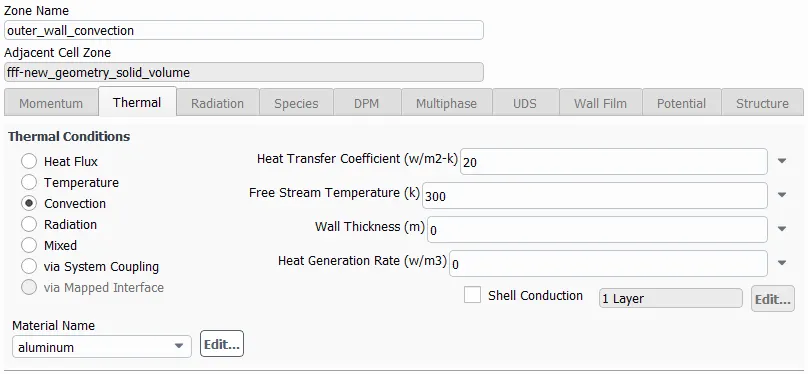
For wall the heat transfer Coefficient is 20 w/m2-k with convection as thermal condition
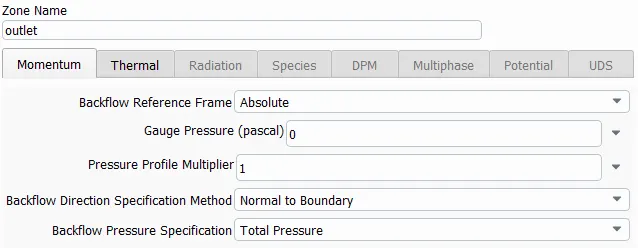
oulet condition as guage pressure Zero
Material properties:
Fluid as Air and Solid part as Aluminium
Case 1,
Base line mesh with element size 0.15m with no inflation layer also with 138k elements
Residuals of base line mesh
Temperature contour plot
velocity plane plot
Temperature plane plot
Wall heat tranfer coefficient plot
Stream line flow
As the base line mesh doesn't have infation layer catching the wall heat transfer coefficient will not be accurate.So inorder to catch the phenomenons near the wall condition the best choice is to construct an inflation layer and Use k-omega SST turbulance model.Combination of these along with proper y plus value we can get near to the experimental value.
case 2:
Refined mesh with Inflation layer
The refined mesh with element size 0.2m altogether with inflation layer determined by hand calculating y plus value as 0.00026m.The refined mesh has 444k elements.Further details are shown below.
Inflation layer(0.00027m)
Residual plot
From defenitions Area-Weighted Average is choosed alon with the wall fluxes inorder to find Wall adjacent heat transfer.
Wall Heat transfer coefficient =1390.3215 w/m-2k
temperature contour
Y plus range is found between 0 to 5 implies the wall has maintaned the Yplus.Indicating our hand calaculation was almost correct and we don't need to remesh again,This range is suitable for K-omega SST.
Stream line plot
Velocity contour Plot (velocity outlet 25.2178m/s)
Wall adjacent temperature plot (temperature outlet 682.0686k)
Wall Heat transfer Coefficient plot(Wall Adjacenth Heat trasfer coefficient=1385.325 w/m2k)
Pressure Plot
To verify the simulations are correct we need to hand calculate the thermal or heat tranfer coefficient.
as from formula of nusselt number Nu=hl/k where h is heat transfer coefficient, l be the length and K the thermal conductivity of the material.
So inorder to find h i.e heat transfer coefficient we need to find nusselt number.This can be done Using Dittus-Boelter Equation.
The equation is as follows:
Nu=0.023*(Reynolds number^(4/5))*(pr^n)
Where Nu is nusslet number, pr s prandtl number and n is 0.4 if he fluid is heated or 0.3 when the fluid is cooled off
from these two equations we can find the heat transfer coeficient and check whether our simulation is correct or not.
The experimental calculation of the exhaust pipe will be 980 w/m2k while for the simulated model we achieved 1385 w/m2k.
the simulations are not accurate we try to reach the range.The Accuracy of Predictions Depends on several factors like:
Clean geometry:removing interferences and open edges are one amoung the top priority
refinning mesh: The finer the mesh the closer the simulated value gets to experimental value.
Solver type:Choosing correct solver
Viscous model:Choosing the correct turbulance model for example k-omega SST is chosen over k-epsilon because it can catch Boundary phenomenons better than k -epsilon.
Y plus value:the y plus range should be according to the visous model the user choose
other factors like convegance, Number of iterations,Boundary conditions etc.
Conclusion
From the base line mesh which doesn't have inflation layer and from the Refined mesh we can conclude that The model with inflation layer can trap better wall adjacent values and conditions.Also means that inflation layer is needed to capture near wall phenomenons.
As a fact we know that finer the mesh accurate the values are.The viscous models and solvers should be chosen according to the requirements.A good understanding of solvers and models are needed for CHT analysis.
Y plus values should be maintained depending on the solvers.
Comparing the contours of temperature between the base line mesh and refined mesh we have seen that temperature is more accurate in refined.