Channel Flow Simulation using Converge
Introduction
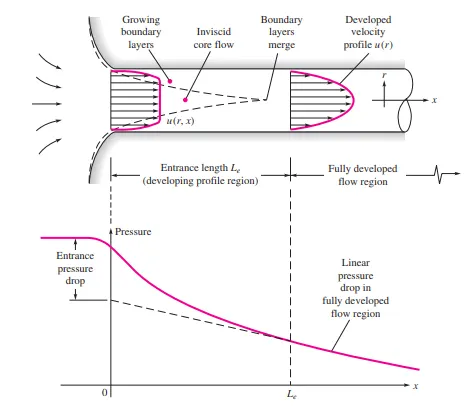
Channel flow is a very basic problem in biofluid dynamics. The solution for this problem is necessary to simulate blood flow in the human body, for example, in the heart or in veins. Here we are mainly constrained by the bounding ewalls with no slip condition and the viscous effects will grow and meet and permeate the entire flow. This report is a short study on grid independency test on an internal flow in a long duct. There is a entrance region which is nearly inviscid upstream flow converges and enters the tube. Viscous boundary layers growes downstream, retarding the axial flow at the wall and thereby accelerating the centre core flow to maintain an incompressible continuity requirement.
At a finite distance from the entrance, the layers merge and the inviscid core disappears. The tube flow is entirely viscous and the axial velocity adjusts slightly further until at it no longer changes with x and is said to be fully developed. only. In the downstyream, velocity p[rofile is constant and the wall shear is constant and the pressure drop linearly with x, for either laminar or turbulent flow.
In this project, a flow through a channel has been set up by Converge 3.0.15 software. The case is set up and the channel flow is simulated by a command-line interface CYGWIN. A steady state simulation is performed and the primary objective is the grid independenct test.
Geometry is made by collection of triangular shaped bodies. Here the 2D symmetry is the main concern and not on 3D because of similarity. The dimensions are 0.1x0.01x0.01 along x, y and z directions.
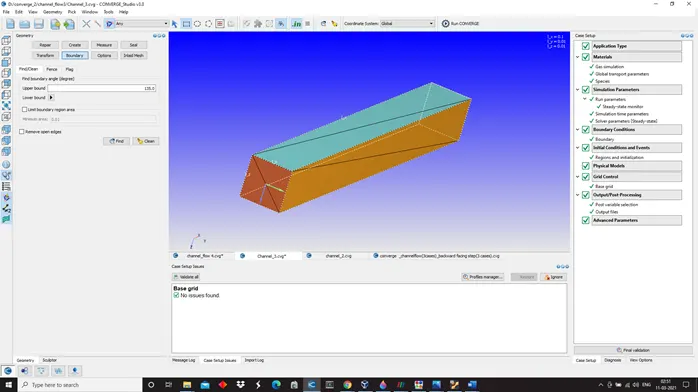
Case Setup:

A time based simulation was performed
- Boundary conditions
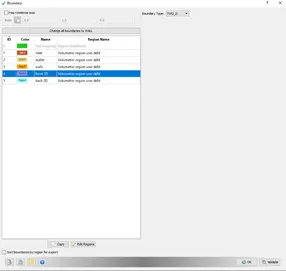
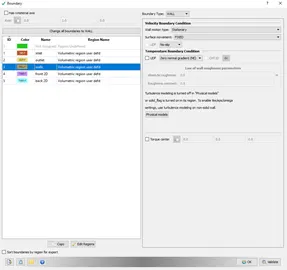
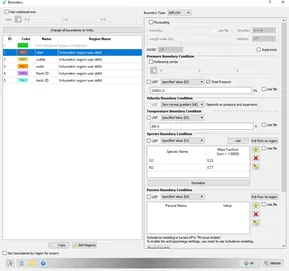
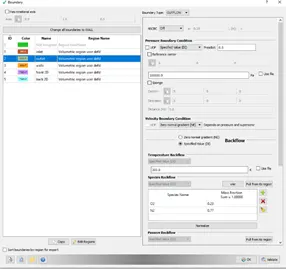
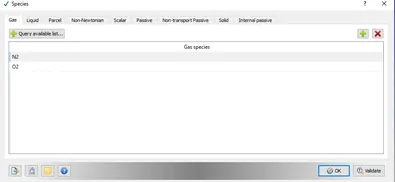
- Initial conditions: Species-N2(mass fraction- 0.23and O2.(mass fracvtion-0.77) are made to enter the channel domain.

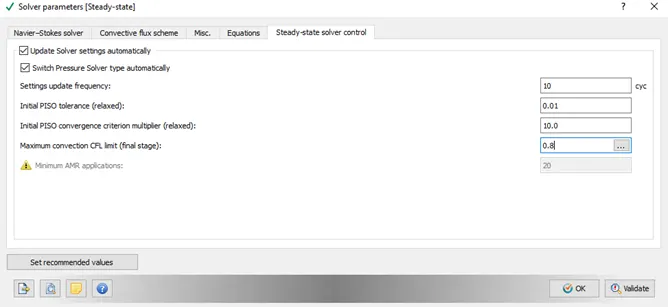
- Simulation and Run parameters
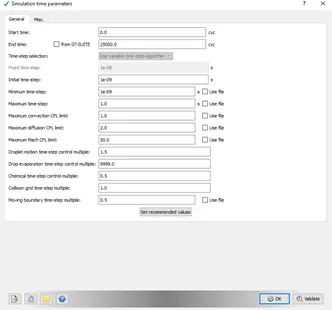
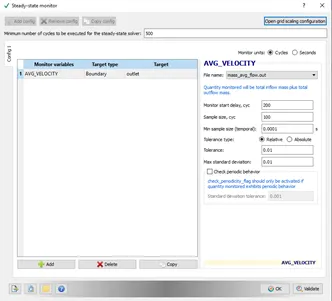
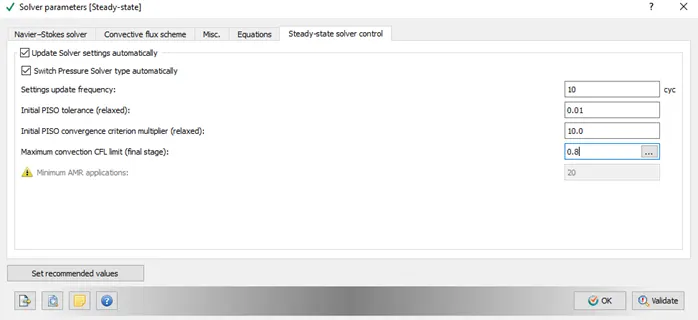
The present hydrodynamic simulation is performed with a steady state solver which non depending on the process path and initial conditions, it will reach steady state and will give somehow tangible results if the geometry and all the other parameters in case-setup is fine. The N-S is set to PISO algorithm which is known to simulate unsteady state problems but also comes in handy with steady states. It uses predictor corrector method in pressure calculation. The simulation is ran for 25000 secs. It is controlled by a steady state solver monitoring at the exit. The steady state monitor starts function at 100 time intervals each and once the avg flow parameter attains steady state the simulation stops.
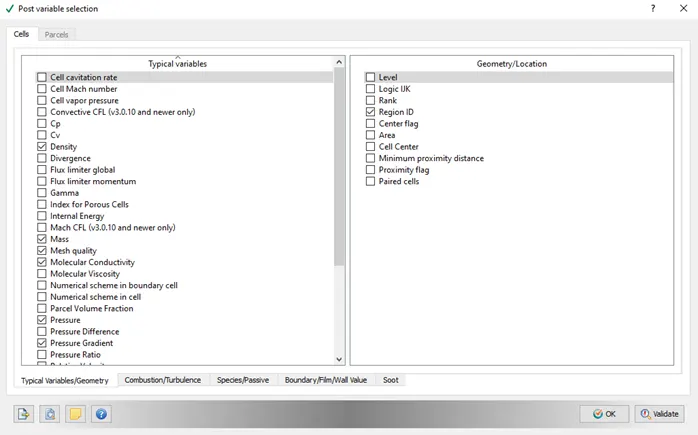
- Post Process data run variables are exported to the post processing which is either by graphical user interface( through Converge itself) or through CYGWIN.The post run data variablers are mass flow rate, masss fracrtion, pressure, temperature and many other average flow fields. The time interval of 3D outputs are generated after every 100 cycles. Thev time intrerval ofd the rfestart files is same as that of the output.
- Export of data files : Once the setup is done the input filers are post converted to a new folder called output inside the folder of the challenge name
A command line editor tool like CYGWin is used to run the simulation. For faster computational speed 4 parallel processors are used(INTEL MPI).
Post Processing in PARAVIEW
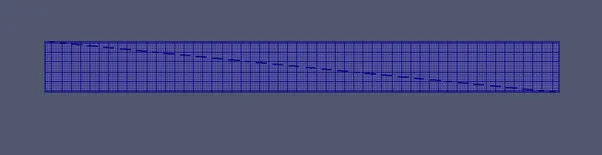
Case 1 : Mesh Size ~1e-3

Case 2: Mesh Size~3e-4
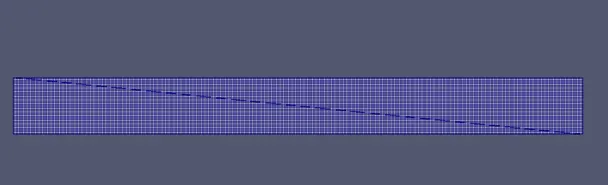
Case 3 : Mesh Size ~4e-4
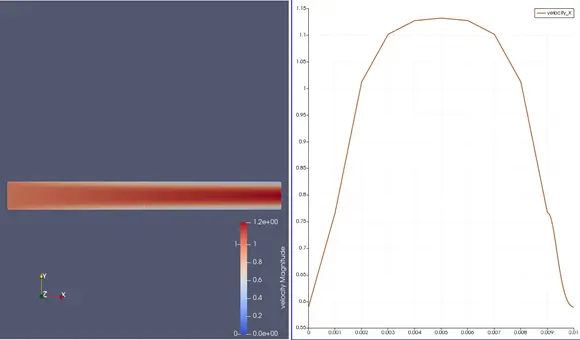
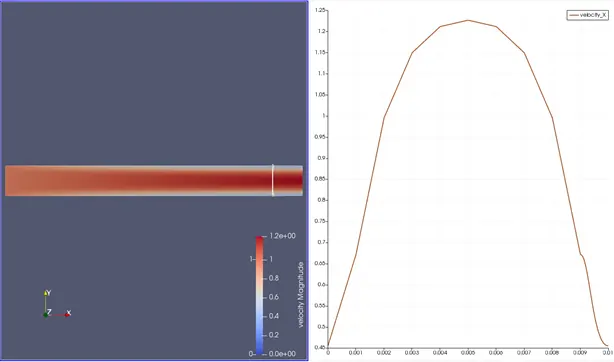
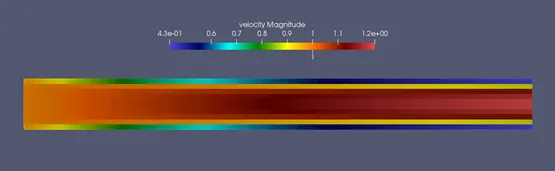
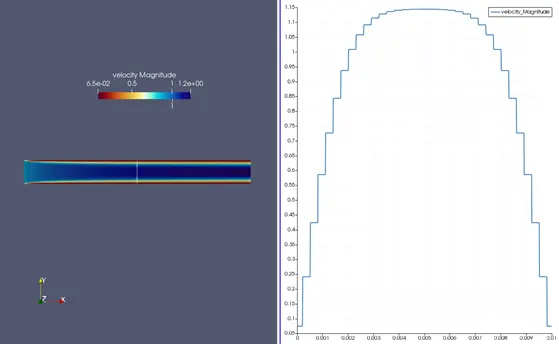
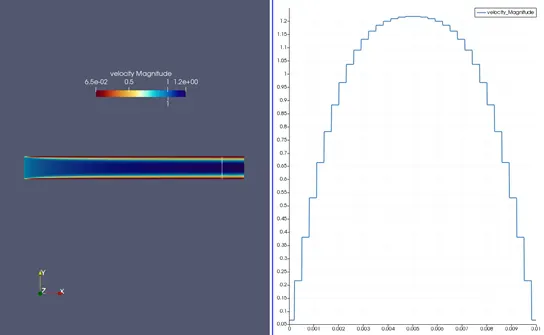
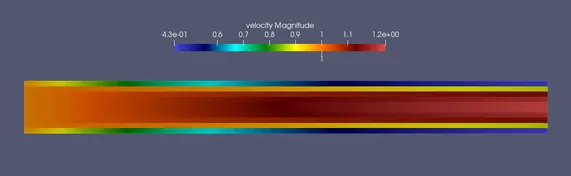
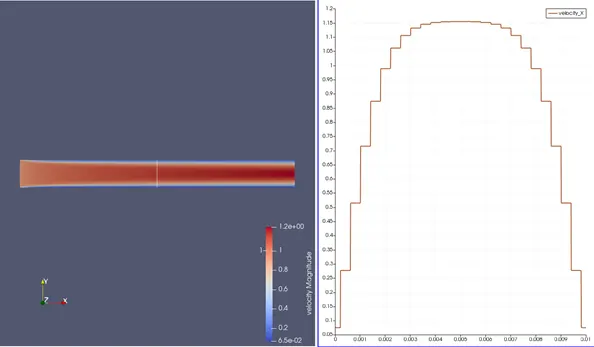
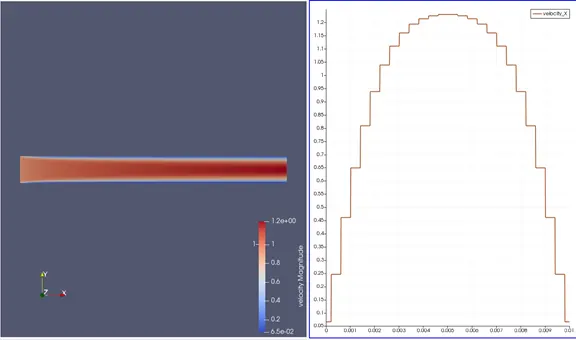
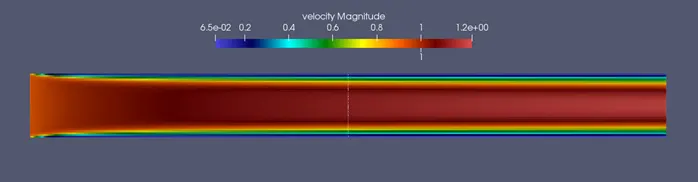
- Velocity contour with profile for a probe set at (a) x =0.05m. (b) x =0.09m (c) velocity at the last time step
From the mesh independency study, we can see the velocity range matches for the 2nd and 3rd case. So the mesh is independent and solution may have converged. The paraboloid velocity profile has an average velocity v which is one half of the maximum velocity. The Hagen Poisueille eq and the head loss calculatiopn as describerd in introduction comes into play or is valid whenever the pipes Reynolds Number is less than about 2300. The velocity profile is parabolic as we can see at botyh the axial distances and from the velocity contour we can tell at the wall region due to no-slip condityion , the velocity is the lowest and gradually as we mobve up the radial distance the velocity increases and in the fully developed flow the velocity is maximum at the 0 radial distance as per the y axis i.e at the mid way of the normal to the flow.
- Case1
(a)
(b)
(c)
- Case 2
(a)
(b)
(c)
- Case 3
(a)
(b)
(c)
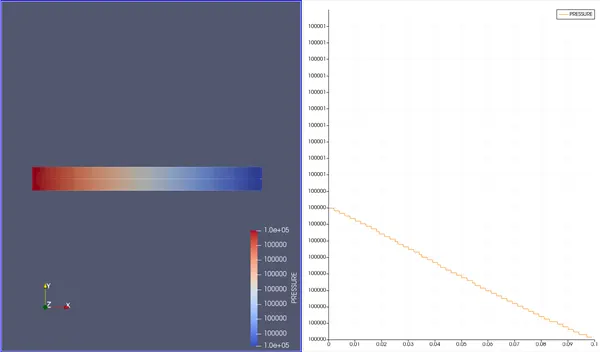
- Pressure Contour on X axis cut through the gerometry from x=0 to x=0.1
As we can see from the pressure profile along the whole domain pfv the pipe, pressure is not varying much and remains constant. This is because there are no major losses or minor losses. It is a siomple circular pipe where the flow gets fully developed at an entrance length of (in case of laminar flow) and entrance length of 10D for turbulent. Here the flow is fully developed laminar flow with no losses such as entrance loss,fittings loss, losses due to bends and more for which the pressure drop is 0. Due to the entrance there must be a pressure drop but it gradually decreases and attains constant value if there no such bends or fittings of converging/ diverging exit area, Actually the pressure drop is linear in the fully developed zone as we can see from the resuklt
- Case 1
- Case 2
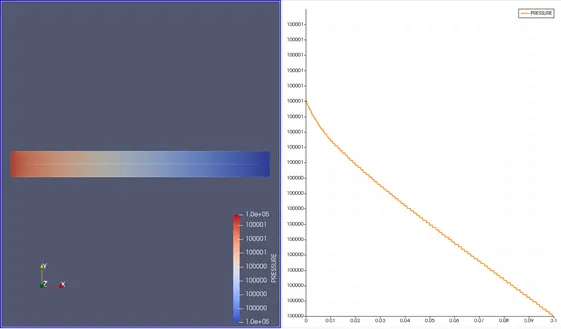
- Case 3
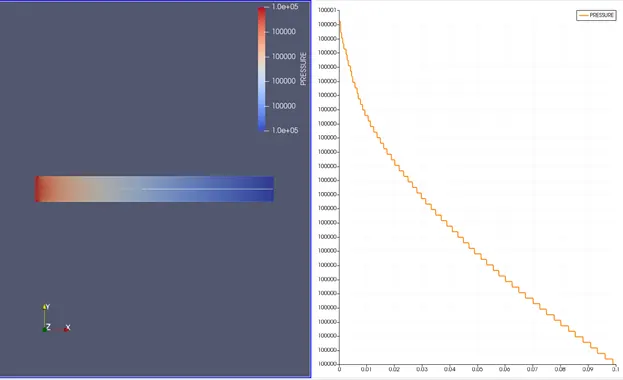
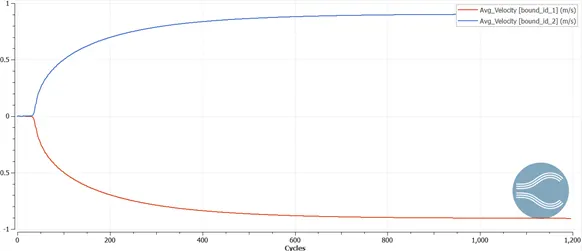
- Average velocity per cycles
- Case 1
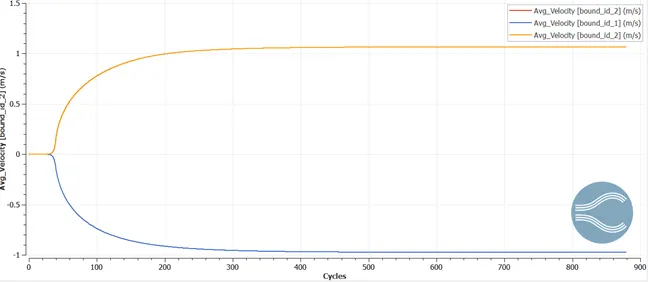
- Case2
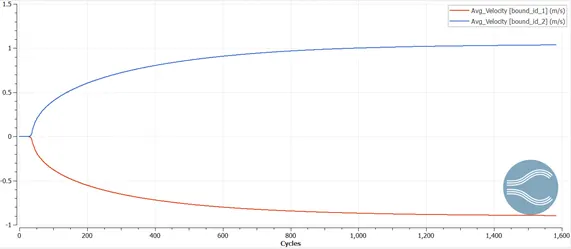
- Casse 3
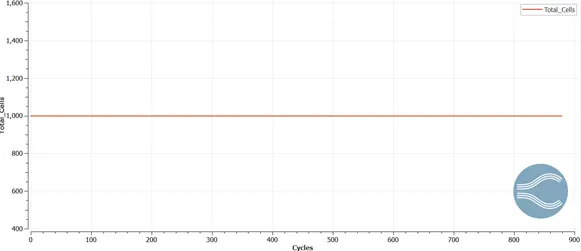
- Cell count
- Case 1: 1000 cells
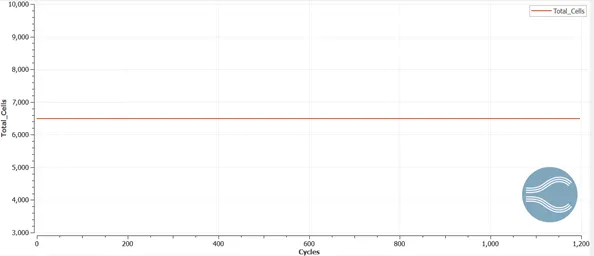
- Case 2: 6500 cells
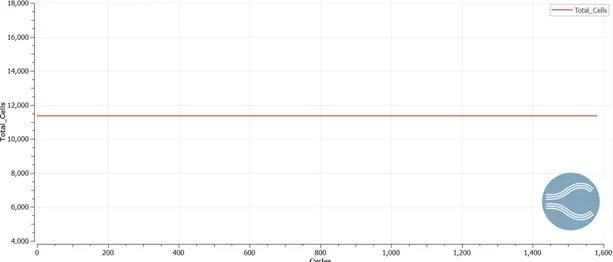
- Case 3:11356 cells
- Mass Flow Rate
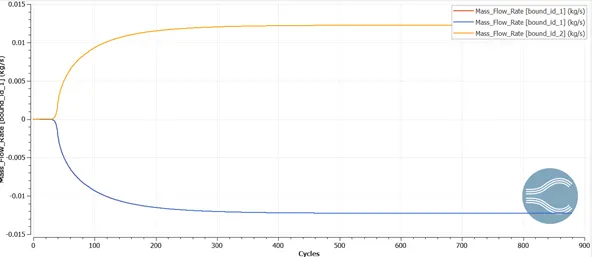
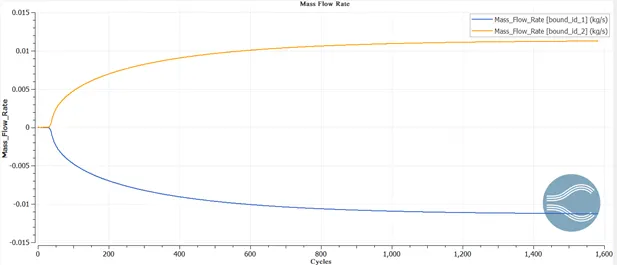
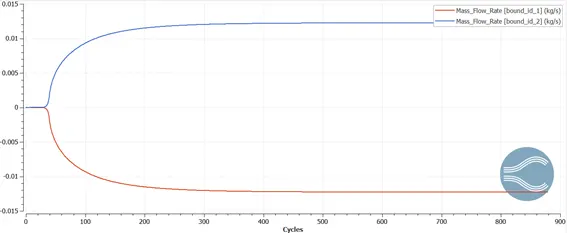
The mass flow rate decreases from 0 to -0.012 and gets cvonverged and is pretty much the same value for the three casesto which the mass flow rate converges in the inlet side. On the other hand, mass flow raste increases from 0 to 0.012 and gets converged for all the 3 cases.
- Case 1
- Case 2
- Case 3
- Static pressure and Total Pressure
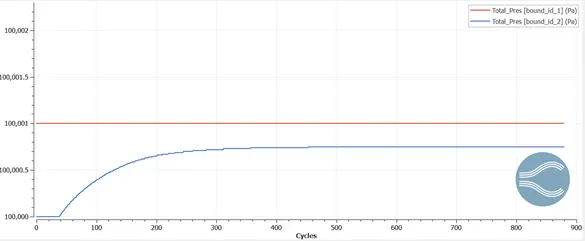
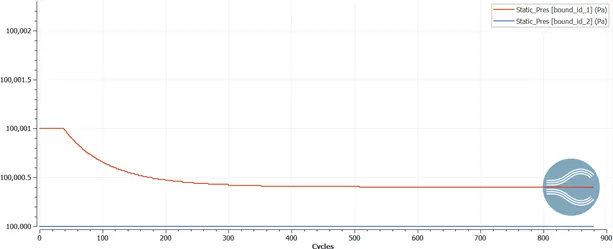
For all the three cases(a)Total Pressure at inlet(blue colored) and outlet(red colored);(b) Static pressure at inlet(red colored) and Static pressure at outlet(blue colored). Fro,m the pressure contour irt can be inferred that, after some transient fdlow time, a steady statye p[ressure difference was observed for a value of just 1 bar,for whivh the flow is laminar for which the flow is lasminar
- Case 1
(a)
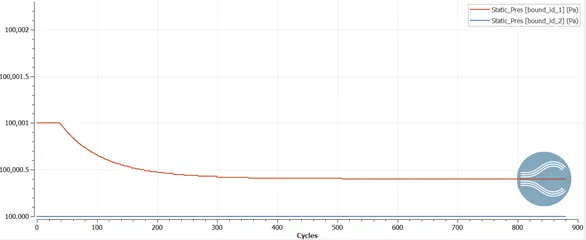
(b)
- Case 2
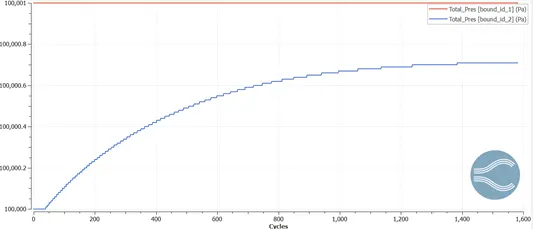
(a)
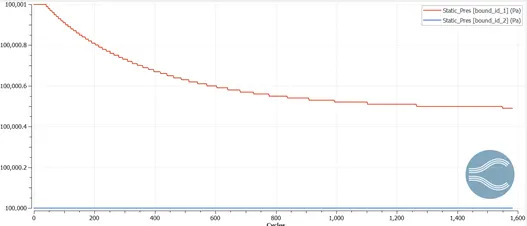
(b)
- Case 3
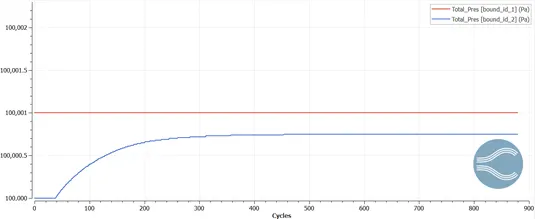
(a)
(b)
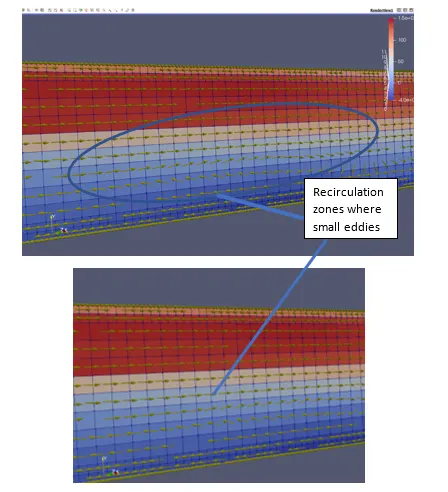
Small circulation zones are slightly observed with the rotational flow of vectors in the growing boundary layer.
Conclusions with animations
Total Pressure bound 1 is same throughout the flow. The grid independency test results in that the grid is independent as we can observe the velocity contour plots and the range whichn is from 0.065 to 1.2. We checked at different probe location of x=0.5 and 0.9 m, it was seen that the flow is fully developed for both the probes. so we can infer that the entrance length is very small which is `=0.05Re` .
We can see that due to the no slip condition. the flow adheres at the edges with lowest velocity of the channel and starts to develop with the progress in the axial direction. With the decrease in mesh size, the flow gets smoother and the total number of cycles increases. We can also observe from the average velocity profiles that as the mesh size is reduced the average velocity is reduced since the fully developed condition is achieved sdlightly earlier.