Block diagram for a function
1. Aim -
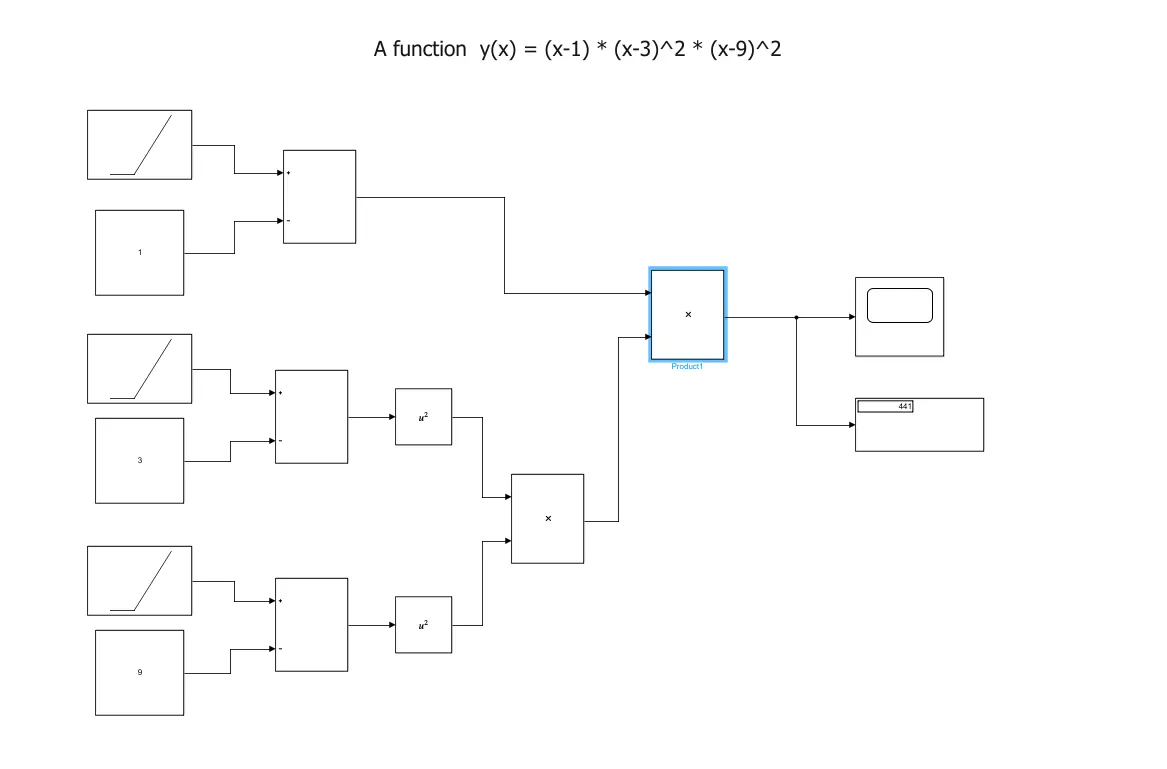
- Plot a function y(x) = (x-1) * (x-3)^2 * (x-9)^2 using basic Simulink blocks.
- Run Simulink example “Suspension System Comparison”.
2. Objective -
- Understand the library browser and use different blocks to get the output.
- To run the example file and compare the results.
3. Method
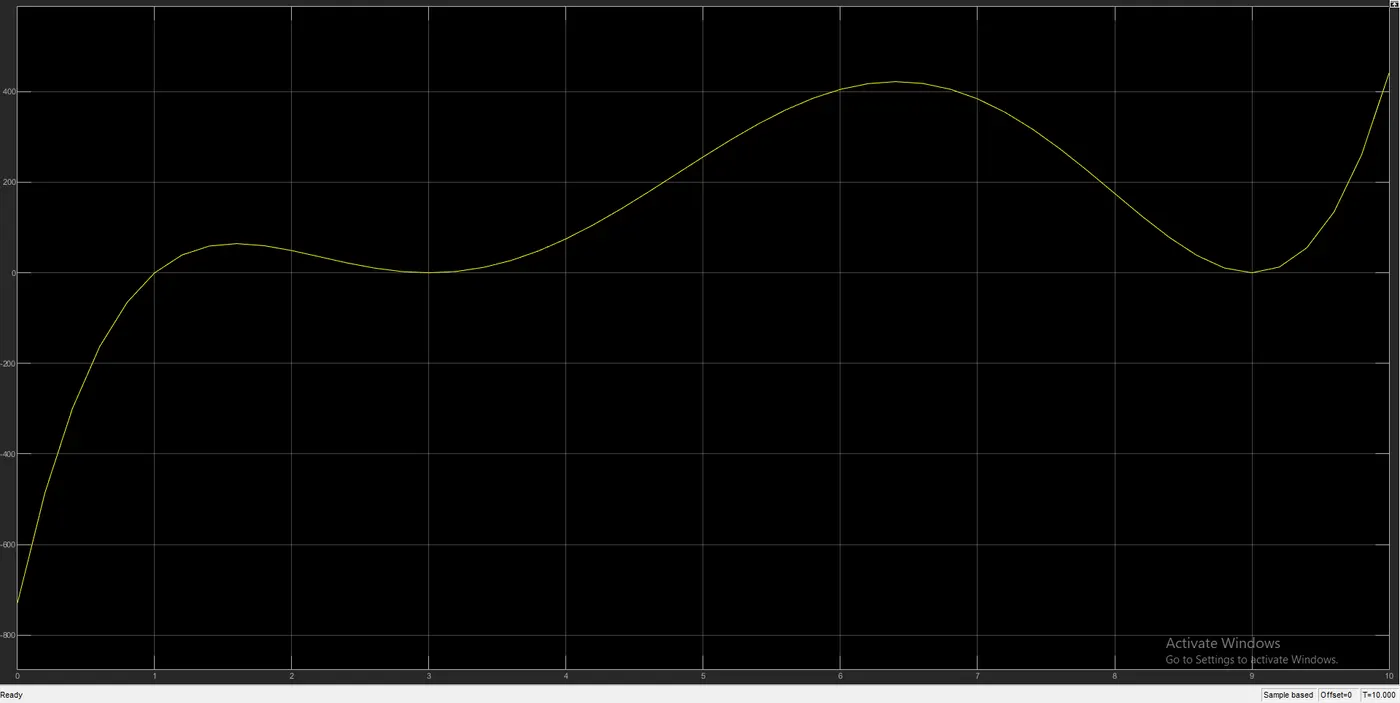
- A Ramp is used in and the simulation is run for 10sec. However, due to the Ramp block, the value of 'x' will increase by 1 for every second.
- Here the Ramp will act as a loop that iterated the values for each iteration.
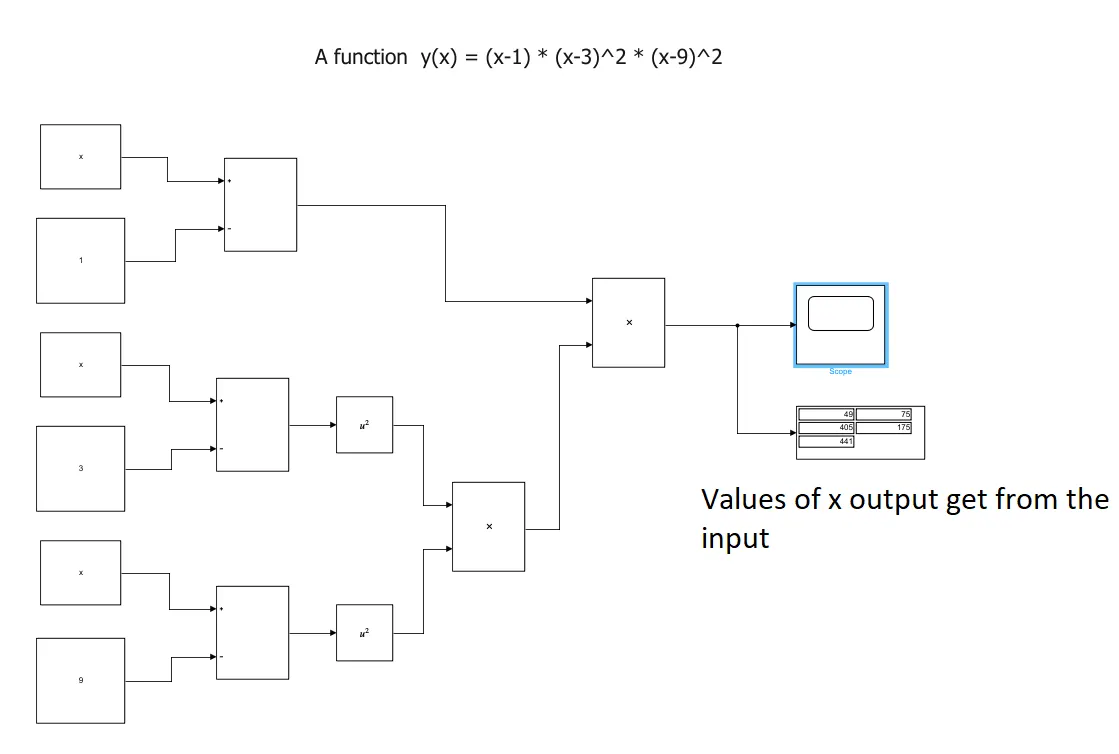
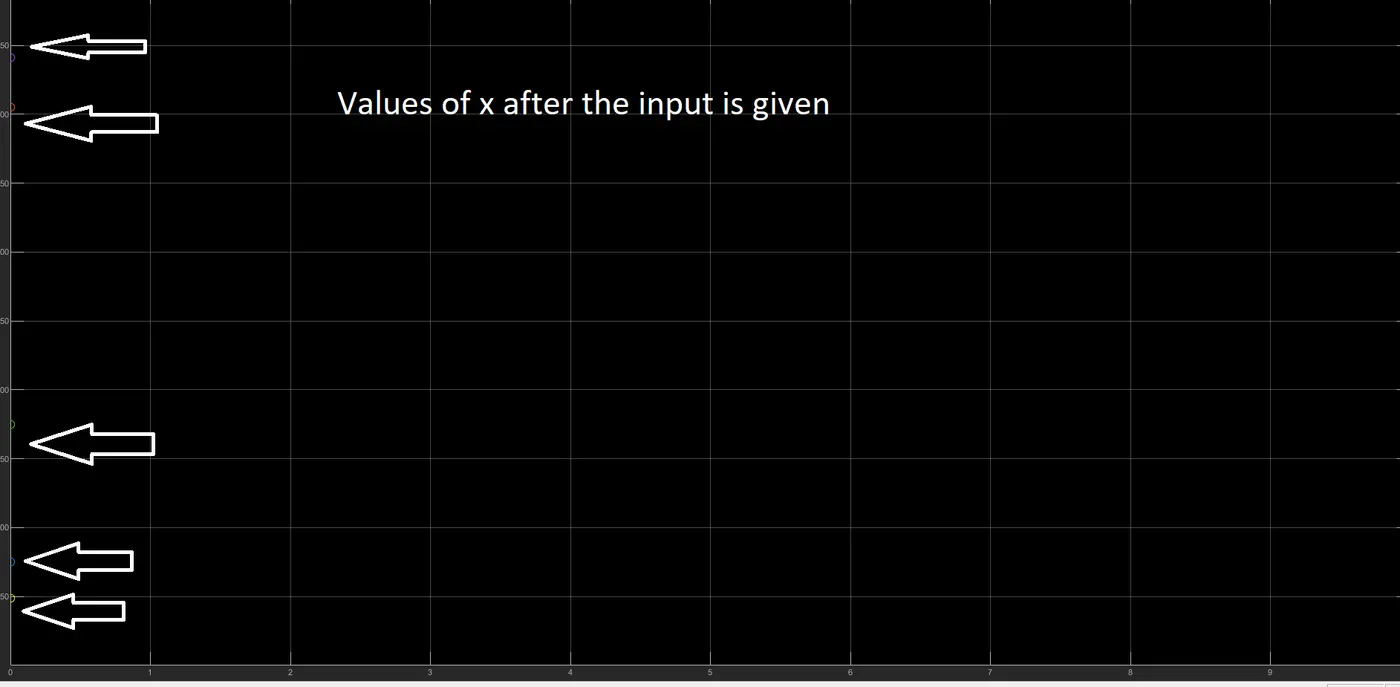
- Here the x values can be given as a input variable. Here 'x' is defined as a variable and values are mentioend in command window.
- Here just for a example an array was mentioned for the values of x and accordingly the output has been taken.
Objectives of simulation:
- Simulation is a virtual environment, it is not a reality, functitious setup of a system. A model is run and try to study the real world behaviour and focus on the output.
- Actual system realization may be costly and time consuming, some experiments are beter to be done in simulation mode. Just to avoid any financial risk.
- There is no question but that one of the most significant advantages of simulation is its ability to speed up the passage of time. This is a fundamental characteristic that will enable participants to make decisions on situations that normally would develop over a longer period of time.
- Logical operations or equations are converted into blocks. It simplifies the complex system and all the equations will be im the form of block.
- Pweformance analysis - How well does the system perform under a given set of circumstances in all measures of significance?
- Capability analysis - Is the system capable of meeting specific performance requirements?
- Comparision study - How well does one system configuration or design variation perform compared to another?
Similarity and difference between three systems:
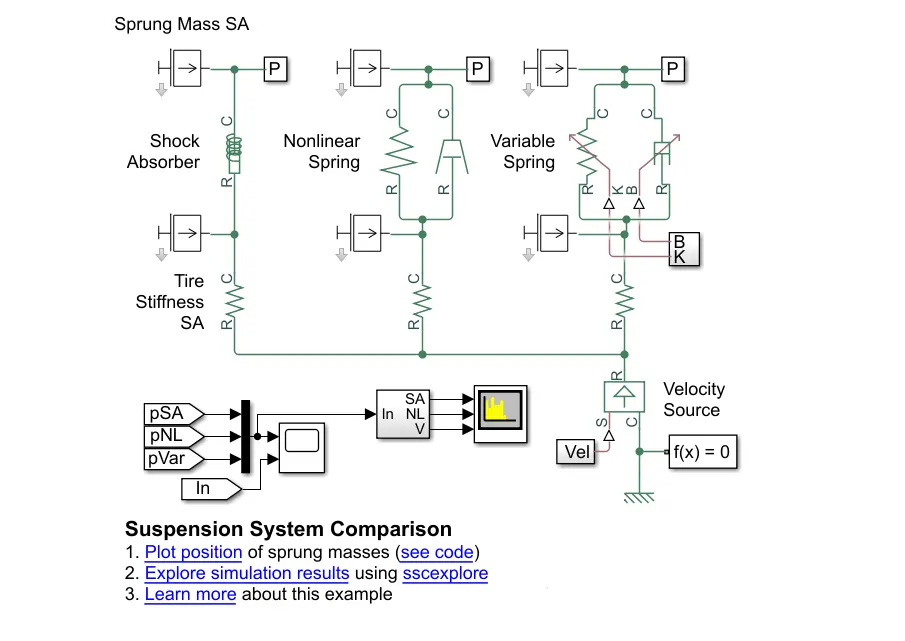
- The first uses the Shock Absorber block and includes linear stiffness and damping.
- The second shock absorber uses a Nonlinear Translational Spring and a Nonlinear Translational Damper specified by symmetric polynomials.
- The third uses a Variable Translational Spring and Variable Translational Damper.
This example shows three sets of springs and dampers excited by the same oscillating velocity source.
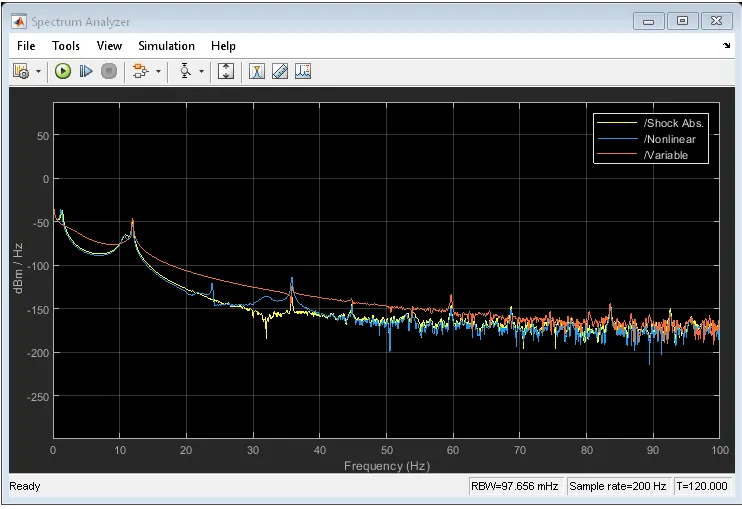
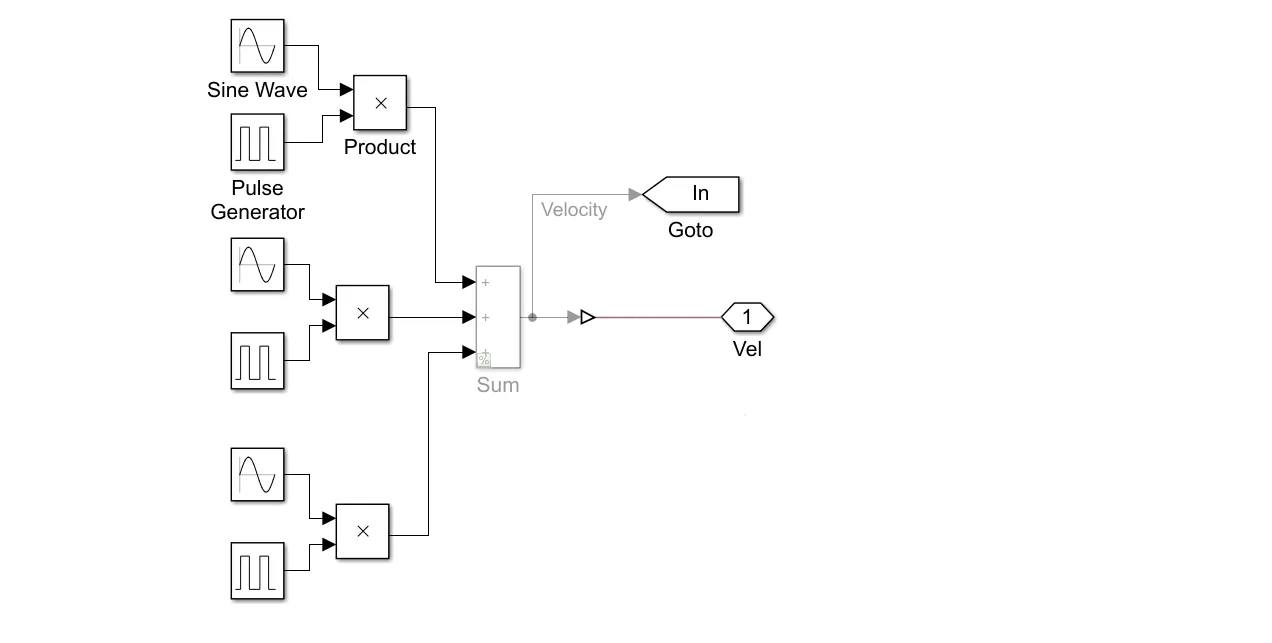
- Oscillating velocity source:
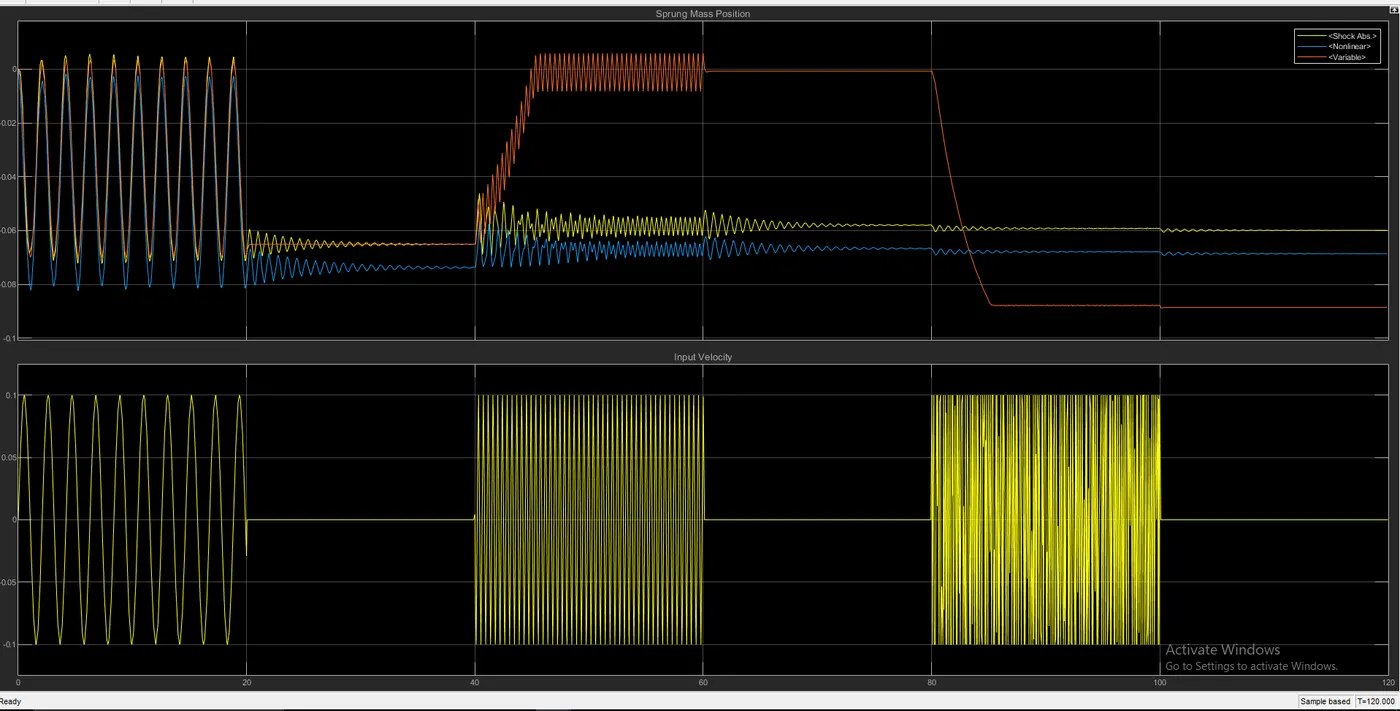
- The plot below shows the position of the sprung masses in three different suspension models that are subjected to the same test.
- From the plot it can be seen that the 1st pulse generated by the sine wave sine little wider having frequency of 3 and phase delay of 0, where as the the frequency and phase delay increases the output increases.
- This difference varries from 0 to 20, 40 to 60, 80 tp 100.
4. Learning outcome:
- Understanding how to plot the simulation model for the function.
- Understand the process to run the example given as an example and comparing the outcome.
5. Conclusion:
- In order to the output for the values of 'x' a constant block can be used and x value can be assigned to it. Also the other option is to use a Ramp for which the value will be changing the same way it changes for the 'for' loop. The output plot for both the conditions are shown in the result.