BMS Engineer Interview Questions: 14 Answers With Worked Numbers
The questions BMS interviewers actually ask, answered with numbers you can redo on a whiteboard: coulomb counting and why LFP defeats voltage-based SOC, Kalman filters, SOH, balancing and pre-charge resistor sizing, 1RC models, isolation limits, ISO 26262 ASILs, CAN signal packing and India's AIS-156 BMS rules.
In short
- BMS interviews test whether you can put numbers on the core jobs: state of charge (SOC), state of health (SOH), cell balancing, cell models, pre-charge, isolation, thermal limits, functional safety and CAN.
- Expect at least one calculation. The 14 questions below each come with a worked answer you can redo on a whiteboard, and every number is re-computed in a script.
- The trap question for 2026 is LFP: its voltage curve is so flat that a 5 mV error can move a voltage-based SOC estimate by about 10 percentage points in the middle of the curve.
- For Indian roles, know AIS-156 Amendment 3 (BMS protections, at least 4 temperature sensors, a 60 °C alarm, one month of data logging) and the 2026 amendment that adds cybersecurity tests for Bluetooth and other wireless BMS.
A battery management system (BMS) engineer interview usually moves from "what does a BMS do?" to "show me the numbers" within ten minutes. Interviewers want to see you estimate SOC with coulomb counting and explain why it drifts, say why LFP cells defeat voltage-based SOC, size a balancing resistor and a pre-charge resistor, explain a 1RC cell model, and connect the design to ISO 26262 and India's AIS-156 rules.
This guide replaces our 2022 list with 14 questions that come up in BMS, battery-algorithm and battery-systems interviews, each answered the way a good candidate would: a one-line answer first, then the working. If you want the fundamentals first, read how a battery management system works, then come back.
| Topic | What the interviewer is checking | Number worth remembering |
|---|---|---|
| SOC: coulomb counting | Integration, drift, capacity fade | 0.3 A offset × 24 h = 7.2 Ah of error |
| SOC: OCV lookup | Why LFP is hard | LFP: under 1 mV per 1% SOC on parts of the plateau |
| Kalman filter | Predict and correct, model error | 10 mV OCV error → about 1 point (NMC) vs 6 points (LFP) |
| SOH | Capacity and resistance | UN GTR 22: 80% at 5 years / 100,000 km |
| Balancing | Passive vs active, heat | 15 Ω at 4.1 V = 273 mA, 1.1 W per channel |
| Pre-charge | RC time constant, resistor energy | 95% of pack voltage after 3τ |
| Isolation | Limits and measurement | 100 Ω/V DC, 500 Ω/V AC (UN R100) |
| Functional safety | HARA, ASIL | S3 + E4 + C3 = ASIL D |
Courses: compare all 7 Skill-Lync battery technology courses, from Li-ion Battery System Design (three weeks of BMS, SOC measurement and BMS communication) to the PG Battery program, with fees, duration, projects and worked pack maths in one place.
1. What does a BMS do, and what does it not do?
Answer: a BMS measures every cell group's voltage, the pack current and temperatures; estimates SOC, SOH and the power the pack can safely deliver; balances cells; protects the pack by limiting current and opening contactors; and reports all of this to the vehicle over CAN. It does not charge the battery or cool it. It tells the charger, the inverter and the thermal system what the pack can accept.
A strong answer adds the reason it exists: cells in series carry the same current but are never identical, so the weakest group hits its voltage limits first. The BMS protects that cell, because the pack is only as good as its weakest group. In Indian two- and three-wheelers, AIS-156 Amendment 3 makes the basics mandatory: the BMS must be microprocessor or microcontroller based, meet EMC requirements (AIS 004 Part 3) and be tested for over-charge, over-discharge, over-temperature, over-current and short-circuit protection.
2. How does coulomb counting estimate state of charge, and why does it drift?
Answer: SOC is the charge left as a fraction of the cell's present capacity. Coulomb counting integrates measured current over time and subtracts it from a starting SOC. It is simple and smooth, but every current-sensor error and every capacity error accumulates.
Worked example. A 100 Ah pack starts at 90% SOC. It discharges at 50 A for 20 minutes, takes back 20 A of regenerative braking for 2 minutes, then discharges at 30 A for 30 minutes.
- Charge out: 50 × (20/60) = 16.67 Ah, then 30 × 0.5 = 15.00 Ah
- Charge in: 20 × (2/60) = 0.67 Ah
- Net removed: 16.67 + 15.00 − 0.67 = 31.0 Ah
- New SOC: 90% − (31.0 / 100) × 100% = 59.0%
Now the two follow-ups interviewers like. First, sensor offset: if the current sensor reads 0.3 A high and counting runs for 24 hours of operation, that is 0.3 × 24 = 7.2 Ah, or 7.2 percentage points of error on this pack, and it keeps growing. Second, capacity fade: if the pack has aged to 90 Ah but the BMS still divides by 100 Ah, the true SOC after the same drive is (0.90 × 90 − 31) / 90 = 55.6%, while the BMS shows 59.0%. That is why SOC and SOH estimation cannot be separated, and why coulomb counting is always paired with a correction from voltage.
3. Why can't you just read SOC from the cell voltage, especially for LFP?
Answer: you can, but only at rest and only where the open-circuit voltage (OCV) curve is steep. Under load the terminal voltage includes resistive and polarisation drops, so the cell must rest for the voltage to settle. And for LFP (lithium iron phosphate) the OCV curve is so flat in the middle that a tiny voltage error becomes a large SOC error.
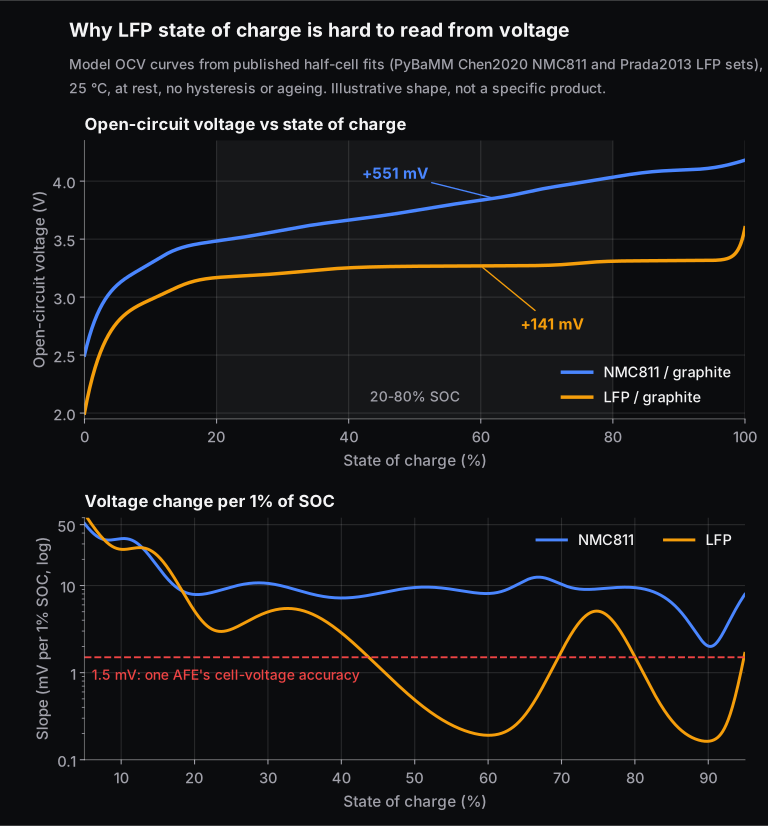
Worked example. On these model curves, the NMC811 cell's OCV changes by about 9.5 mV per 1% of SOC at 50% SOC. The LFP cell changes by only about 0.5 mV per 1%. A 5 mV voltage error therefore means:
- NMC811: 5 / 9.5 ≈ 0.5 percentage points of SOC error
- LFP: 5 / 0.49 ≈ 10 percentage points of SOC error
Across 20 to 80% SOC, the LFP slope is below 1.5 mV per 1% of SOC for about 43% of the range on this model. TI specifies its BQ79616-Q1 cell monitor at ±1.5 mV ADC accuracy, so on those parts of the plateau a 1-point change in SOC is smaller than the measurement uncertainty. LFP also shows voltage hysteresis (the charge and discharge curves do not coincide), which has a thermodynamic origin, so the "true" OCV depends on history. In practice an LFP BMS leans on coulomb counting through the plateau and recalibrates near the steep ends, typically at full charge. Our LFP vs NMC comparison goes deeper into the chemistry.
4. What does a Kalman filter add to SOC estimation?
Answer: a Kalman filter blends the two imperfect sources. It predicts SOC with coulomb counting, predicts what the terminal voltage should be using a cell model, compares that with the measured voltage, and nudges SOC by an amount (the Kalman gain) that depends on how much it trusts the model versus the measurement. Because the OCV curve is non-linear, BMS work uses the extended Kalman filter (EKF), which linearises the curve at each step. Gregory Plett's three-part 2004 paper in the Journal of Power Sources is a widely cited reference for EKF-based BMS estimation.
The idea in one line: predict SOC and the RC voltage from current; correct both using the voltage error. Where the OCV slope is steep, a voltage error carries a lot of SOC information and the gain is large. Where the curve is flat, it carries almost none.
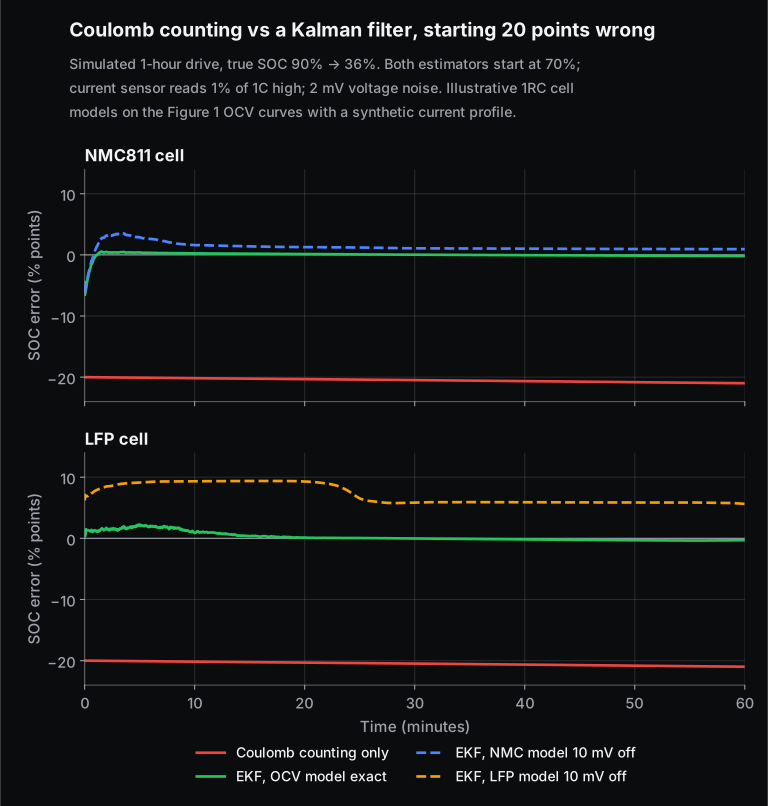
In the simulation, coulomb counting never recovers from its wrong starting point and slowly drifts further because of the sensor offset. The EKF fixes the starting error within about a minute for both chemistries when its OCV curve is exact. Then we make the filter's OCV curve 10 mV wrong, the kind of error hysteresis, temperature or ageing can cause. The NMC811 estimate settles about 1 point off. The LFP estimate stays about 6 points off (median after the first 10 minutes) and peaks above 9. The lesson interviewers want: a Kalman filter is only as good as its cell model, and LFP punishes model error.
5. What is state of health, and how do you measure it?
Answer: SOH describes how much a cell has aged compared with new. The two common definitions are capacity-based (present capacity ÷ rated capacity) and resistance-based (present internal resistance ÷ resistance when new). Capacity fade cuts range; resistance growth cuts power and raises heat. Both come from the ageing mechanisms reviewed by Barré et al. (2013), such as growth of the solid-electrolyte interphase layer and loss of active material.
Worked example. A cell rated 5.0 Ah delivers 4.3 Ah in a full reference discharge: capacity SOH = 4.3 / 5.0 = 86%. Its DC resistance has risen from 1.2 mΩ to 1.8 mΩ, a 50% increase, so the instant voltage drop at 100 A grows from 120 mV to 180 mV, and the BMS must cut the allowed power earlier to stay above the minimum cell voltage.
In the vehicle, a full reference discharge is rarely available, so the BMS estimates capacity from partial data, for example the charge counted between two rested OCV points. Regulators now care about this estimate too. UN Global Technical Regulation No. 22 on in-vehicle battery durability, established on 9 March 2022, sets minimum performance requirements for passenger EVs of at least 80% of certified usable energy up to 5 years or 100,000 km, and 70% up to 8 years or 160,000 km, whichever comes first. It relies on the vehicle's own on-board SOH estimate (the state of certified energy, SOCE), whose accuracy is checked in laboratory tests.
6. What is an equivalent circuit model? Explain 1RC and 2RC models.
Answer: an equivalent circuit model (ECM) imitates a cell's terminal voltage with simple circuit elements: a voltage source for OCV(SOC), a series resistor R0 for the instant ohmic drop, and one or more resistor-capacitor (RC) pairs for the slower polarisation that builds up under load and relaxes at rest. A 1RC (first-order Thevenin) model has one RC pair; a 2RC model adds a second pair so it can capture a fast and a slow time constant.
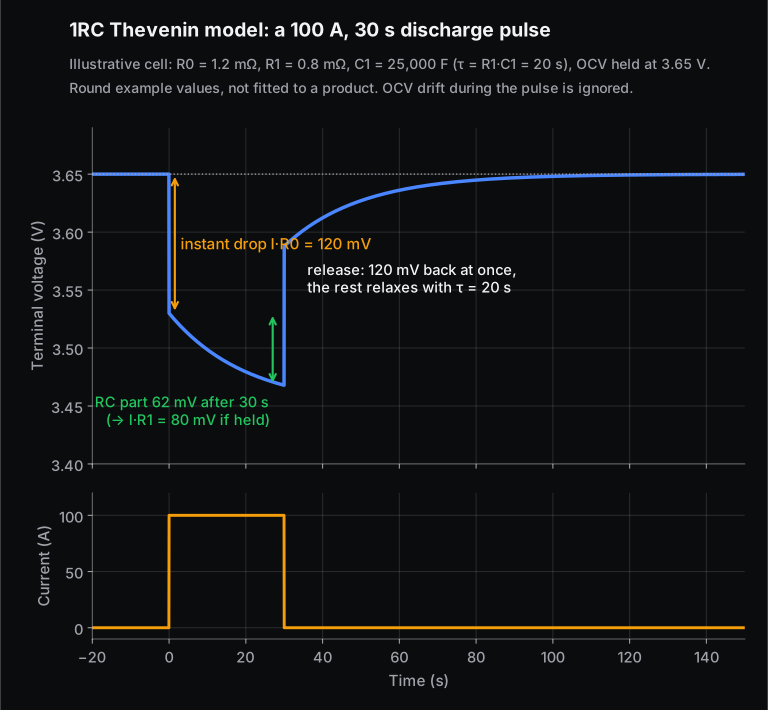
Worked example: extracting parameters from a pulse test. Apply a 100 A, 30 s discharge pulse to a rested cell and record voltage:
- The instant the current starts, voltage drops 120 mV. So R0 = 0.120 / 100 = 1.2 mΩ. (Use the instant step at the end of the pulse as a cross-check; it should be the same.)
- After the instant step, voltage keeps falling as the RC branch charges, by 62.1 mV after 30 s. After the pulse, that 62.1 mV relaxes away; time how long it takes to fall to 37% (22.9 mV). Here that is 20 s, so τ = 20 s.
- The RC drop after 30 s is I × R1 × (1 − e−30/τ). So R1 = 0.0621 / (100 × 0.777) = 0.80 mΩ, and C1 = τ / R1 = 20 / 0.0008 = 25,000 F.
Real cells need these values as tables over SOC and temperature, and the fit is done by least squares over many pulses. Which model to pick? A systematic review by Nejad, Gladwin and Stone (2016) compared ten lumped models on LFP and NMC cells and found the RC-network models gave the best dynamic accuracy and SOC estimates, with a 1RC model plus a hysteresis term recommended for high-hysteresis chemistries such as LFP. For hands-on practice, see our post on modelling a Li-ion battery equivalent circuit.
7. Passive vs active cell balancing: how do you size a bleed resistor?
Answer: passive balancing switches a resistor across the highest cells and burns their extra charge as heat until they match the lowest. Active balancing moves charge from high cells to low cells through inductors, transformers or capacitors. Passive is cheap and simple, so it dominates; active recovers capacity faster and wastes less energy but costs more parts and control effort.
Worked example (passive). An NMC cell group sits at 4.1 V and is 2 Ah above the others. You want to remove that in about 8 hours of charging and parking.
- Required current: 2 Ah / 8 h = 0.25 A, so R = 4.1 / 0.25 = 16.4 Ω
- Pick the next standard value down, 15 Ω: I = 4.1 / 15 = 273 mA, P = 4.1² / 15 = 1.12 W per channel, time = 2 / 0.273 = 7.3 h
- Twelve channels bleeding at once on one monitoring board: 12 × 1.12 = 13.4 W of heat in a sealed pack
- Energy thrown away: about 2 Ah × 4.1 V ≈ 8.2 Wh
That heat is why designs limit how many channels balance at once, or use duty cycling. Monitoring chips set the scale: TI's BQ79616-Q1 offers internal balancing at 240 mA, which would take 2 / 0.24 = 8.3 h to remove the same 2 Ah.
Active balancing example: Analog Devices' LTC3300-1 is a bidirectional synchronous flyback balancer for up to 6 Li-ion or LiFePO4 cells in series, with up to 10 A balancing current (set by external parts) and up to 92% charge-transfer efficiency. Moving 1 Ah from the high cell to the low one at that efficiency loses about 0.33 Wh instead of burning 8.2 Wh. A good follow-up line in an interview: balancing corrects SOC mismatch, not capacity mismatch. A cell with lower capacity will drift again every cycle.
8. Why does a pack need pre-charge, and how do you size the resistor?
Answer: the inverter has a large DC-link capacitor. Closing the main contactor onto an empty capacitor gives a huge inrush current that can weld the contactor. So the BMS first closes a pre-charge contactor in series with a resistor, waits until the link voltage is close to pack voltage, then closes the main contactor and opens the pre-charge path. The circuit is a simple RC: v(t) = Vpack × (1 − e−t/RC), and it reaches 95% after three time constants.
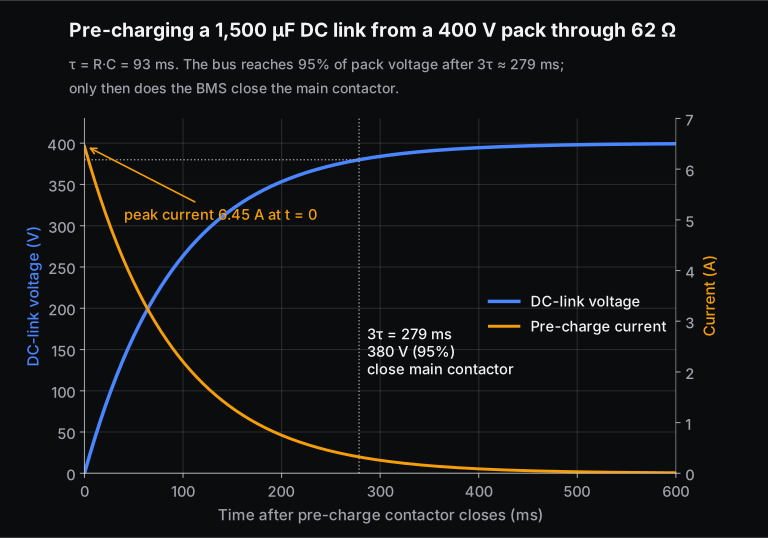
Worked example. 400 V pack, 1,500 µF DC link, pre-charge must finish within 300 ms. This follows the method in TI's application note on DC-link pre-charge designs.
- 3τ ≤ 300 ms, so τ ≤ 100 ms and R ≤ 0.1 / 0.0015 = 66.7 Ω. Choose 62 Ω: τ = 93 ms, 95% (380 V) reached at 279 ms.
- Peak current: 400 / 62 = 6.45 A; peak resistor power: 400² / 62 ≈ 2.58 kW, but only for milliseconds.
- Energy into the resistor: a charging RC dissipates as much energy as the capacitor stores, about ½CV² = ½ × 0.0015 × 400² = 120 J per pre-charge. Size the resistor for this pulse energy and for repeated attempts, not for its average power.
- When the main contactor closes at 95%, the remaining step is only 20 V, which the contactor handles easily.
The diagnostic follow-up: the BMS checks that the link voltage reaches its target within the expected time. If a fault puts, say, 10 Ω across the link, the voltage stalls at 400 × 10 / (62 + 10) ≈ 56 V, the BMS aborts and opens the pre-charge contactor instead of closing the main one.
9. What is isolation monitoring, and what limit applies?
Answer: the high-voltage system floats; neither pole is connected to the chassis. Isolation monitoring measures the resistance from each HV pole to the chassis so that a single insulation fault is detected before a second one makes the body live. UN Regulation No. 100 requires at least 100 Ω per volt of working voltage for DC buses and 500 Ω per volt for AC buses (or for combined buses unless the AC parts have extra protection).
Worked example. For a 400 V DC bus, the minimum is 100 × 400 = 40 kΩ; if the AC side is galvanically connected and not separately protected, it is 500 × 400 = 200 kΩ.
The measurement method in Annex 4A of R100 uses a known resistor Ro. Suppose the real leakage paths are 80 kΩ from HV+ to chassis and 120 kΩ from HV− to chassis:
- Measure HV− to chassis: V1 = 240 V; HV+ to chassis: V2 = 160 V. V1 is larger, so connect Ro from HV− to chassis.
- Choose Ro near the required minimum: 100 Ω/V × 400 V = 40 kΩ. Re-measure HV− to chassis: V1′ = 109.1 V.
- Ri = Ro × Vb × (1/V1′ − 1/V1) = 40,000 × 400 × (1/109.1 − 1/240) = 80 kΩ, which is the weaker path. 80,000 / 400 = 200 Ω/V: passes the 100 Ω/V DC limit, fails the 500 Ω/V limit.
On-board isolation monitors work on the same principle, switching known resistor branches between each pole and chassis and reading the voltages, as TI describes for its TPSI2260-Q1 switch.
10. What faults does a BMS protect against, and in what order does it react?
Answer: over-voltage (over-charge), under-voltage (over-discharge), over-current, short circuit, over-temperature, under-temperature during charging, isolation faults, and its own sensor and communication faults. These map directly onto the five protections AIS-156 Amendment 3 tests for. The reaction is graded: warn, then reduce the allowed charge or discharge current (derate), then open the contactors if the limit is still crossed. A fuse or pyro-fuse handles hard short circuits faster than any software can. AIS-156 Amendment 3 also requires a fuse or circuit breaker in addition to the BMS's own protections.
Limits come from the cell datasheet, not generic tables. For example, LG's INR18650HG2 NMC cell specifies a 4.20 V maximum charge voltage, charging only between 0 and 50 °C and discharging between −20 and 75 °C (cell surface temperature). A good candidate also mentions sensor plausibility checks: two temperature sensors that disagree, or a cell voltage that jumps, are faults in their own right, because a BMS that reads the wrong value cannot protect anything.
11. How does the BMS handle thermal management?
Answer: the BMS measures temperatures, estimates heat generation, requests cooling or heating from the thermal system, and derates current when cells are too hot or too cold. Heat generation in a cell is mainly resistive (I²R) plus a reversible entropic term, as set out in Bernardi, Pawlikowski and Newman's 1985 energy balance.
Worked example. At 100 A, a cell with 1.2 mΩ resistance generates 100² × 0.0012 = 12 W. A string of 96 such cells generates about 1.15 kW, and that doubles to 24 W per cell if resistance doubles with age, which is why SOH feeds the thermal model.
For Indian L-category vehicles, AIS-156 Amendment 3 (Annex 8K) requires at least 4 temperature sensors in the pack, placed to read true cell temperatures. If temperature crosses 60 °C an audio-visual alarm must sound, and if the vehicle is in use the BMS must gradually cut traction power. The thermal propagation test must show no fire or explosion after a single cell goes into thermal runaway, with a warning at least 5 minutes before any fire or explosion. Charging cold cells is the other side: low-temperature charging promotes lithium plating on the anode, which is why datasheets set a lower charge limit such as 0 °C. For the hardware side, see our battery thermal management course.
12. What is ISO 26262, and what ASIL does a BMS need?
Answer: ISO 26262 is the functional safety standard for road-vehicle electrical and electronic systems. In the hazard analysis and risk assessment (HARA), each hazard is rated for severity (S0 to S3), exposure (E0 to E4) and controllability (C0 to C3). A lookup table in ISO 26262-3 turns the three ratings into an Automotive Safety Integrity Level from QM (normal quality management, no ASIL) through A, B and C up to D. Only the worst combination, S3 + E4 + C3, gives ASIL D.
Worked example (illustrative HARA row). Hazard: the BMS fails to stop charging an over-charged cell, leading to thermal runaway and fire. Severity: life-threatening (S3). Exposure: charging happens on most days (high, E4). Controllability: the driver cannot see or prevent it (C3). Result: ASIL D for the safety goal "prevent cell over-charge". A different hazard with lower exposure or better controllability would land lower. Your OEM's HARA decides the real ratings, so say so in the interview.
What changes at higher ASIL is the rigour: redundant or diverse measurement paths, diagnostic coverage targets, safety mechanisms in the microcontroller, and more verification. Silicon vendors design for this; TI lists its BQ79616-Q1 cell monitor with systematic and hardware capability up to ASIL D. AIS-156 Amendment 3 names ISO 26262 as one acceptable method for the thermal propagation risk-reduction analysis. Our functional safety overview course covers the process.
13. What does AIS-156 require from a BMS in India?
Answer: AIS-156 sets the battery (REESS) safety requirements for L-category electric vehicles such as electric two- and three-wheelers. After an expert committee set up in the wake of the 2022 EV fires, MoRTH announced Amendment 3 on 27 September 2022 (notified as S.O. 4567(E) the next day), applied in two phases from 1 December 2022 and 31 March 2023. The BMS-related points from the Amendment 3 text:
- BMS must be microprocessor or microcontroller based and meet AIS 004 Part 3 EMC requirements
- Over-charge, over-discharge, over-temperature, over-current and short-circuit protection verified during pack testing
- The on-board or portable charger must communicate with the BMS, cut off charge voltage, soft-start and detect deep discharge
- Pack tested for water ingress to IPX7 at 100% SOC, with no fire or explosion
- Thermal propagation test (Annex 8J) and an audio-visual warning at least 5 minutes before fire or explosion
- At least 4 temperature sensors, a 60 °C alarm and gradual power cut-off (Annex 8K)
- Critical pack data logged by the BMS, with at least the latest month kept on the pack or on a cloud server
- Traceability of cells, BMS and charger serial numbers for every pack
The 2026 addition. In September 2026, Autocar Professional reported Amendment No. 5 to AIS-156, adding a clause on cybersecurity testing for BMS units with Bluetooth Classic, Bluetooth Low Energy or other wireless interfaces. Energetica India reported seven assessments, including discoverability, pairing and authentication, command injection, replay, spoofing, denial of service and fuzzing. A BMS fails if it runs a safety-critical command from an unauthenticated source. We have not seen the notified text, so check the official MoRTH or ARAI copy before quoting clause numbers. Cars, buses and trucks (M and N categories) fall under AIS-038 Rev. 2 instead, which has its own amended traction-battery requirements.
14. How does a BMS communicate over CAN? Pack a signal.
Answer: the BMS sends SOC, current and power limits, cell extremes, faults and charge requests to the vehicle controller, inverter and charger, usually over CAN. Classical CAN carries up to 8 data bytes per frame with arbitration limited to 1 Mbit/s. CAN FD carries up to 64 bytes and can switch to a faster bit rate for the data phase. Both are standardised in ISO 11898-1.
Worked example: signal scaling. Pack current is sent as a 16-bit unsigned raw value with factor 0.1 A and offset −3,200 A (physical = raw × 0.1 − 3,200). The range is −3,200 to +3,353.5 A. To send −125.4 A: raw = (−125.4 + 3,200) / 0.1 = 30,746 = 0x781A. Interviewers then ask about byte order (Intel little-endian vs Motorola big-endian), signal timeouts and message counters/CRCs used for safety.
Worked example: payload. Sending 96 cell voltages at 2 bytes each is 192 bytes: 24 classical CAN frames, or 3 CAN FD frames. That payload difference is the usual argument for CAN FD on packs with many cells.
What else do BMS interviews test?
Beyond theory, expect questions on tools and process. MATLAB and Simulink for model-based algorithm development, embedded C for the target, a CAN tool for reading and logging frames, and hardware-in-the-loop (HIL) testing, where a simulator imitates cells and faults so the BMS can be tested safely. Bring one project you can explain end to end, for example an EKF SOC estimator you tuned on real drive-cycle data, and know its error numbers. Skill-Lync's Introduction to Battery Technology for Electric Vehicles and Li-ion Battery System Design courses are built around this kind of MATLAB and Simulink project work.
Frequently asked questions
What are the most common BMS engineer interview questions?
SOC estimation (coulomb counting, OCV, Kalman filters), SOH, passive vs active balancing, equivalent circuit models, protection and contactor/pre-charge logic, isolation monitoring, thermal limits, ISO 26262 and CAN. For Indian two- and three-wheeler roles, add AIS-156.
Why is SOC estimation harder for LFP than NMC?
LFP's open-circuit voltage is nearly flat between about 20% and 80% SOC. On our model curve it changes by about 0.5 mV per 1% of SOC at 50%, against about 9.5 mV for NMC811, so voltage-based corrections carry little information and small model or sensor errors become large SOC errors.
What is the difference between SOC, SOH and SOP?
SOC is how full the battery is now. SOH is how much it has aged (capacity or resistance compared with new). SOP, state of power, is how much current or power the pack can safely deliver or accept over the next few seconds, given SOC, temperature and SOH.
Which ASIL does a BMS usually have?
It depends on each OEM's hazard analysis. Hazards such as over-charge leading to fire can reach the top combination of severity, exposure and controllability, which gives ASIL D, and cell-monitoring chips are designed with ASIL D capability for that reason.
Is passive or active balancing better?
Passive balancing is cheaper and simpler and is the most common. Active balancing wastes less energy and corrects larger mismatches faster, which matters for large packs or second-life batteries with spread-out cells. Neither fixes a cell whose capacity is lower than the rest.
Sources and further reading
- ACMA (copy of the MoRTH amendment), Amendment 3 to AIS-156 (09/2022): Specific requirements for L category electric power train vehicles
- ACMA (copy of the MoRTH amendment), Amendment 3 to AIS-038 Rev. 2: Specific requirements for M, N category electric power train vehicles
- EVreporter (Venkat Rajaraman), AIS 156 standard: additional safety requirements, practitioner's perspective (9 Sep 2022, updated 28 Sep 2022): notification date and phase dates
- Autocar Professional, EV BMS cybersecurity testing now mandatory in India (8 Sep 2026)
- Energetica India, MoRTH mandates cybersecurity testing for wireless-enabled EV BMS (9 Sep 2026)
- UNECE, Regulation No. 100 (02 series), electric power train safety, clause 5.1.3 and Annex 4A; text published by Japan's MLIT
- HORIBA, UN GTR No. 22 battery durability: minimum performance requirements and SOCE monitor verification
- Texas Instruments, DC-link capacitor pre-charge designs in automotive systems, application note SDAA145 (2025)
- Texas Instruments, BQ79616-Q1 16-cell battery monitor: ±1.5 mV ADC accuracy, 240 mA balancing, ASIL D capability
- Texas Instruments, TPSI2260-Q1 datasheet: insulation monitoring with switched resistor dividers
- Digi-Key, Analog Devices LTC3300-1 battery balancer: up to 92% charge-transfer efficiency, up to 10 A
- LG Chem, INR18650HG2 product specification (2014)
- Plett, G. L., Extended Kalman filtering for battery management systems of LiPB-based HEV battery packs, Part 1 (with Part 2 and Part 3), Journal of Power Sources 134 (2004)
- Nejad, S., Gladwin, D. T. and Stone, D. A., A systematic review of lumped-parameter equivalent circuit models for real-time estimation of lithium-ion battery states, Journal of Power Sources 316, 183 (2016)
- Barré, A. et al., A review on lithium-ion battery ageing mechanisms and estimations for automotive applications, Journal of Power Sources 241, 680 (2013)
- Bernardi, D., Pawlikowski, E. and Newman, J., A general energy balance for battery systems, J. Electrochem. Soc. 132, 5 (1985)
- Dreyer, W. et al., The thermodynamic origin of hysteresis in insertion batteries, Nature Materials 9, 448 (2010)
- Chen, C.-H. et al., Development of experimental techniques for parameterization of multi-scale lithium-ion battery models, J. Electrochem. Soc. 167, 080534 (2020); fits as implemented in the PyBaMM parameter sets (Chen2020, Prada2013)
- itemis, ASIL glossary: S, E and C classes and ASIL D
- CAN in Automation, CAN FD: the basic idea: 64-byte payload, 1 Mbit/s arbitration limit, ISO 11898-1