Week 9 - Senstivity Analysis Assignment
AIM:
- Writing a code which takes into account all the reactions from GRI mechanism and evaluates 10 most sensitive reactions, where the sensitivity parameter is be w.r.t temperature.
- The program should show the reaction strings in order of greatesr sensitivity to the least sensitivity.
- The program should be parametric, intuitive and easy to obtain 'n' no. of sensitive reactions w.r.t the asked parameter, by simply changing a number.
- A graph of sensitivities Vs the reactions can be also be plotted (Optional).
THEORY:
Thermochemical properties play an important role for accurate prediction of ignition characteristics using chemical kinetics models due to their impact on energy balances and chemical equilibrium. Therefore, the acquisition and incorporation of accurate thermochemical data have been a major objective of many recent modelling studies.
Sensitivity Analysis is the study of how the uncertainity in the output of a mathematical model or system can be divided and allocated to different sources of uncertainty in its inputs. Sensitivity analysis is often employed to quantify the importance of each of the model's parameter on the behaviour of the system. We can distinguish between local and global sensitivity analysis. A local sensitivity analysis addresses sensitivity relative to change of a single parameter value, while a global analysis examines sensitivity with regard to the entire parameter distribution. While global sensitivity analysis focuses on the variance of model outputs and determines how the input parameter influence the output parameters. It is central tool in Sensitivity analysis since it provides an quantitative and rigorous overview of how inputs influence output.
CODE APPROACH:
- Initially, all the necessary libraries and create an object 'gas' of Solution class, Ideal Gas Constant Pressure Reactor 'r' named as 'R1', and finally a Reactor Network 'sim'.
- We have to perform time integration on this reactor, which is possible because of the 'advance' method present in the Reactor Network. After which, we will have to calculate the reaction sensitivity w.r.t temperature for all the reactions present in the GRI mechanism file by: sim.sensitivity('temperature',reaction_index).
- We can use the standard logic available for arranging the reaction sensitivity values in the descending order. Only after this can we sort out the required number of top most sensitive reactions. We can use the sort() method with reverse=True as the argument to arrange the values in the descending order, but we cannot name the reactions whose sensitivity is being displayed. Hence it is better to manually sort the values.
- After this, using the matplot library, plot a bar graph to display the top most sensitive reactions w.r.t temperature.
CODE:
https://drive.google.com/file/d/11pUhZCX4pEy4xeBNf9P6l7cY7B8wDrHj/view?usp=sharing
RESULT:
For the top 10 reactions, we get the plot as:
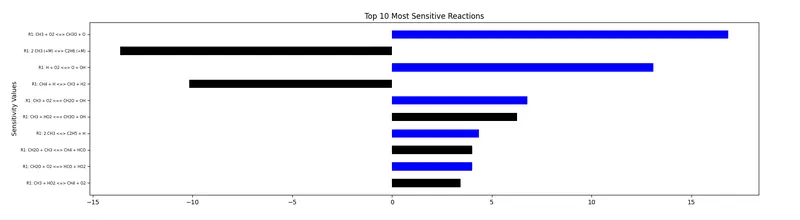
and that for the top 20 most sensitive reactions is:
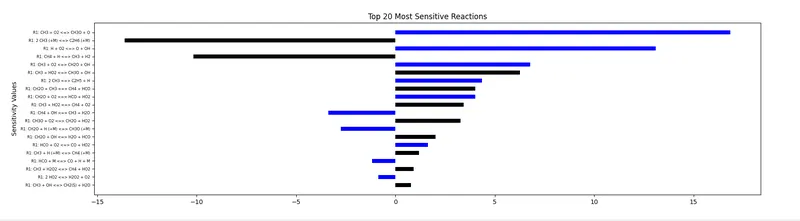
As, we can see above, these are the reactions that can cause drastic changes to the combustion process if they are disturbed or altered in any way. Thus, we now have written a parametric program, in which, with a change in a single number, we can compute the desired number of sensitivity values of the involved reactions.