Week 6 - Data analysis
AIM:
Write a code which can perform tasks such as -
- Data Visualization : Take column values as input for respective column number and plot those values.
- Compatibility Check : Check if the provided data file (input file) is in appropriate format. If NOT, then print "File not recognized. Please provide a valid converge output file"
- Basic Performance Calculation :
- Calculate area under the curvre P-V
- Calculate power output of the engine
- Calculate specific fuel consumption for 20 micro grams of fuel consumed.
THEORY:
Data Analysis : It is the process of inspecting, cleansing, transforming, and modelling data with the goal of discovering useful information, informing conclusions, supporting decision-making. Data analysis has multiple facets and approaches, encompassing a diverse techniques under a variety of names, and is useful in different business, science, and social science domains. In today's business world, data analysis play a role of making decisions more scientific and helping businessess operate more efficiently.
In this assignment, along with file parsing, data visualization and file validation, we are also going to evaluate some basic performance calculations. These include:
- Area under the P-V curve : This can be achieved by performing trapezoidal integration which basically considers a small trapezoid with two consecutive values as its parallel side. Here it is also assumed that dx is not curved. This is achieved in python by using the np.trapz(y,x) function from the numpy module. The area under the curve is nothing but WORK DONE by the engine.
- Power Output of the given Engine : To calculate the power output of the engine in KW, we can use the formula - `(area * 10^3*2*pi*RPM)/60`. This will give us the value of power output of the engine is KW`
- Specific Fuel Consumption : This is nothing but the amount of fuel consumed by a vehicle for each unit of power output. This can be calculated using the formula - fuel consumed per hour divided by power output of the engine.
CODE:
import matplotlib.pyplot as plt
import numpy as np
import sys
import math

col_name = []
col_values = {}

# File Validation
try:
	datafile=open('engine_data.out','r')
except:
	print('File not recognised. Please provide a valid CONVERGE output file.')
	sys.exit()

# declaring Column lists to store their respective values
for i in range(1,18):
		col_values[i] = []

# File Parsing
for line in open('engine_data.out','r'):


	if 'Crank' in line:
		for i in range(1,18):
			col_name.append(line.split()[i])
	if '#' not in line:
		temp=line.split()
		for i in range(1,18):
			col_values[i].append(float(temp[i-1]))

#Basic Performance Calculations

# Area under the P-V curve
pressure=1e6*np.array(col_values[2]) # Pa
volume=np.array(col_values[8])       #m^3
area=np.trapz(pressure,volume)
print('Area under the P-V curve is: ',area)

# Calculating the power output for the given engine |  RPM = 1500  |
engine_power=area*1e3*(2*math.pi*1500/60)	# power in KW
print('The Power Output of the engine is: ',engine_power,"KW")

#Calculation of specific fuel consumption
#specific_fuel_consumption = fuel consumed for each unit of power output
spc_fuel_consump=(20e-6*1500*60)/engine_power
print('Specific Fuel Consumption of the given engine is: ',spc_fuel_consump)

#Input specific code from which plots will be generated and saved

#Input
x=int(input("Enter x axis column:"))
y=int(input("Enter y-axis column:"))

# File plotting and Saving
filename=col_name[x-1]+" Vs "+col_name[y-1]
plt.plot(col_values[x],col_values[y])
plt.xlabel(col_name[x-1])
plt.ylabel(col_name[y-1])
plt.savefig(filename)RESULTS:
The results obtained for the above code are as shown below -

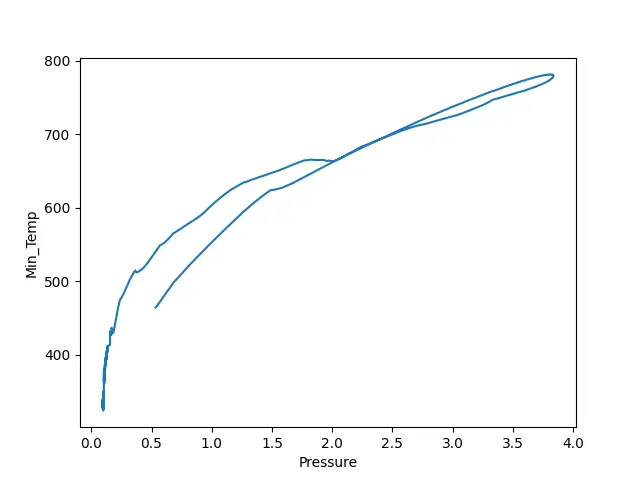
Here, we gave the input for x and y axis as column 2 and column 7 which are pressure and minimum temperature. Thus the above plot is Pressure Vs Minimum Temperature. Thus in this way we performed Data Analysis and did some basic performance calculations of the engine for which the data file was generated.