Parametric study on Gate valve.
A PARAMATIC STUDY ON THR GATE VALVE SIMULATION
l. OBJECTIVE
1. Simulate the flow of fluid through a gate valve.
2. Perform the paramatic study on the gate valve by setting design points corresponding to the positions of the lift of the spindle.
3. Calculate the mass flow rate corresponding to all the design points.
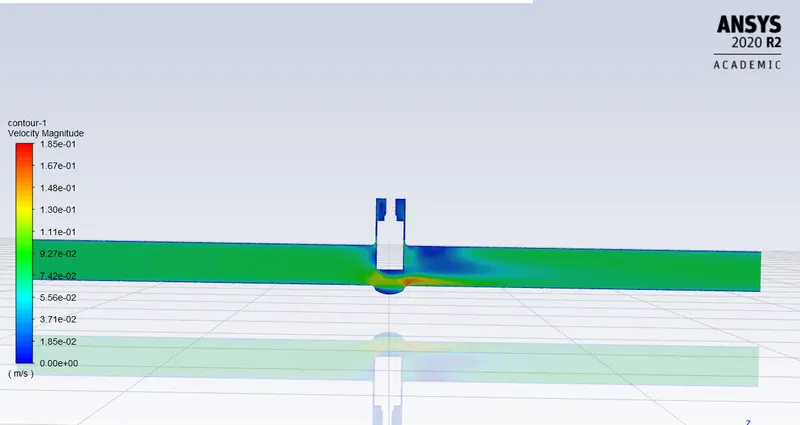
4. Display the velocity contours and animations corresponding to all the design points.
ll. INTRODUCTION
1. Gate Valve
A gate valve is a valve that opens by lifting barrier or gate out of the path of the fluid. Gate valves require very little space along the pipe axis and hardly restrict the flow of fluid when the gate is fully opened.
Gate valves are used to shut off the flow of liquids rather than for flow regulation. When fully open, the typical gate valve has no obstruction over fluid path, resulting in a very low fluid resistance.
The size of the open flow path generally varies in a nonlinear manner as the gate is moved. This means that the flow rate does not change evenly with stem travel. Depending on the construction, a partially open gate can vibrate from the fluid flow.
2. Parametric Studies
During the design of any component, we can ascertain the impact of changing certain parameters such as dimensional parameters in the design.
Prametric studies allow us to nominate parameters for eveluation, define the parameter range, specify the design constraints amd analyze the results of each parameter variation.
A parametric study requires the following:
- The design objective is set to Parametric dimensions.
- The parameters are nominated for use in the simualtion.
- The parameter ranges are identified.
- The design criteria are specified.
- Various configurations are generated.
After the configuration are successfully generated, we can evaluate the simulation. Further refinement of the parameters or design constraints can be carried out until obtaining desired results.
3. Flow Coefficient
The flow coefficient of a device is arelative measure of its efficiency at allowing fluid flow. It describes the relationship between the pressure drop across an oriface valve or othe assembly and the corresponding flow rate.
Mathematically the flow coefficient Cv(or flow-capacity rating of valve) can be expressed as:
`C_v=Qsqrt((SG)/(DeltaP)`
where:
- Q is the rate of flow (expressed in US gallons per minute).
- SG is the specific gravity of the fluid (for water = 1).
- `DeltaP`is the pressure drop across the valve (expressedd in psi).
In more practical terms, the flow coefficient Cv is the volume (in US gallons) of water at 60F that will flow per minute through a valve with a pressure drop of 1 psi across the valve.
The use of the flow coefficient offers a standard method of comparing valve capacities and sizing valves foe specific application that is widely accepted by industry. The general definition of flow coefficient can be excpanded into equations modeling the flow of liquids, gases and steam using the discharge coefficient.
4. Flow Factor:
The metric equivalent flow factor (Kv:commonly used in Europe and Asia) is calculated using metric units:
`K_v=Qsqrt((SG)/(DeltaP))`
where:
- Kv is the flow factor (expressed in `m^3.h^-1` ).
- Q is the flow rate (expressed in cubic meter per hour )
- SG is the specific Gravity of fluid (for water =1)
- `DeltaP`is the differential pressure across the device (expressed in [bar]).
`K_v` can be calculated from Cv using the equation:
`K_v` = 0.865.Cv
The `K_v` factor or value as it is also called is defined in VDI/VVDE Richtlinien NO. 2173. A simplified version of the definition is: The `K_v` factor of a valve indicates" The water flow in `m^3/h`, at a pressure drop across the valve of 1 kgf/`cm^2` when the valve is completely open. The complete definition also says that the flow medium must have a specific gravity of 1000 kg/`m^3` and a kinematic viscosity of `10^-6 m^2`/s. eg water"
lll. PROBLEM STATEMENT
1. The fluid flowing through the model is water.
2. The inlet gauge pressure is 10 Pa.
3. Observe the effect of lifting the Gate Disc at different amount of percentage from 10% to 80%.
lV. CASE SETUP
A. SPACECLAIM GEOMETRY
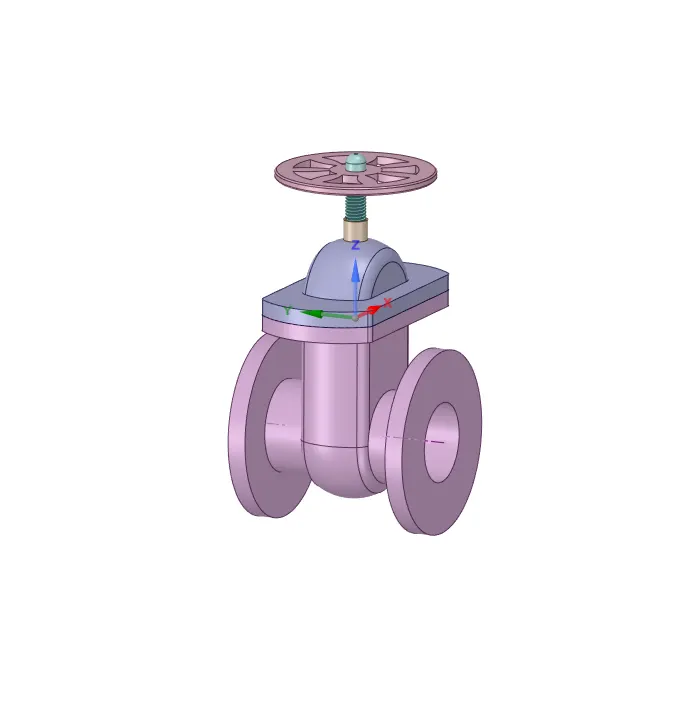
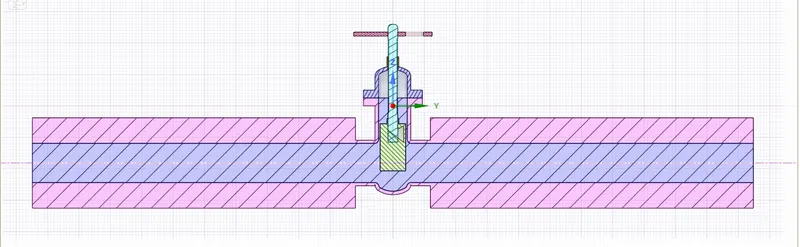
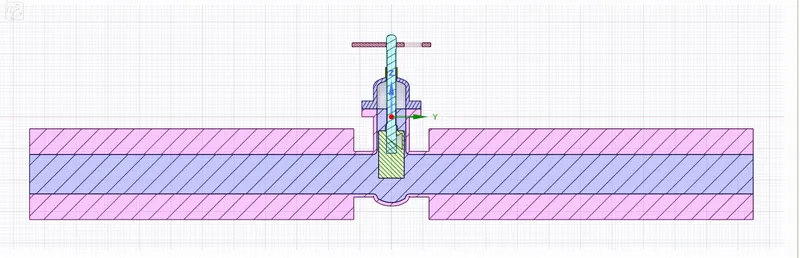
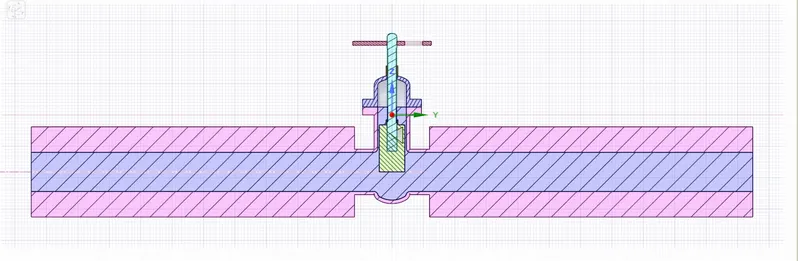
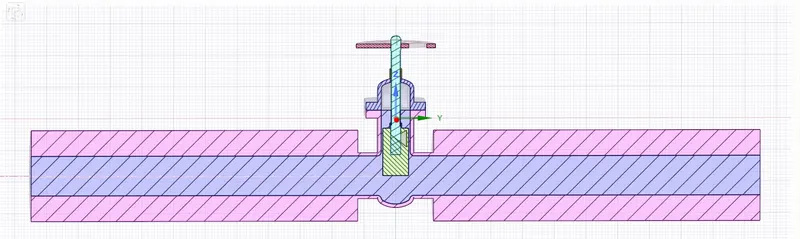
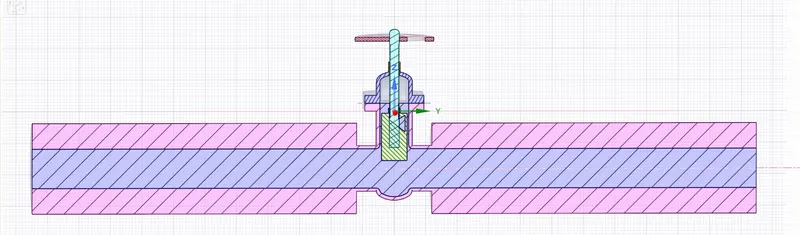
1. Solid Model
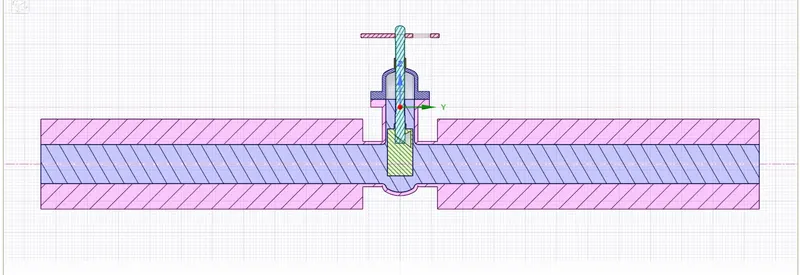
2. Initial Lift
Hide the "Bottom " Part , so we can claerly see the "Gate Disc".
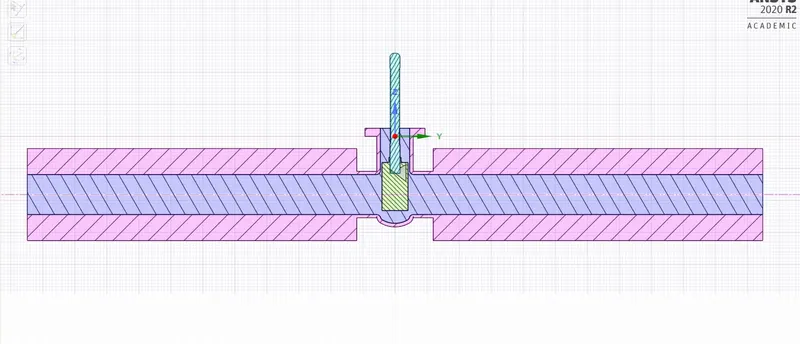
- Then Select "Gate Disc" component and move it in upward direction by "10 mm" lift.
- To analyze the flow and its effects, we must allow the flow, and for that we have given "10 mm" lift to the "Gate Disc".
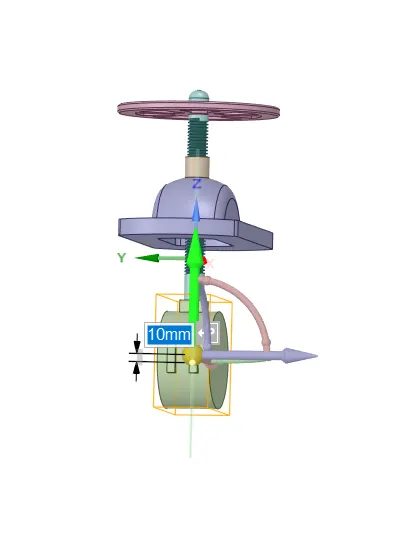
- Here we can see the green color arrow in upward direction, which shows the movement of "Gate Disc" in positive Z-Direction.
- Also we can see the symbol of "P".
- This symbol "P" is used to parametize the lift of the "Gate Disc".
- After selecting the symbol "P", it turns in Grey color, and message shows that a Group has been vreaated for lift.
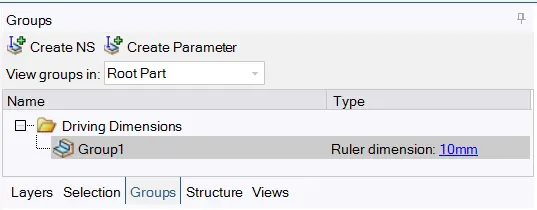
- Created group for lift parameter shown in above image.
- On the Left Side, in Tree Structure,if we see the group options, we can see created group and the amount of parameter, which has been set 10 mm lift.
- We can simply change the value of parametrs from there directly.
3. Fluid Volume
- After lifting the "Gate Disc ", move the both faces at the inlet and outlet of the "Bottom" part by amount of 800 mm just to see the fluid flow and its effects as given below:
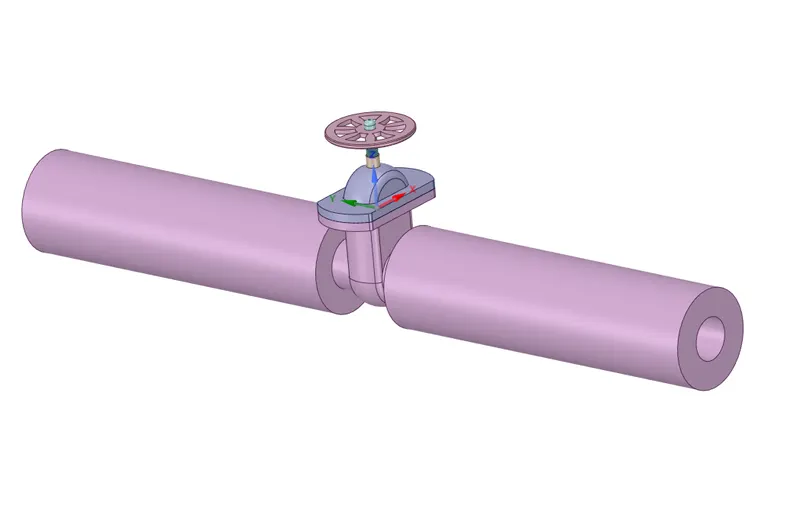
- After extension, create Fluid Voume by selecting inlet, outlet and upper edge of the "Bottom" part.
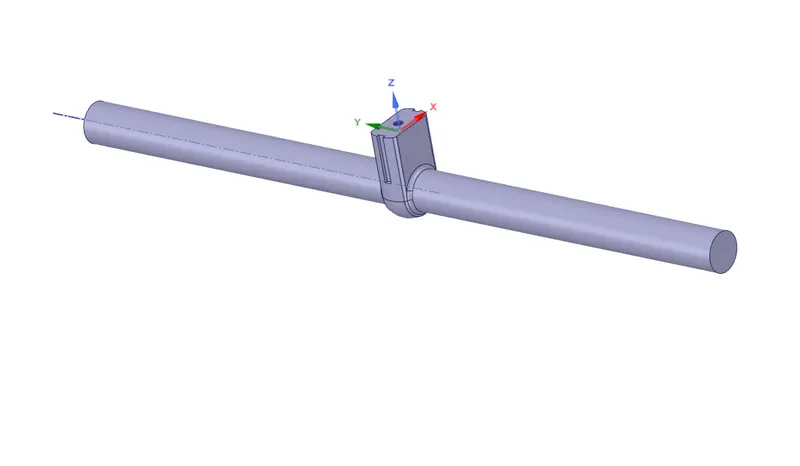
- Creation of fluid volue will be as given below:
B. BOUNDARIES
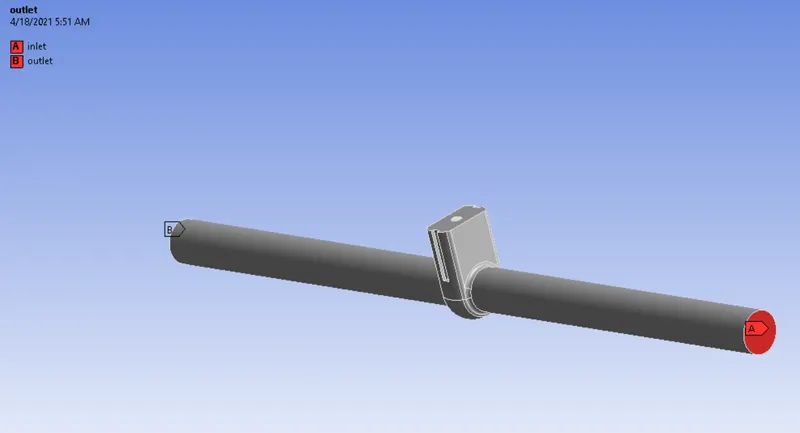
The boundaries of the geometry are generated using the named selection feature of Ansys-
1. Inlet
2. Outlet
C. MESH SETTING
1. Element Order: Linear
2. Element Size: 0.0055 m
3. Number of Nodes: 98581
4. Number of Elements: 491116
Figure 1 - Generated Mesh
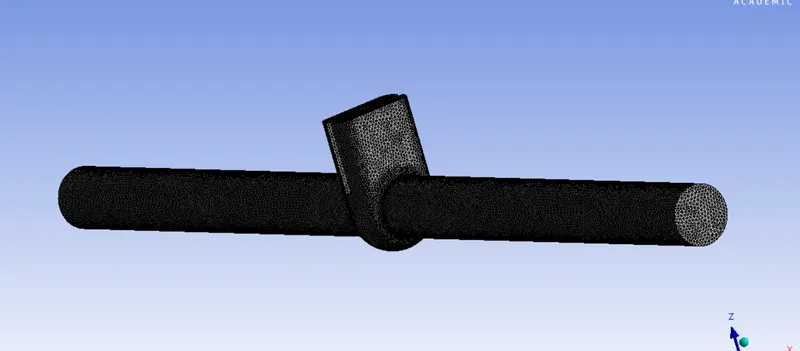
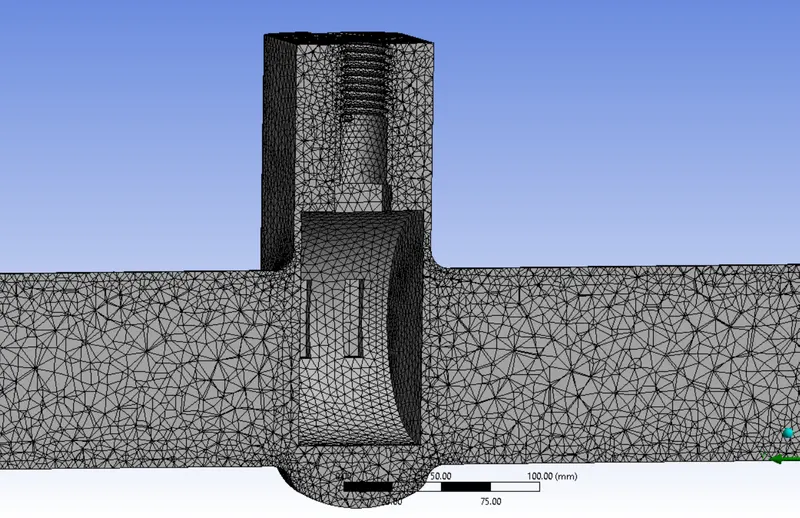
Figure 2 - Section Plane
5. Element Quality of Generate Mesh
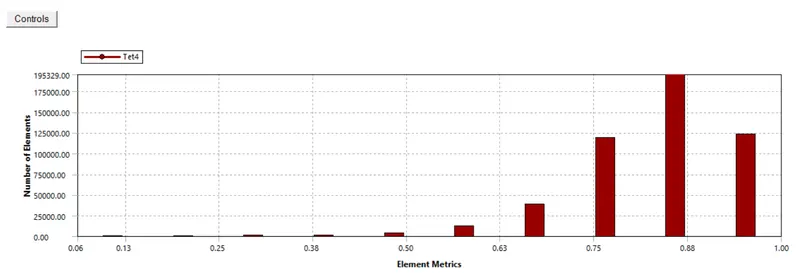
The lowest quality of the element is above 6% & hence can be considered acceptable in the given case setup.
D. SIMULATION SETUP
1. Solver: Steady
2. Type: Pressure Based
3. Gravitational Acceleration:
- X: 0 `m/s^2`
- Y: 0 `m/s^2`
- Z: -9.81 `m/s^2`
4. Turbulence Model: Realizable k- epsilon with Standard Wall Function
5.Cell Zone Condition:
- Fluid: Water
6. Material Specifications:
- Material: water-liquid(h2o)
- Chemical Formula: `H_2o`
- Density: 998.2 `(kg)/m^3`
- Viscosity: 0.001003 `(kg)/(m-s)`
6. Boundaries:
- Inlet: Pressure = 10 Pa(Gauge Pressure)
- Outlet: Pressure= 0 Pa (Gauge Presssure)
7. Solution Methods: Coupled
8. Initialization:
- Method: Standard Initialization from the Inlet
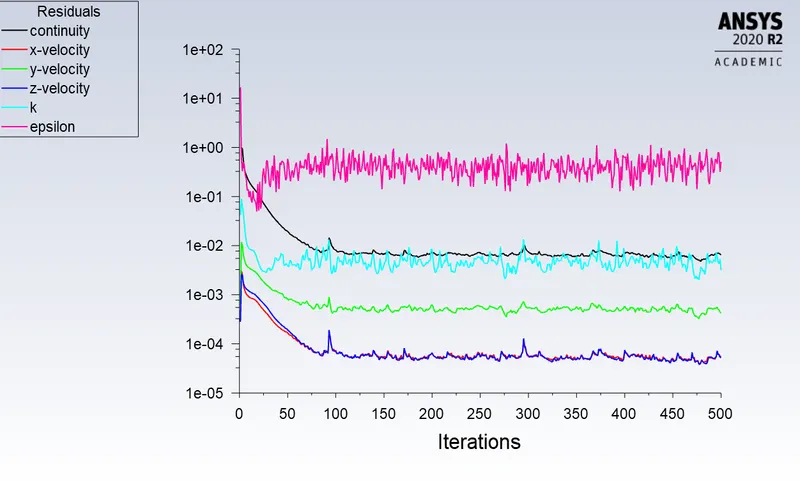
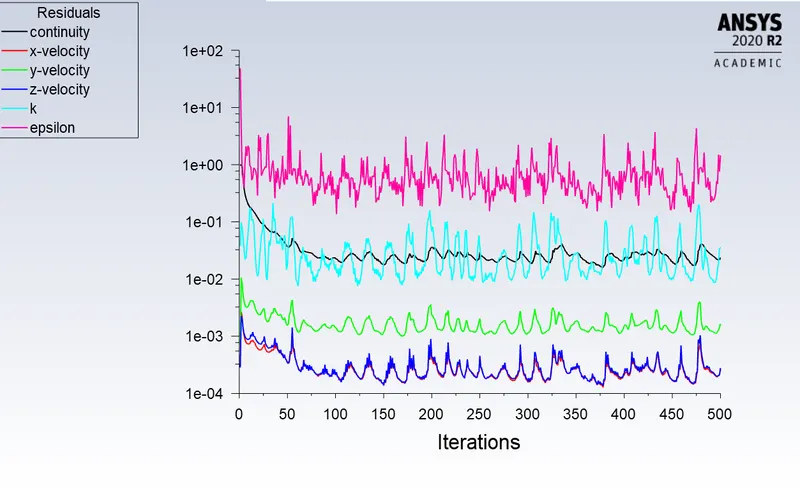
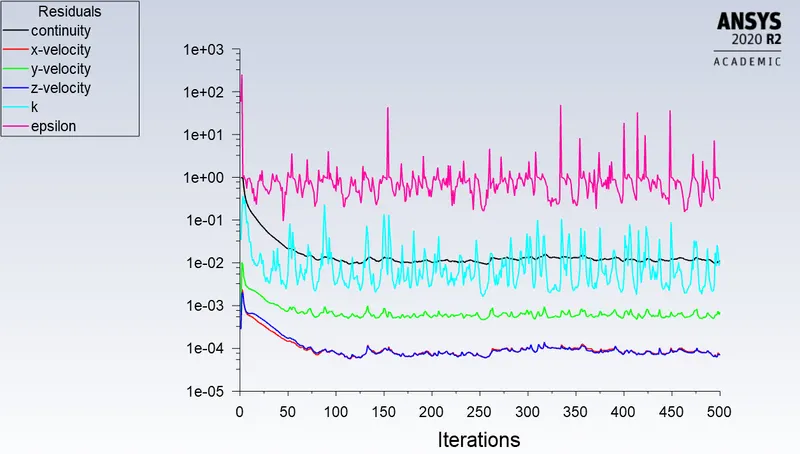
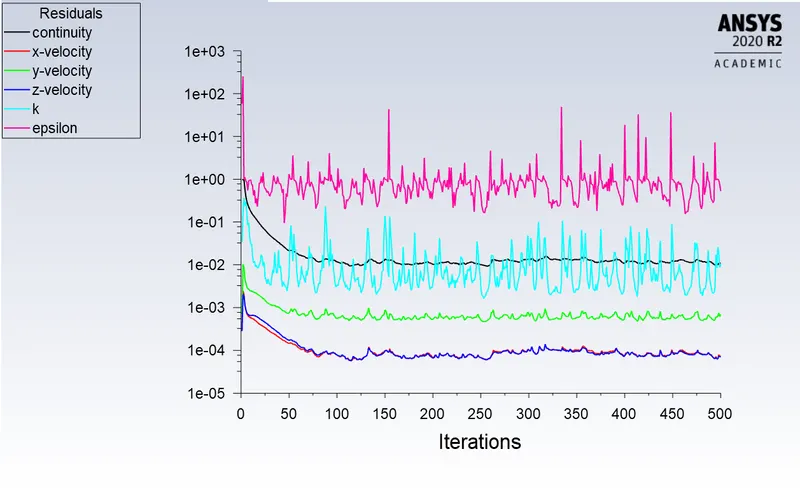
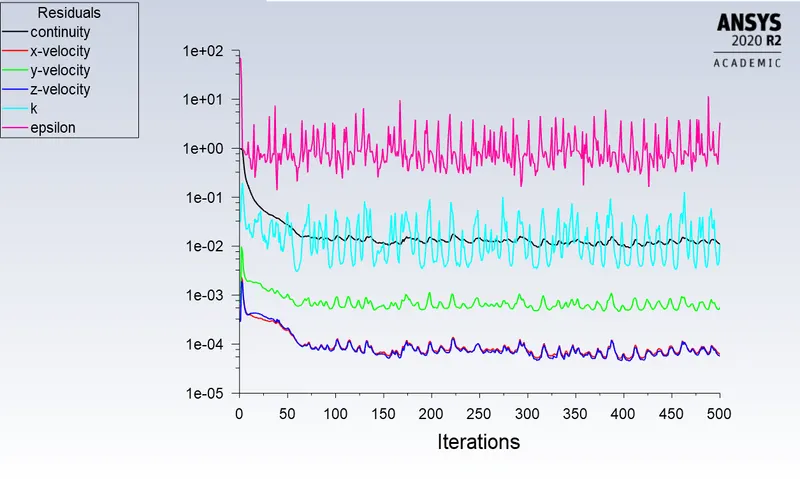
- Number of Iteration: 500
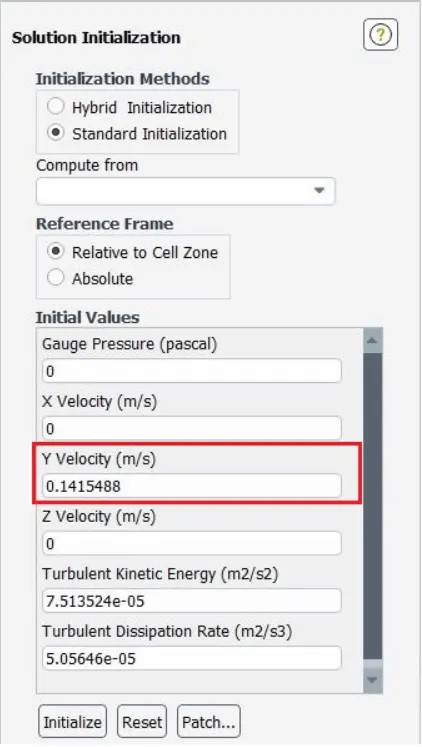
In above image, we can see that Velocity at the inlet will be 0.1415488 m/s in Y-direction
So, for Reynolds No,
`rho =998.2 (kg)/m^3`
V = 0.14145488 m/s
D = 0.1 m
`Re = [rho*V*D]/mu`
= [998.2*0.1415488*0.1]/0.001003
= 14087.14
- Here, reynolds No is 14087.14, which is more than 2000.
- So the flow is turbulent.
- So the viscous model will be K-Epsilon.
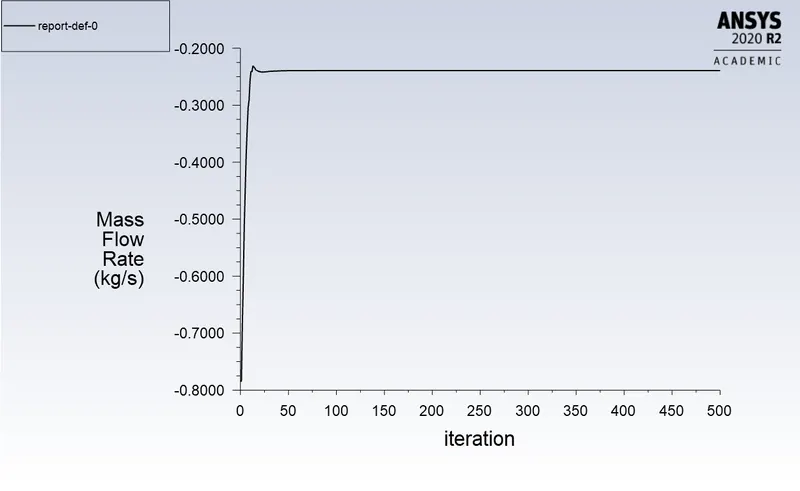
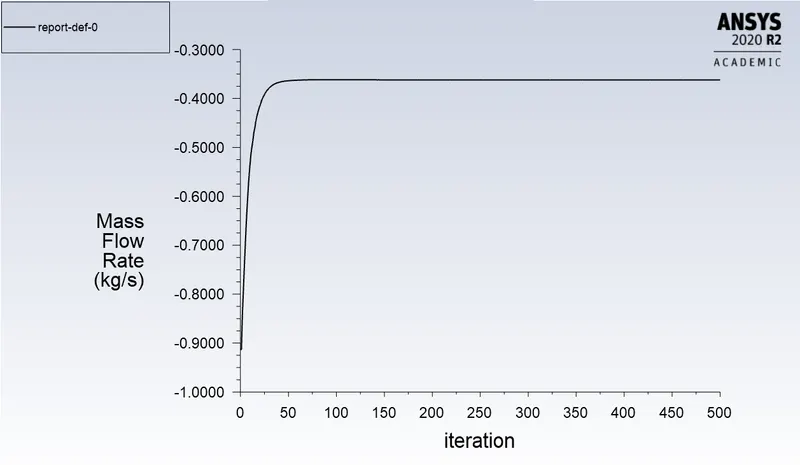
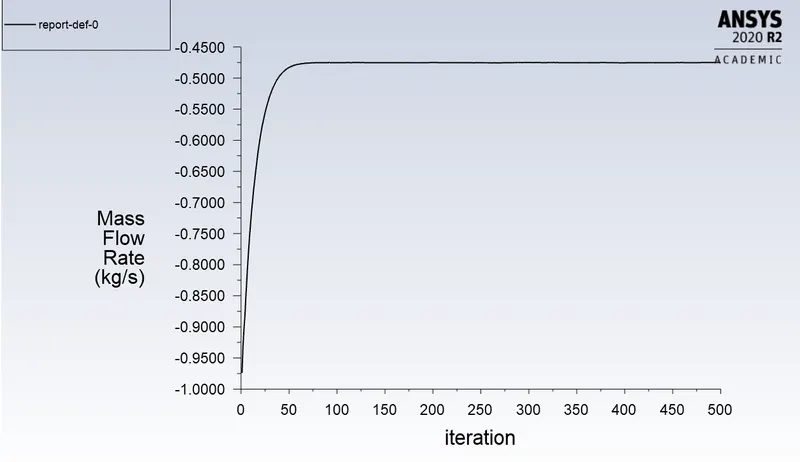
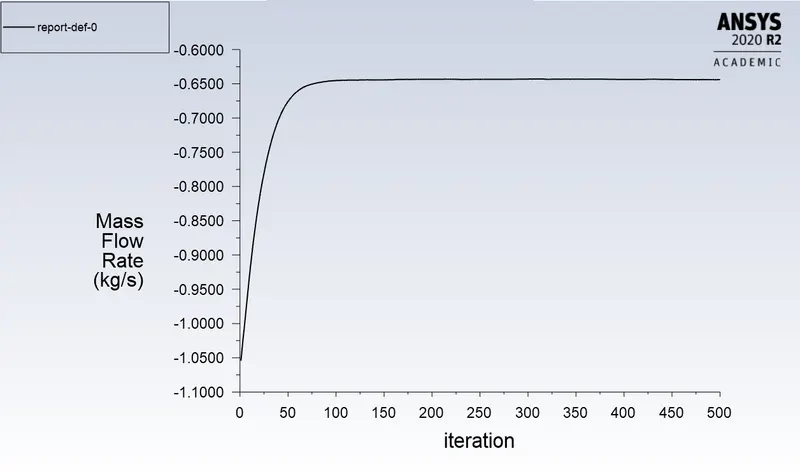
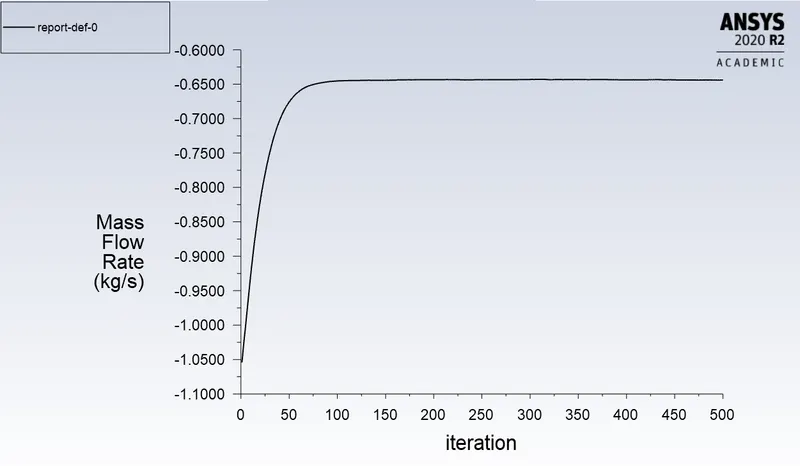
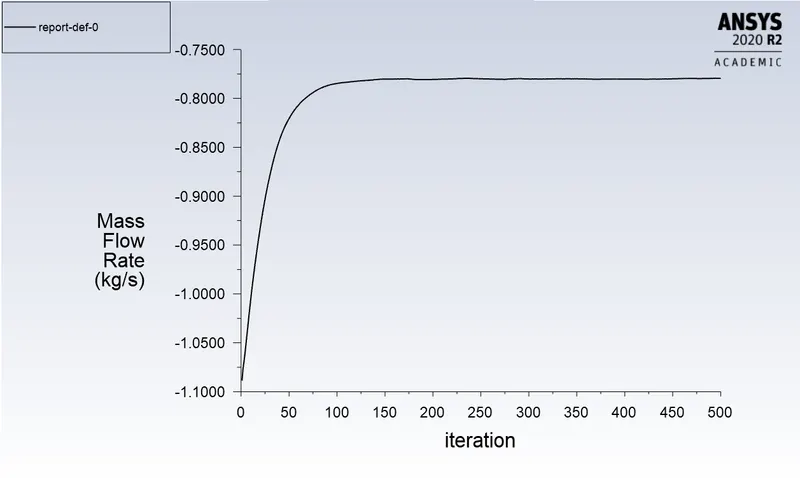
- After initialization, Report Definitions for the report of Mass Flow Rate at the Outlet is created.
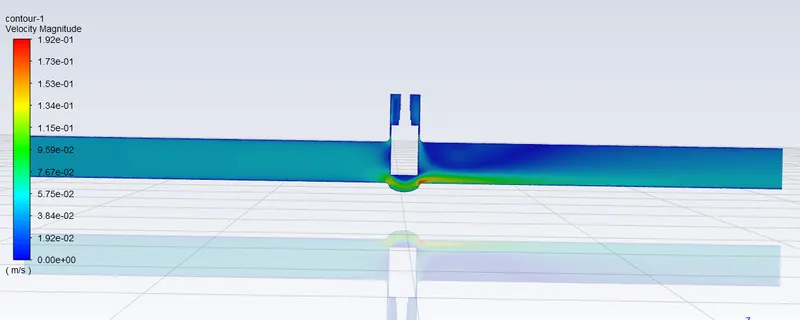
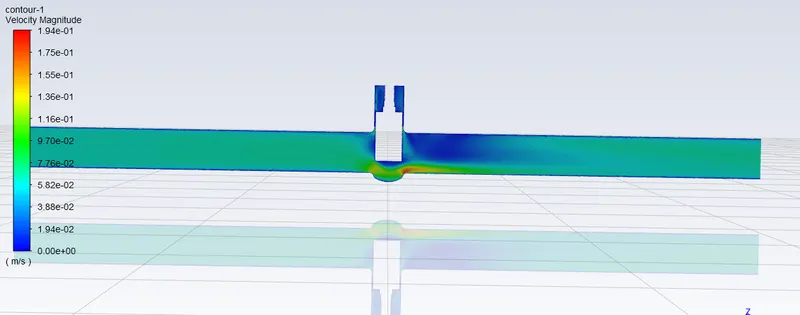
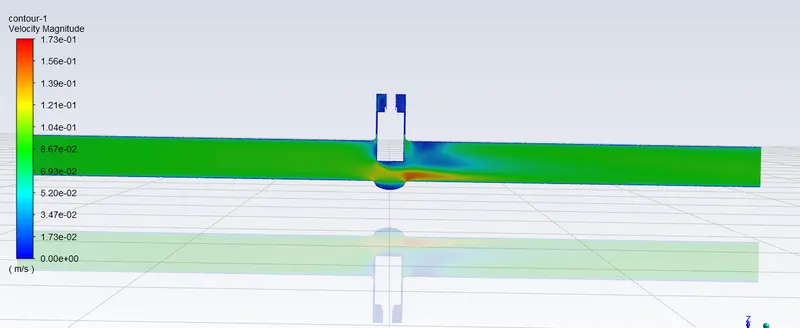
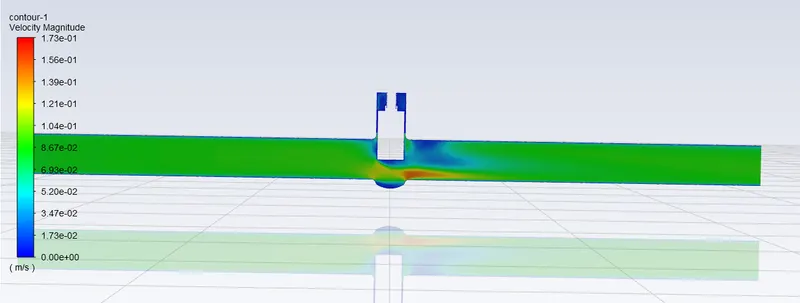
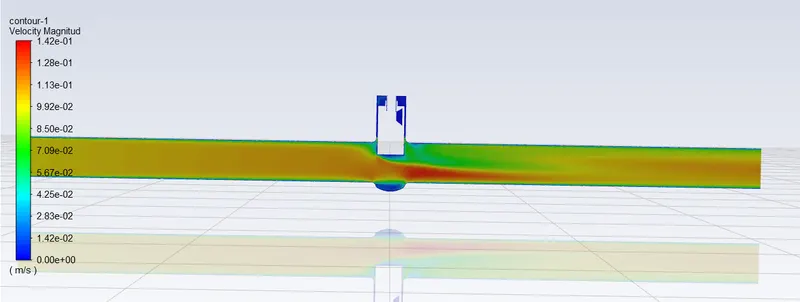
- Also Contours for Velocity Magnitudes is created.
- Animations for the flow of water inside Gate Valve based on Contours is created.
V. OUTPUT
A] Parametric Study Of Mass Flow Rate
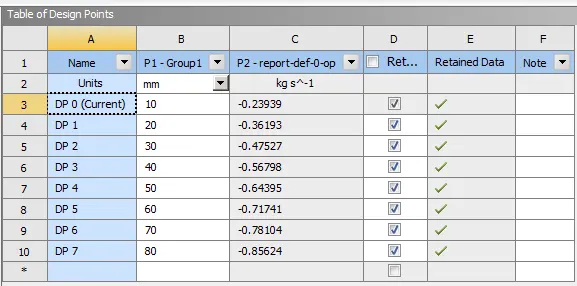
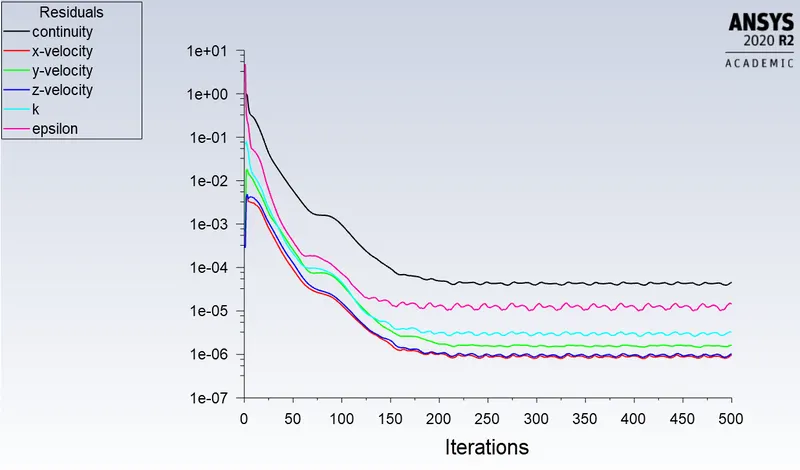
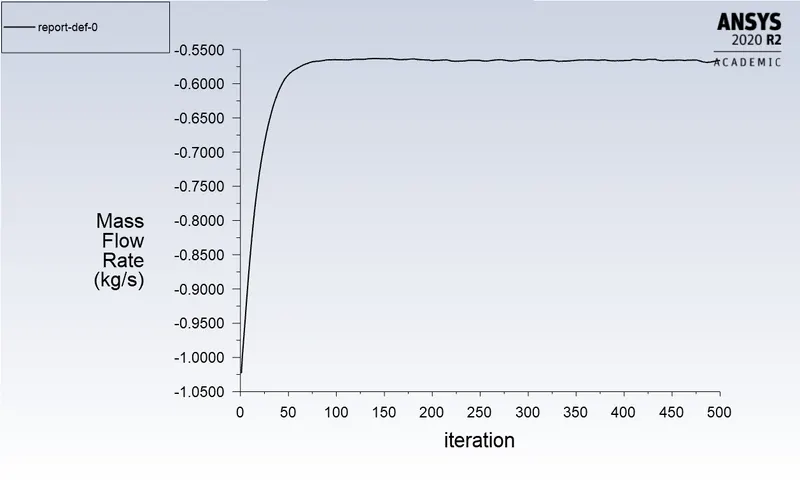
1) Case 1: Lift = 10 mm
2) Case 2: Lift = 20 mm
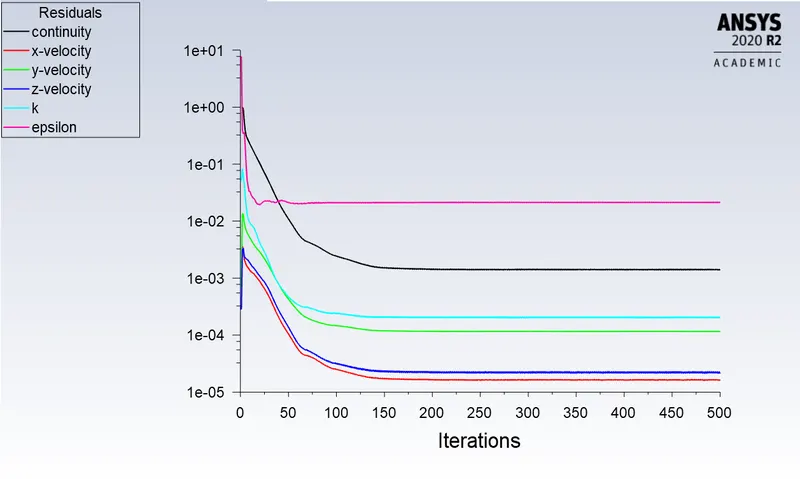
3) Case 3: Lift = 30 mm
4) Case 4: Lift = 40 mm
5) Case 5: Lift = 50 mm
6) Case 6: Lift = 60 mm
7) Case 7: Lift = 70 mm
B] Flow Coefficient And Flow Factor
|
Specific Gravity: 1gm/cc, Density of water: 998.2kg/m^3 Pressure inlet: 10 Pa = 0.00145038 Psi =1e-4 bar |
|||||
|
Lift Of Gate Disc mm |
Mass Flow Rate Kg/s |
Volume Flow Rate m3/hr |
Volume Flow Rate Gallons/mins |
Flow Coefficient Cv |
Flow Factor Kv |
|
10 |
0.23939 |
0.861804 |
3.7944088568 |
99.6458 |
86.192 |
|
20 |
0.36193 |
1.302948 |
5.7367074546 |
150.653 |
130.31 |
|
30 |
0.47527 |
1.710972 |
7.5331830795 |
197.828 |
171.12 |
|
40 |
0.56798 |
2.044728 |
9.0026665379 |
236.419 |
204.50 |
|
50 |
0.64395 |
2.31822 |
10.20681559 |
268.043 |
231.85 |
|
60 |
0.71741 |
2.582676 |
11.371180325 |
298.619 |
258.30 |
|
70 |
0.78104 |
2.811744 |
12.379736386 |
325.106 |
281.21 |
|
80 |
0.85624 |
3.082464 |
13.571680687 |
356.407 |
308.29 |
Vl. RESULT
1. The negative mass flow rate at the outlet indicates that the fluid is flowing out of the system.
2. The mass flow rate increases with an increase in the lift of the spindle.
3. The flow factor and flow coefficient are proprtional to each other.
Vll. CONCLUSION
The flow of water through a gate valve at different design points is accuratly simulated using a parametric study. The values of the mass flow rate at the outlet are also calculated and analyzed for all the design points.