Week 6 Fuel cell powered vehicle model
Q) Make a MATLAB model of fuel cell powered electric vehicle and comment on results
ans -
we will see MATLAB model of fuel cell powered electric vehicle first we will focus on what is fuel cell
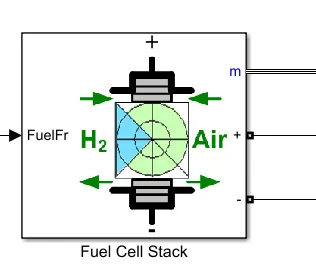
the block used in matlab for fuel cell
Library
Simscape / Electrical / Specialized Power Systems / Electric Drives / Extra Sources
Description
The Fuel Cell Stack block implements a generic model parameterized to represent most popular types of fuel cell stacks fed with hydrogen and air.
The block represents two versions of the stack model: a simplified model and a detailed model. You can switch between the two models by selecting the level in the mask under Model detail level in the block dialog box.
Simplified Model
This model is based on the equivalent circuit of a fuel cell stack shown below:
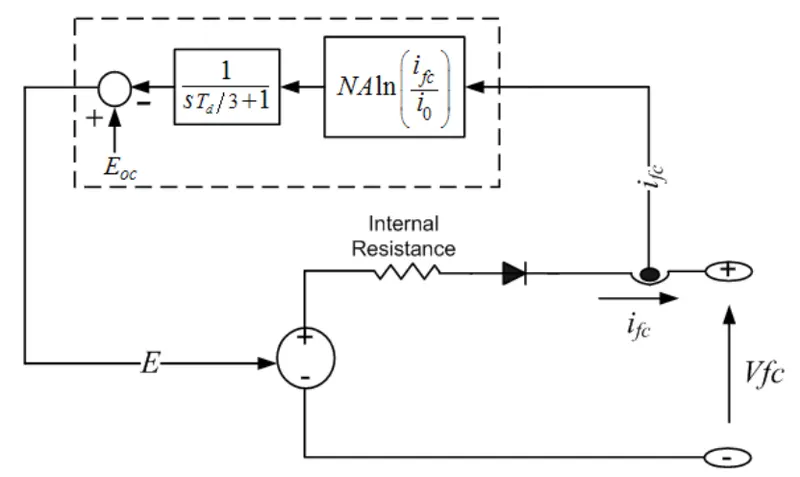
The simplified model represents a particular fuel cell stack operating at nominal conditions of temperature and pressure. The parameters of the equivalent circuit can be modified based on the polarization curve obtained from the manufacturer datasheet. You just have to input in the mask the value of the voltage at 0 and 1 A, the nominal and the maximum operating points, for the parameters to be calculated.
A diode is used to prevent the flow of negative current into the stack. A typical polarization curve consists of three regions:
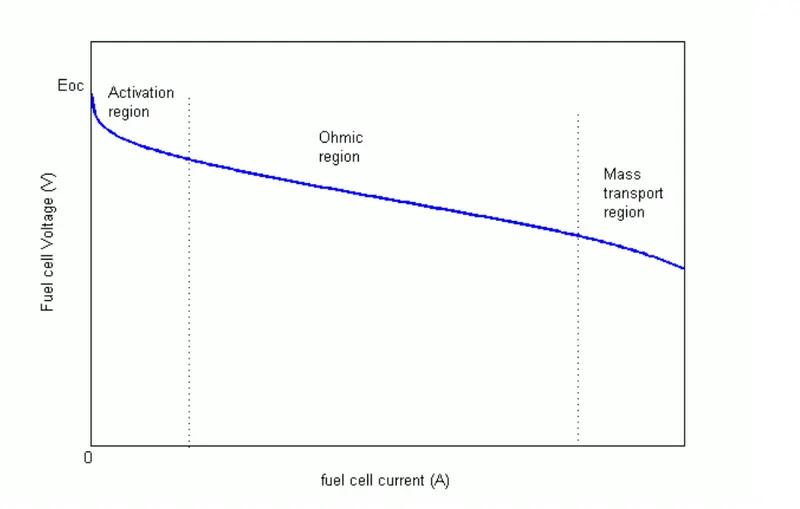
The first region represents the activation voltage drop due to the slowness of the chemical reactions taking place at electrode surfaces. Depending on the temperature and operating pressure, type of electrode, and catalyst used, this region is more or less wide.
The second region represents the resistive losses due to the internal resistance of the fuel cell stack.
Finally, the third region represents the mass transport losses resulting from the change in concentration of reactants as the fuel is used.
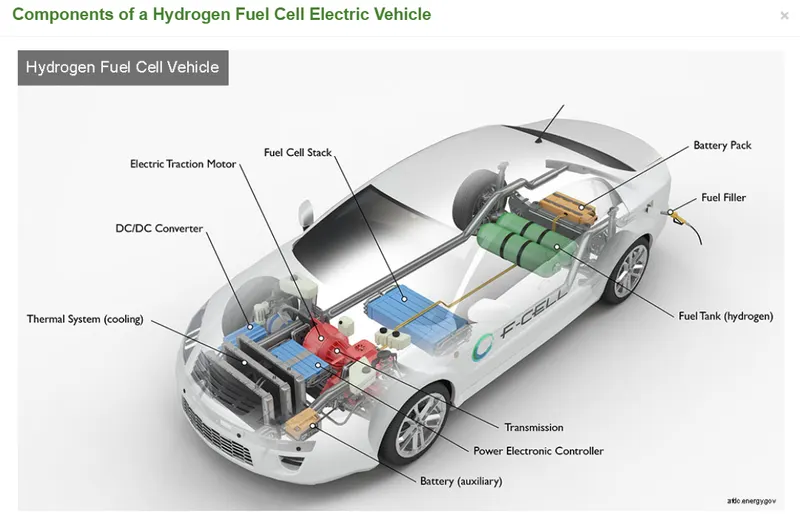
How Do Fuel Cell Electric Vehicles Work Using Hydrogen?
Like all-electric vehicles, fuel cell electric vehicles (FCEVs) use electricity to power an electric motor.
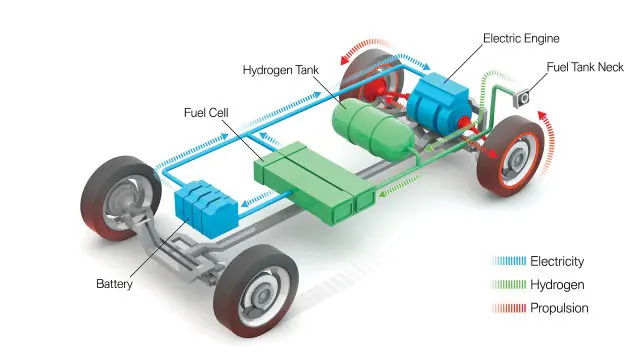
In contrast to other electric vehicles, FCEVs produce electricity using a fuel cell powered by hydrogen, rather than drawing electricity from only a battery. During the vehicle design process, the vehicle manufacturer defines the power of the vehicle by the size of the electric motor(s) that receive electric power from the appropriately sized fuel cell and battery combination. Although automakers could design an FCEV with plug-in capabilities to charge the battery, most FCEVs today use the battery for recapturing braking energy, providing extra power during short acceleration events and to smooth out the power delivered from the fuel cell with the option to idle or turn off the fuel cell during low power needs.
The amount of energy stored onboard is determined by the size of the hydrogen fuel tank. This is different from an all-electric vehicle, where the amount of power and energy available are both closely related to the battery's size.
https://americanhistory.si.edu/fuelcells/basics.htm
fuel cell working.
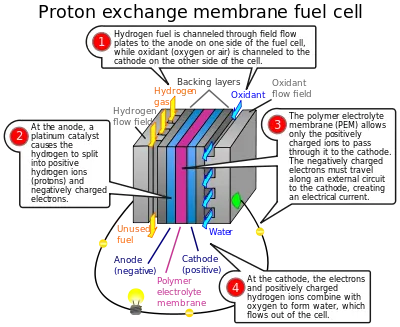
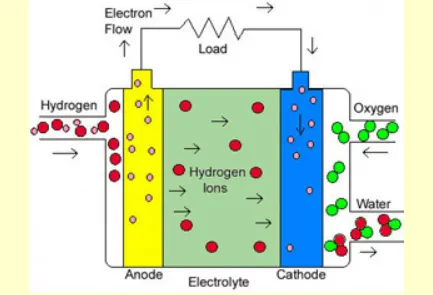
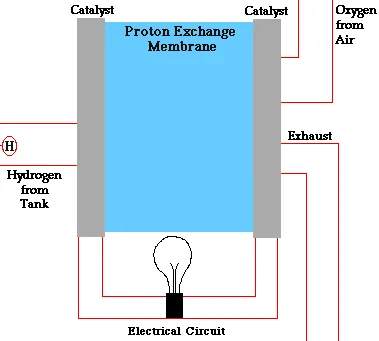
How does a hydrogen fuel cell work and its chemestry
Hydrogen gas is supplied to the anode of the fuel cell. The anode is coated with platinum, which acts as a catalyst to break down the hydrogen into protons and electrons. If a circuit is connected between the anode and cathode then the electrons can travel through the circuit and provide power to any load that is connected as part of the circuit.
Reaction at the anode:
2H2 → 4H+ + 4e−
This is an example of an oxidation reaction.
The flow of electrons through the load is the electric current that is generated by the fuel cell.
The hydrogen ions (protons) that are produced from the hydrogen at the anode travel through the electrolyte in the fuel cell to the cathode. Oxygen supplied to the cathode reacts with these hydrogen ions and electrons arriving via the external circuit to produce water and heat, both of which are removed from the fuel cell.
Reaction at the cathode:
O2 + 4H+ + 4e− → 2H2O
This is an example of a reduction reaction.
In a PEM fuel cell bipolar plates are positioned at either side of the cell. They help to distribute gases and also serve as current collectors. The electrolyte is contained in a membrane between the anode and cathode, which are all sandwiched between the bipolar plates. The membrane allows only protons to pass through and is called a proton exchange membrane, or PEM. In order to work properly the membrane must be kept moist.
A typical hydrogen fuel cell produces 0.5 V to 0.8 V per cell. To increase the voltage individual cells can be connected in series. This arrangement is called a fuel cell stack. The cross sectional area of a fuel cellaffects its ability to produce current. Greater area means more reaction sites, and this allows more current to be generated. Current times voltage equals power. So, by stacking cells in series to build voltage and increasing cell area to boost current, it is possible to generate very large amounts of electrical power‚ enough to supply a block of houses, a hospital, or a vehicle such as a car, bus, even a submarine or space capsule!
Each fuel cell technology has advantages and challenges. See how fuel cell technologies compare with one another. This comparison chart is also available as a fact sheet.
| FUEL CELL TYPE | COMMON ELECTROLYTE | OPERATING TEMPERATURE | TYPICAL STACK SIZE | ELECTRICAL EFFICIENCY (LHV) | APPLICATIONS | ADVANTAGES | CHALLENGES |
|---|---|---|---|---|---|---|---|
|
Polymer electrolyte membrane (PEM) mostly used |
Perfluorosulfonic acid | <120°C | <1 kW–100 kW | 60% direct H2; a 40% reformed fuel b |
Backup power Portable power Distributed generation Transportation Specialty vehicles |
Solid electrolyte reduces corrosion and electrolyte management problems Low temperature Quick start-up and load following |
Expensive catalysts Sensitive to fuel impurities |
| Alkaline (AFC) | Aqueous potassium hydroxide soaked in a porous matrix, or alkaline polymer membrane | <100°C | 1–100 kW | 60% c |
Military Space Backup power Transportation |
Wider range of stable materials allows lower cost components Low temperature Quick start-up |
Sensitive to CO2 in fuel and air Electrolyte management (aqueous) Electrolyte conductivity (polymer) |
| Phosphoric acid (PAFC) | Phosphoric acid soaked in a porous matrix or imbibed in a polymer membrane | 150°–200°C |
5–400 kW, 100 kW module (liquid PAFC) <10 kW (polymer membrane) |
40% d | Distributed generation |
Suitable for CHP Increased tolerance to fuel impurities |
Expensive catalysts Long start-up time Sulfur sensitivity |
| Molten carbonate (MCFC) | Molten lithium, sodium, and/or potassium carbonates, soaked in a porous matrix | 600°–700°C | 300 kW–3 MW, 300 kW module |
50% e |
Electric utility Distributed generation |
High efficiency Fuel flexibility Suitable for CHP Hybrid/gas turbine cycle |
High temperature corrosion and breakdown of cell components Long start-up time Low power density |
| Solid oxide (SOFC) | Yttria stabilized zirconia | 500°–1,000°C | 1 kW–2 MW | 60% f |
Auxiliary power Electric utility Distributed generation |
High efficiency Fuel flexibility Solid electrolyte Suitable for CHP Hybrid/gas turbine cycle |
High temperature corrosion and breakdown of cell components Long start-up time Limited number of shutdowns |
as we see which fuelcell block is used in matlab for simulation we see fuel cell basic working principle
now we will see the application of fuel cell stack supply to simple RL circuit
this fuel cell stack is connected through boost converter because the load requirement and the fuel cell electricity generation are needed to be matched and that matching is done by dc-dc converter
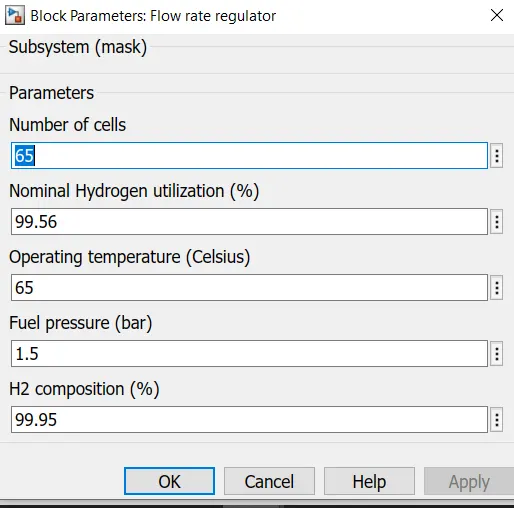
on input side we have fuel rate selector in liter/min and fuel rate regulator is going to work based on the current input so what ever is the current delivered by fuel cell stack it is taken as input and flow rate regulator will work as per parameters.
the fuel sell stackis model as per equivalent circuit model
this equivalent circuit model has dependent voltage source which is determine by dotted block and it is based on the current.
the open circuit vtg and Eoc and feedback current ifc will decide voltage E
the diode connected which mean the current in fuel cell will be always comming out so fuel cell cannot be recharge
the simulation will change fuel flow rate after some time and that is decided by the switch and this switch will change the fuel flow rate ,what happen when fuel flow rate change we can understand from this two scope
scope 2 show ---voltage and current on fuel cell side and voltage and current on load side which is after the boost converter.
to open this model type in connamd (power_fuel_cell)
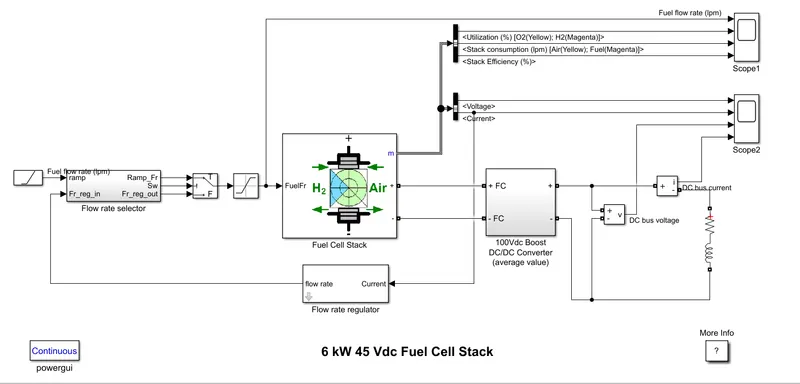
6 kW 45 Vdc Fuel Cell Stack
This example shows the Proton Exchange Membrane (PEM) Fuel Cell Stack model feeding an average value 100Vdc DC/DC converter.
Description
The nominal Fuel Cell Stack voltage is 45Vdc and the nominal power is 6kW. The converter is loaded by an RL element of 6kW with a time constant of 1 sec. During the first 10 secs, the utilization of the hydrogen is constant to the nominal value (Uf_H2 = 99.56%) using a fuel flow rate regulator. After 10 secs, the flow rate regulator is bypassed and the rate of fuel is increased to the maximum value of 85 lpm in order to observe the variation in the stack voltage. That will affect the stack efficiency, the fuel consumption and the air consumption.
Fuel cell voltage, current, DC/DC converter voltage and DC/DC converter current signals are available on the Scope2. Fuel flow rate, Hydrogen and oxygen utilization, fuel and air consumption, and efficiency are available on the Scope1.
Simulation
At t = 0 s, the DC/DC converter applies 100Vdc to the RL load (the initial current of the load is 0A). The fuel utilization is set to the nominal value of 99.56%. The current increases to the value of 133A. The flow rate is automatically set in order to maintain the nominal fuel utilization. Observe the DC bus voltage (Scope2) which is very well regulated by the converter. The peak voltage of 122Vdc at the beginning of the simulation is caused by the transient state of the voltage regulator.
At t = 10 s, the fuel flow rate is increased from 50 liters per minute (lpm) to 85 lpm during 3.5 s reducing by doing so the hydrogen utilization. This causes an increasing of the Nernst voltage so the fuel cell current will decrease. Therefore the stack consumption and the efficiency will decrease (Scope1).
CIRCUIT DIAGRAM
1) RAMP
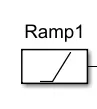
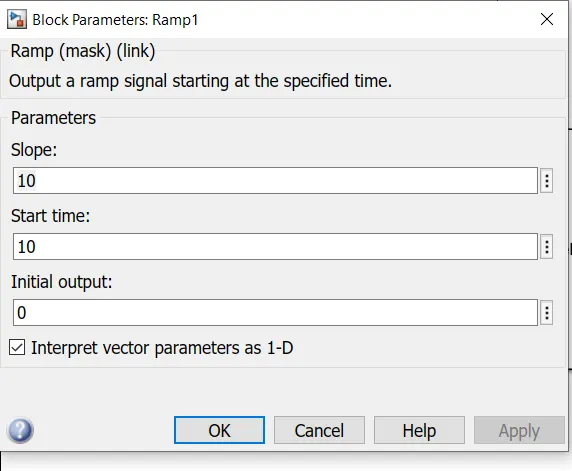
The Ramp block generates a signal that starts at a specified time and value and changes by a specified rate. The block's Slope, Start time, and Initial output parameters determine the characteristics of the output signal. All must have the same dimensions after scalar expansion.
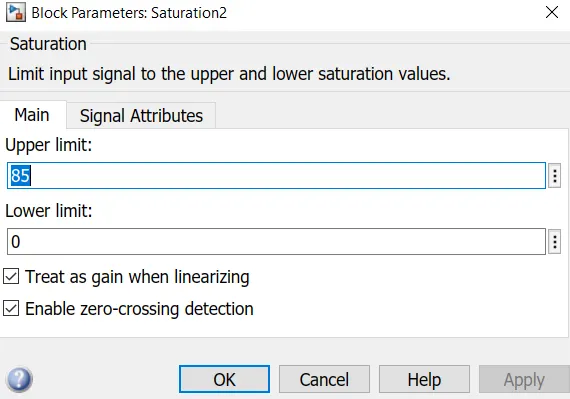
here you can edit start time of flow here it is 10 sec
Saturation
The Saturation block produces an output signal that is the value of the input signal bounded to the upper and lower saturation values. The upper and lower limits are specified by the parameters Upper limit and Lower limit.
fuel cell stack
we discuss at starting in detail its working principle ,its equivalent ckt ,etc
now we will se its parameters
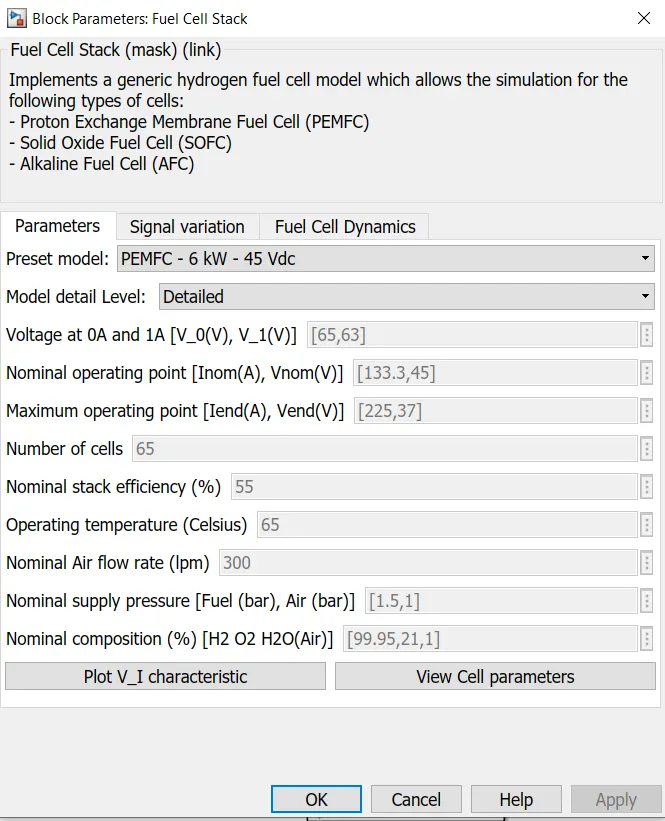
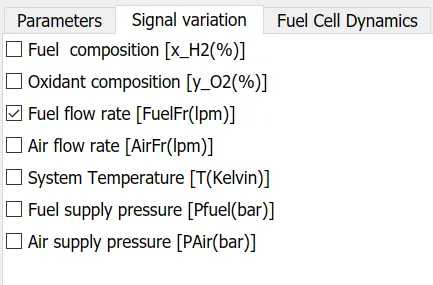
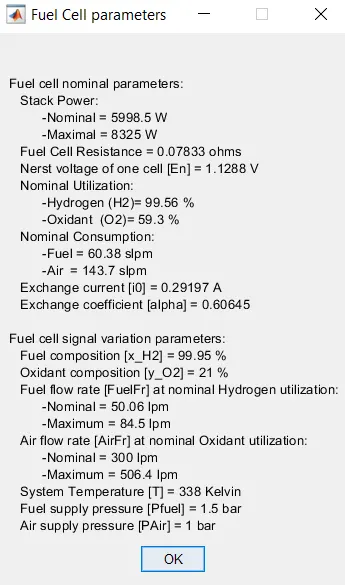
You can also se v-i characteristics of the cell
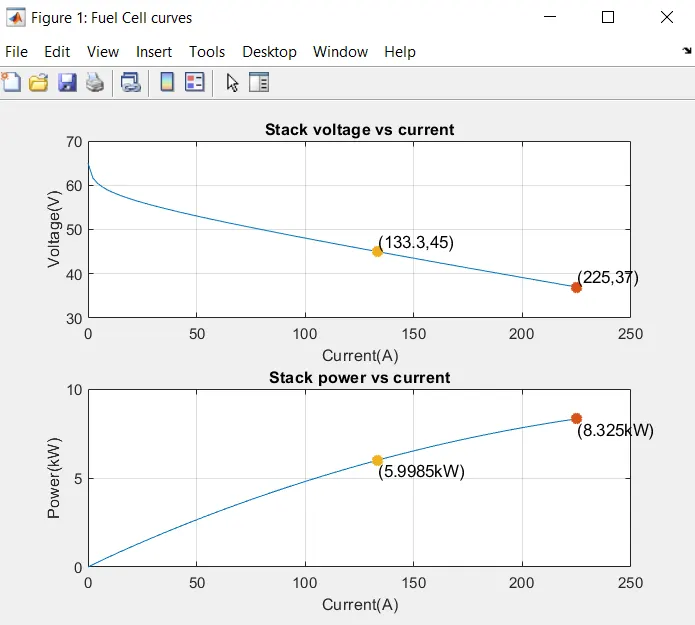
we have explain detail working at starting of assignment .
flow rate regulator
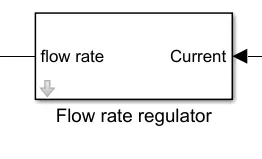
This block is flow rate regulator, which take input from output current and fed as feedback to the controller, Flow rate selector.
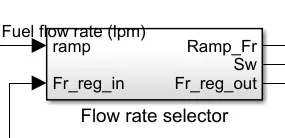
Flow Rate Selector:-
IN IT
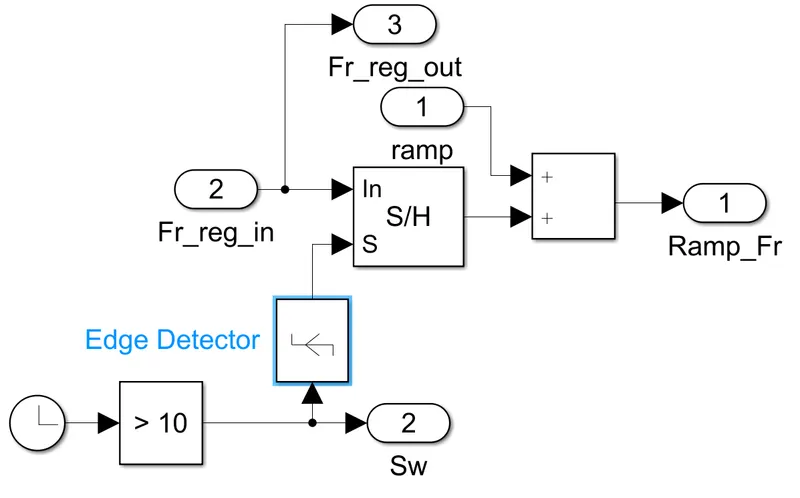
The circuit have a clock, which Output the current simulation time. A Compare to Constant block is setted up, which let the signal start after 10 sec. as it is using >10 operator. And pass it to the Edge Detector, Which detect the change of 10. Now the signal goes into Sample and Hold Block,
Where the holds it and pass it according to the values, Here circuit have 2(Fr_reg_in) for input. Where, if it doesnot satisfies, then will go into 3(Fr_reg_out). Again, the sample and hold block have an output to the Add Block, Where it is adding the values with Ramp 1 Output. Now, Add Block is taking that inputs and giving out to the Ramp_Fr.
SWITCH
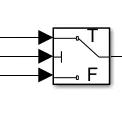
Combine multiple signals into single signal. The Switch block passes through the first input or the third input signal based on the value of the second input. The first and third inputs are data input. The second input is a control input. Specify the condition under which the block passes the
first input by using the Criteria for passing first input and Threshold parameters.
DC/DC Boost Converter:
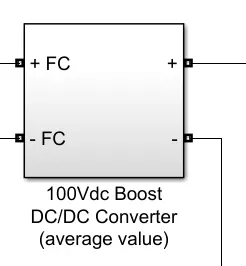
in it
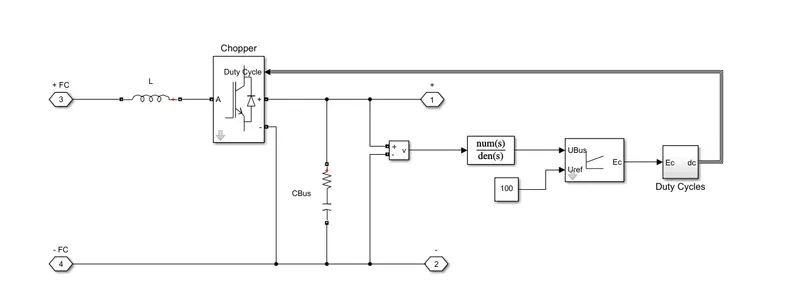
This is DC—DC Boost converter which boost the voltage level of Fuel Cell to match with the load requirement. In this block there is one chopper circuit, one practical capacitor is present, and according with the output Duty cycle of chopper is set.
RESULTS
simulation time 20sec
scope 2 show ---voltage and current on fuel cell side and voltage and current on load side which is after the boost converter.
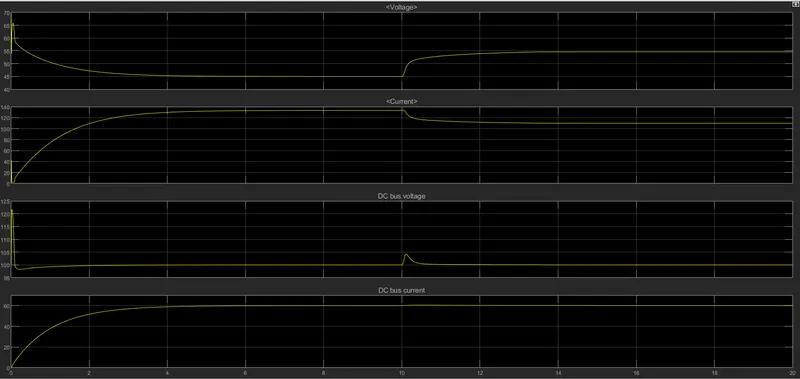
you will see there is voltage and current of fuel cell
the voltage is adjusted to 45 the movement it have been started because it is an RL load it will have exponential rise in the current and you will also observe exponential fall in voltage so this is about fuel cell voltage and current
at 10 sec we are increasing the flow rate therefore the voltage of the fuel cell increases and due to its inherent characteristics the current of the fuel cell stack is reducing
now ,
the effect of flow rate on output voltage , the load will not experience any transient because of control involve in it dc to dc converter , the dc to dc converter will not allow to have flucation in voltage any other than 100 voltage you will see little spike in voltage and current will also change a bit but not much, the load will not experience in change of flow rate .
scope 1) what happens to the fuel cell that is needed to be understood
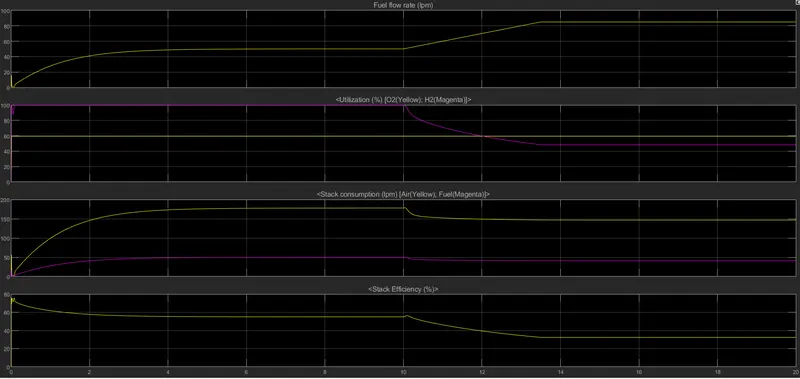
the fuel flow rate as we is change from 10th sec. from 10sec to 13.5 sec it is ramped up enitial flow rate was kept around 50 than 85 so from 50 to 85 flow rate what happen to Utilization(%) ,Stack consumption (lpm), Stack Efficiency (%)
in stack consumption the air consumption in yellow colour which reduces and fuel consumption also reduces in efficiciency it becomes lower , as we increase fuel flow rate voltage increases the current is also going to change and stack efficieny will also come down therefore at high flow rate stack efficiciency will become low it nearly become 30% from 50%
so this is what will happen in fuel cell.
this fuel cell stack will allow you to understand power delivery performance to various kind of load ,so this is fuel cell modelling in matlab
this fuel cell stack can be loaded with different dynamic loading conditions the current at load side will be of drive cycle requirement and you have to connect battery to have propercontrol of fuel flow rate if you do not control the fuel flow rate the efficiency is likely to suffer