Week 5 Battery characteristics using drive cycle
Q) Simulate generic battery model charge discharge using UDDS data.
ANS
The objective of the question can be divided into two parts where the first part is to model the battery and the second part is to analyze the charge /discharge characteristics for a specific drive cycle.
A driving cycle is a series of data points representing the speed of a vehicle versus time.
Driving cycles are produced by different countries and organizations to assess the performance of vehicles in various ways, as for example fuel consumption and polluting emissions. UDDS drive cycle.UDDS stands for Urban Dynamometer Driving Schedule.
the file we have attach to the assignment.
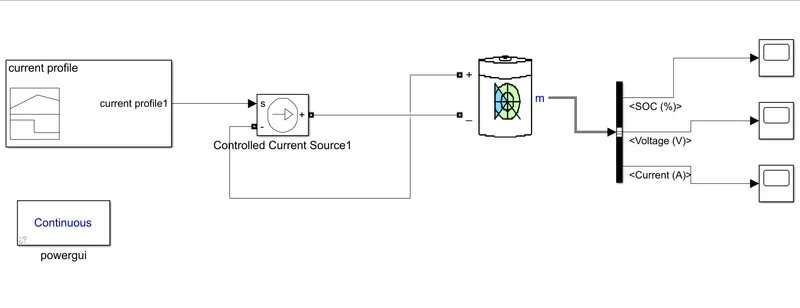
circuit diagram
Simulate generic battery model charge discharge using UDDS data
blocks used
1) signal builder block
2)controlled current source
3) li battery
1) signal builder block
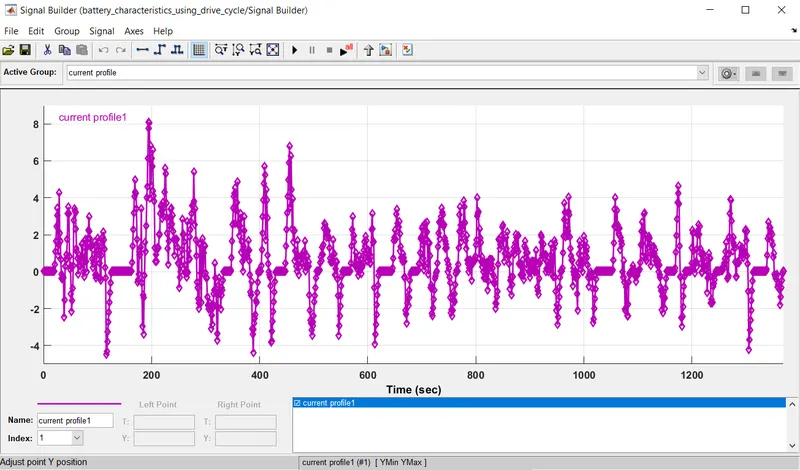
by the help of it we give drive cycle
Use a signal builder block to create the drive cycle data of the UDDS cycle. The limitation of the signal builder is that it accepts data in the form of only the current profile. , the speed v/s time data from drive cycle should be converted to its corresponding current profile with respect to time
the file we have attach to the assignment.
Driving Cycle Design
The "Drive-cycle" basically is the representative of the road. Drive cycles are used to reduce the expense of on road tests, time of test and fatigue of the test engineer. The whole idea is to bring the road to the test lab (a chassis dynamo-meter) or to the computer simulation.
Two kinds of drive cycle can be made. One is DISTANCE DEPENDENT (SPEED versus DISTANCE versus ALTITUDE) and the other one is TIME DEPENDENT (SPEED VS TIME VS GEAR SHIFT). The DISTANCE DEPENDENT is the actual replica of the test road whereas TIME DEPENDENT is the compressed version of the actual time taken to conduct the test on road. Examples of TIME DEPENDENT drive cycles are European NEDC cycle, FTP-75. TIME DEPENDENT drive cycles are used specifically for chassis dynamo meter testing because in a short time the results can be availed and repeated tests can be done easily.
In the Signal Builder window, create signals and define the output waveforms.
To open the window, double-click the block.
Now go to File > Import from file
A new window will open, click on Browse and select UDDS file.
In data to import box check Select all.
From the drop-down menu in “placement for selected data” click on “Appended selected signals to all group”.
Confirm selection > Apply > Ok
The following graph will be a highlight in signal builder block.
2) Controlled Current Source
Description
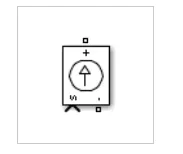
The Controlled Current Source block converts the Simulink input signal into an equivalent current source. The generated current is driven by the input signal of the block. The positive current direction is as shown by the arrow in the block icon.
You can initialize the Controlled Current Source block with a specific AC or DC current. If you want to start the simulation in steady state, the block input must be connected to a signal starting as a sinusoidal or DC waveform corresponding to the initial values.
3) PowerGUI
The powergui block allows us to choose one of these methods to solve your circuit:
Continuous, which uses a variable-step solver from Simulink
Discretization of the electrical system for a solution at fixed time steps
Continuous or discrete phasor solution
4) BATTERY
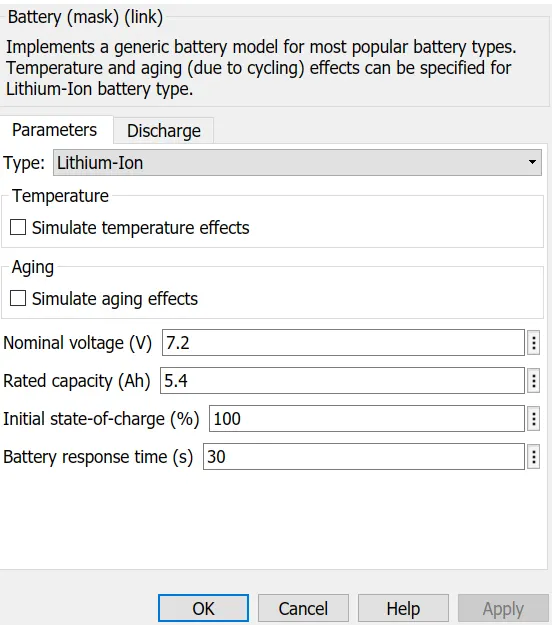
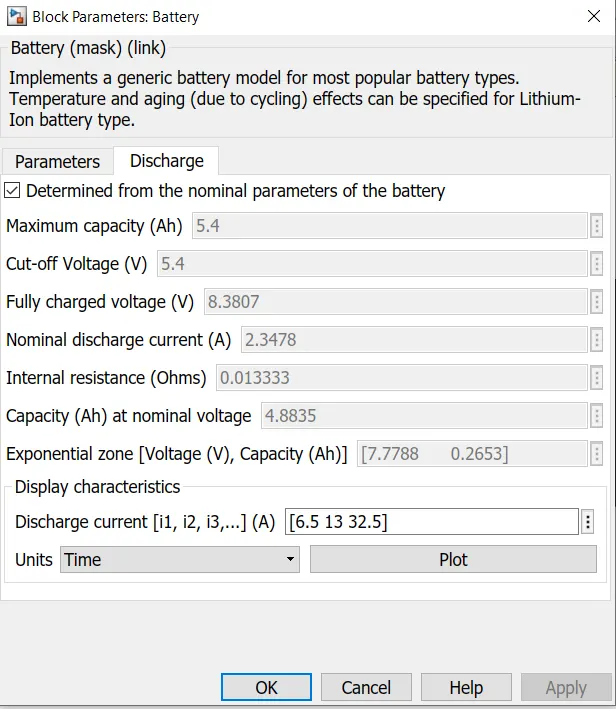
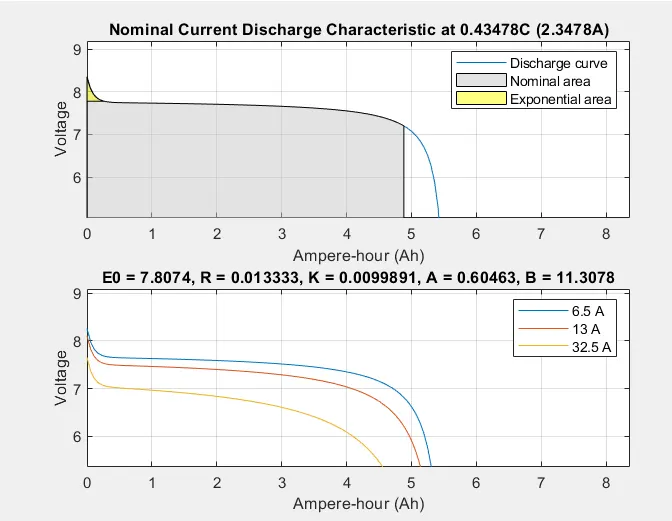
as current consumption increases battery capacity decreases
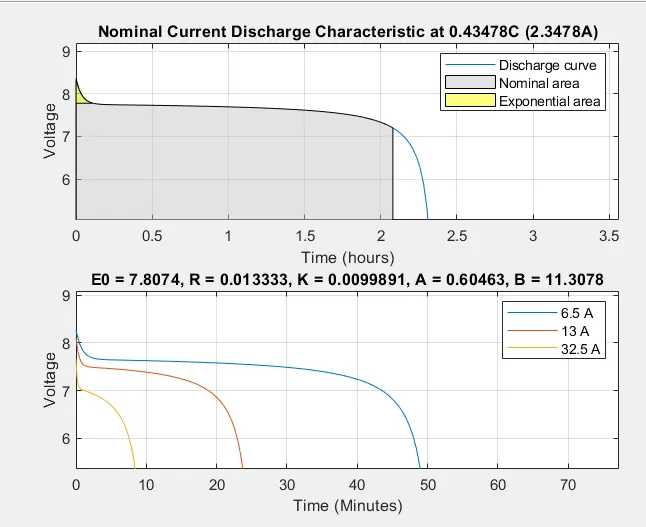
this are the plots of battery voltage vs time and voltage vs Ah
model
results
SOC
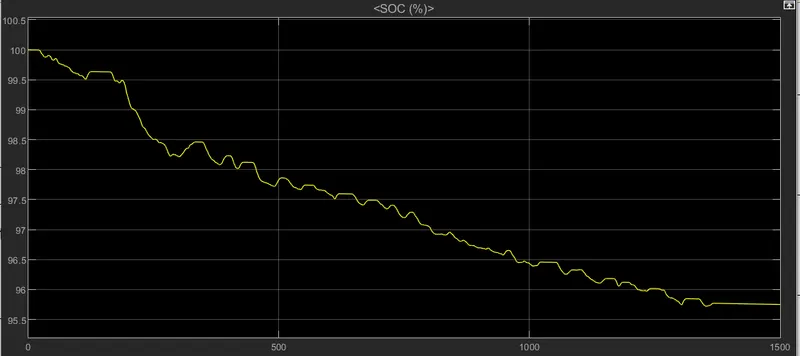
soc DUE TO DISCHARGE graph goes down and when braking takes place battery again charge .
VOLTAGE AND CURRENT
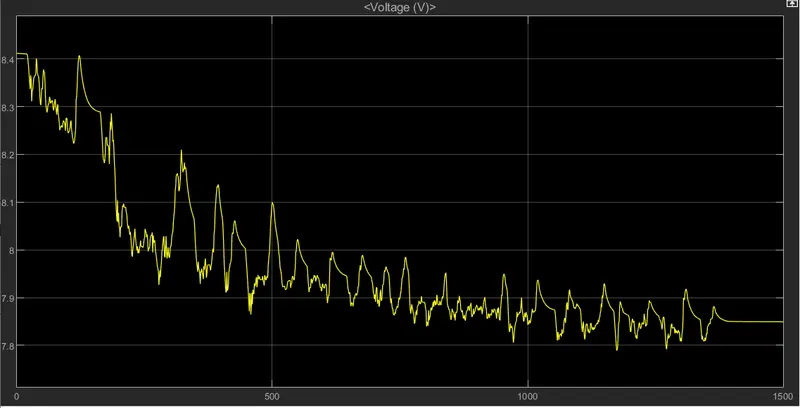
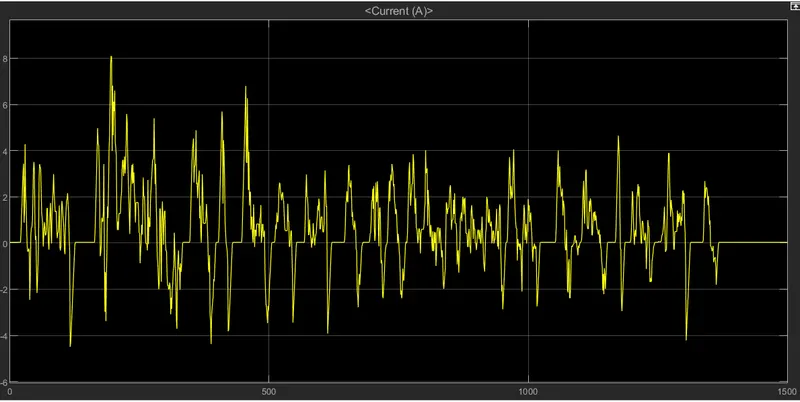
This graph for battery parameters,we can see the battery SOC goes up & down according with charging & discharging of battery. is in braking battery charges it shows
we Simulate generic battery model charge discharge using UDDS data,and this data is given by signal builder block and graph above shoes charge and discharge