Week-4 Challenge WOT Condition Part-2
Q.1: WHAT IS THE DIFFERENCE BETWEEN MAPPED AND DYNAMIC MODELS OF ENGINE, MOTOR, AND GENERATOR. HOW CAN YOU CHANGE THE MODEL TYPE.
Difference between mapped and dynamic models Engine, Motor, and Generator.
| features |
MAPPED In the mapped model is the data used for the operation and simulation are to be entered in a form of lookup table which would be then configured with the operational parts and the analysis would br formed. |
DYNAMIC In Dynamic model it understands the behavior of the specification part/element and then it behaves accordingly.it gives detailed analysis for the variations entered by us in the specifications whereas it simulates according to real and dynamic operation. |
| Advantage |
if the detailed specification/lookup table data is available with us the simulation becomes easier and it gives the results on the basis of data interpreted also known as a global-based model. |
It operates dynamically depending on the situation of operation detailed data specifications are not required and the simulation gives the detailed analysis of the components simulated. Also, know as a real-time-based model. |
| disadvantage | More data has to be collated and some assumptions might also have to be taken. | Could not simulate as per our customized specification. |
EFFECTED ON COMPONENTS/PARTS FOR SIMULATION
| ENGINE | Engine performance could be simulated with the array of data interpreted in the system, whereas all conditions such as engine operations, power, efficiency could be measured accordingly. |
Engine performance will be simulated as per the original/real engine specifications of the designated vehicle chosen for simulation. All results would be obtained with real-time details. |
| MOTOR | Motor specifications such as rpm, maximum efficiency heat, and such specifications are to be entered for simulating the results. |
The actual details for the same would be considered and the results would be obtained. |
| GENERATOR | Specifications for battery Torque, battery current, motor torque and others are to be entered for simulation. |
All the details and specifications would specifications would be considered as per the actual and dynamic state the results of the same would be obtained then. |
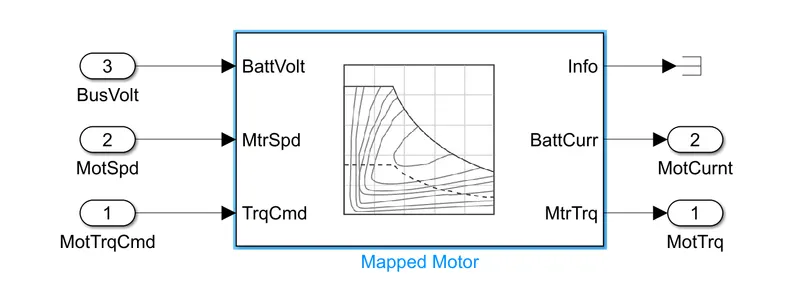
in mapped motor input shown above the inputs are motor torque,motor speed, voltage.output are speed of the motor,motor current
Dynamic model - Dynamic model is a type of model that uses the combination of output from various subsystems to generate the output. It runs by real time simulation where the required input from the drive cycle is taken and simulation is performed.The accuracy of this model is high because it real time simulation is performed but the time taken to solve the model is very high. Dynamic engine models are suitable for designing control, estimator, and diagnostic algorithms that depend on dynamic subsystem states, for example, in closed-loop AFR control algorithm development.
For changing the model type
here iam considering the hybrid electric vehicle example that is there in powertrain blockset
The default model chosen for say motor was a mapped one which is shown below
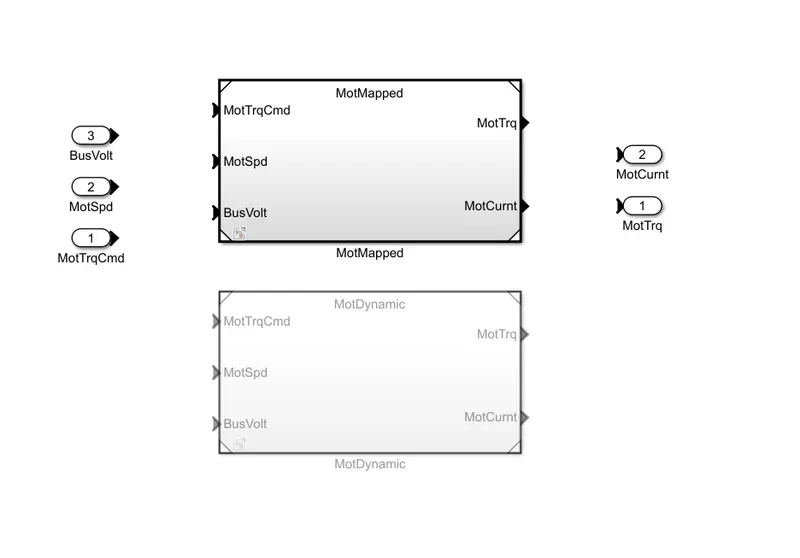
here you can see that motmapped is highlighted which shows that the mapped model is selected and motdynamic is not highlighted.
if i want to change it to dynamic model then i have to right click on simulink workspace and then i have to click on variant,then click on label mode active choice and select dynamic then following sill be shown
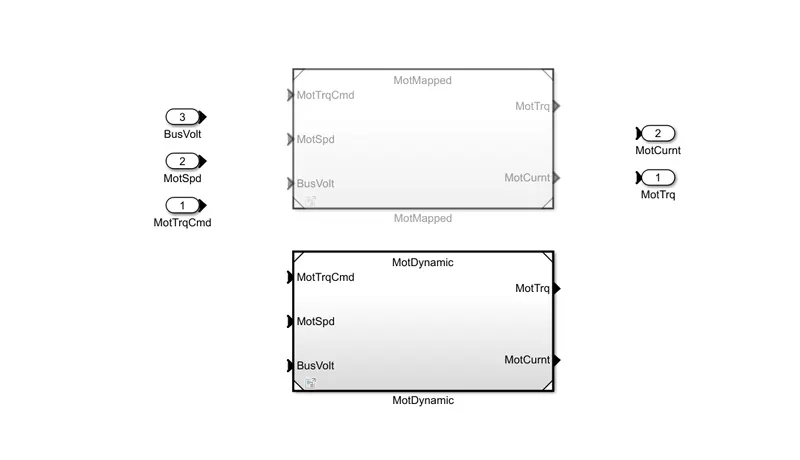
Here now you can see that the motdyanamic which was not highlighted earlier is now highlighted which shows that for the motor dynamic model is used.mapped model is suppressed.
2.How does the model calculate miles per gallon? Which factors are considered to model fuel flow?
In below shown figure Miles per gallon is the fuel economy rating determined by how far a car can travel on a gallon of gasoline or diesel for an engine powered car. In case of electric vehicle miles per gallon will show how far the car can travel on 33.7kWh of electricity which is the energy equivalent of one gallon of gasoline.
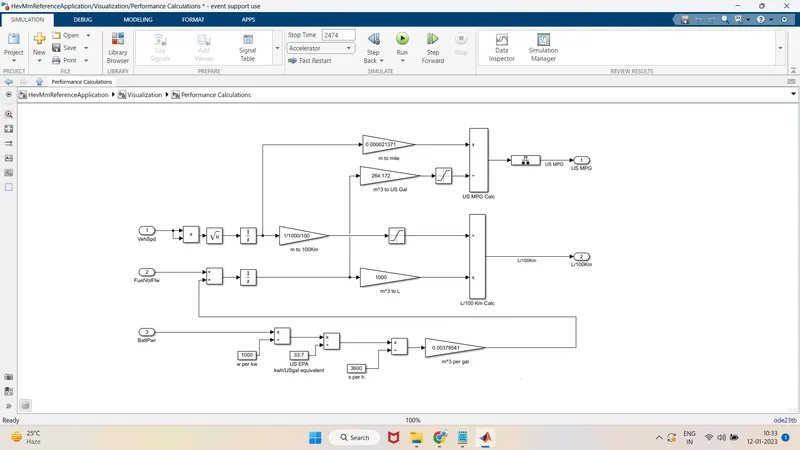
There are 3 factors involved in calculating the fuel economy rating
- vehicle speed
- fuel flow
- battery power
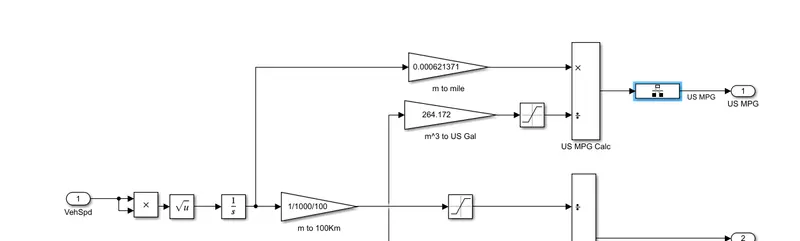
vehicle speed- The vehicle speed is integrated with respect to time which is later converted into km units. Saturation block is used to bound upper and lower limit to obtain the value.Now convert the distance in m into mile using the gain block and then you will have the output. The process is shown below:
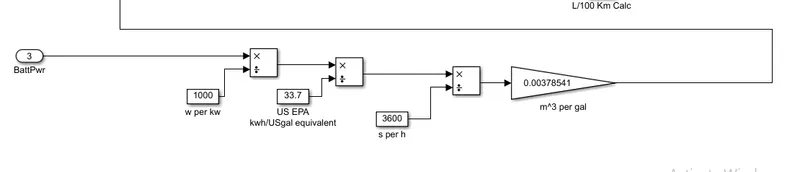
Battery power - The battery power required to propel the vehicle is first converted into kW and battery rating is obtained in terms of KWh. several gain blocks with constant values are used to get the mass flow rate of fuel in kg/m^3. The process is shown below:
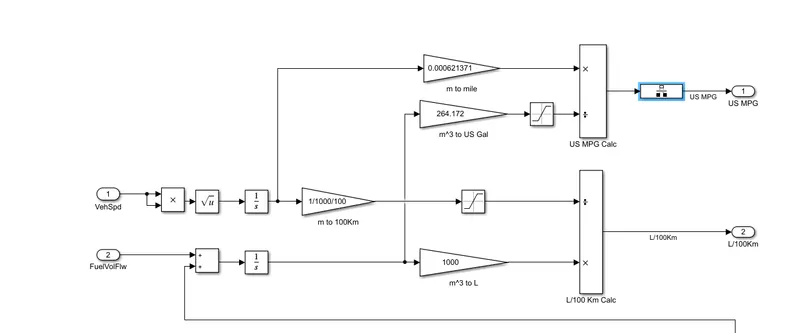
Fuel flow block - The value from the gain block in previous is fed into fuel flow, using this values along with gain blocks the fuel consumption in litres is calculated from vehicle speed and fuel flow, the total amont of fuel to run vehicle for 100 km is obtained(L/100km). Now for calculating Miles per gallon convert the fuel flow value in m^3 into us gal by multiplying 264.172 using the gain block and saturation block to saturate the limits. The process is shwn below:
3.Run the HEV ReferenceApplication with WOT drive cycle. Change the grade and wind velocity in the environment block. Comment on the results.
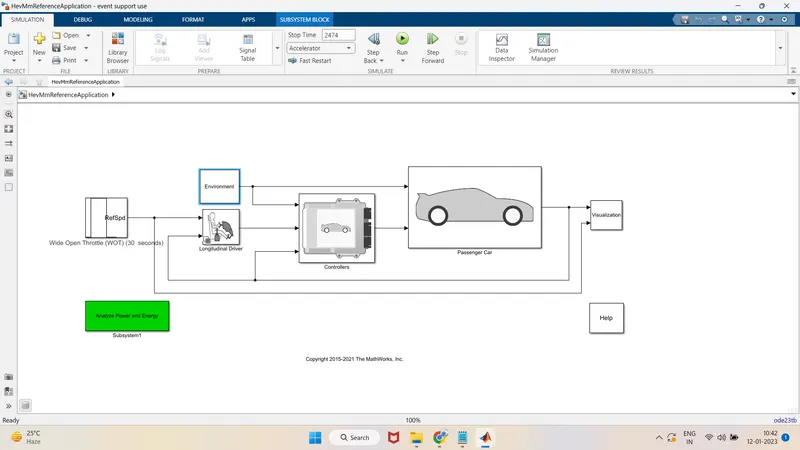
The above shown configuration is a series parallel combination type model in which both engine and battery can individually as well as both together can run the vehicle.
The default hev model from the powertrain blockset is shown below
.
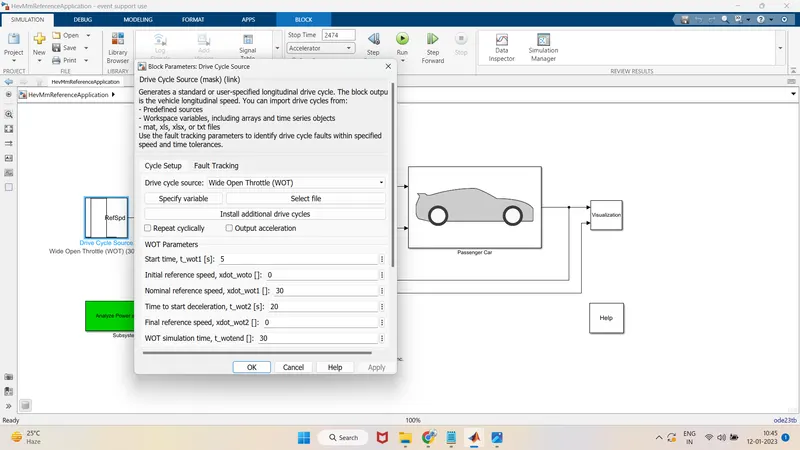
Drive cycle source:
The drive cycle source for this model is set to Wide Open Throttle (WOT) and other parameters are provided with the values as shown in below snap.
Environment sub system:
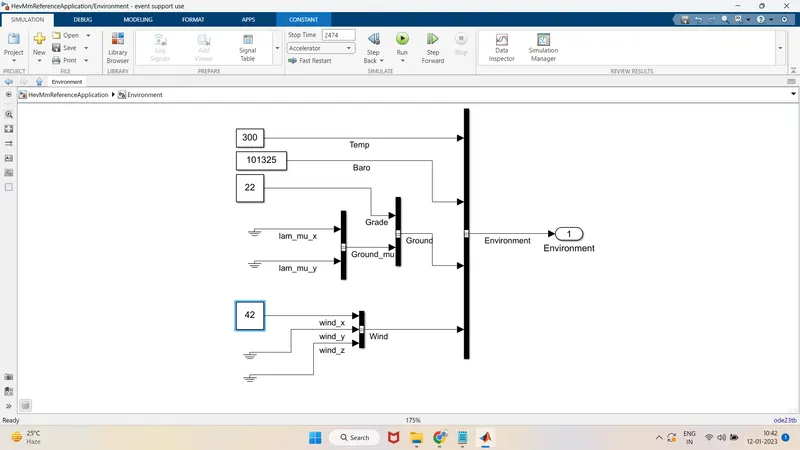
This is the subsystem where, the environmental conditions can be changed as per user requirement.
All the other parameters are kept in default condition with grade and wind velocity set to grade-22&wind-42.
 .
.
After making all the required changes the simulation is run for few seconds and the following output was obtained.
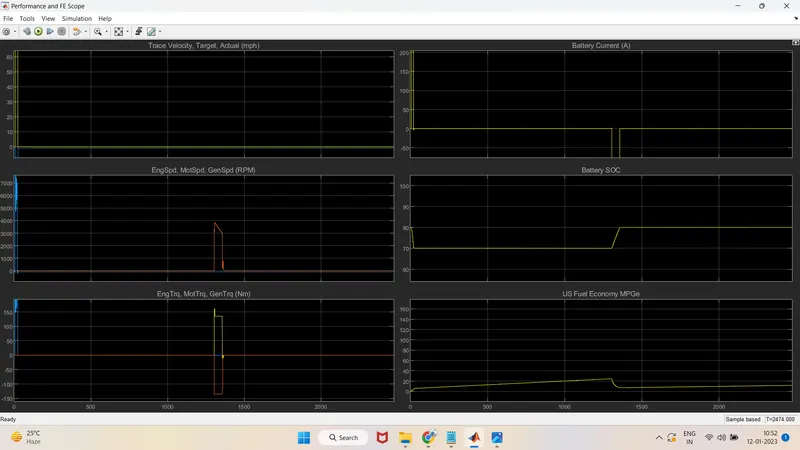
- In the first graph the yellow curve is the ideal WOT cycle and the blue curve is actual WOT cycle obtained for the given parameters.
- In the second graph (Speed), it can be observed that the speed of the engine and the generator are same throughout the drive cycle and rapid increase in motor speed can be observed and then after few seconds the engine speed also increases and reduces while decelerating.
- In the third graph (Torque), the torque of motor is high for few seconds during full throttle and then it reduces gradually and this is same for both motor and generator.
- In the fourth graph (Battery current), the current utilized is more till the engine is turned on, once the engine turns on the vehicle runs on both engine and electric motor power with reduced use of current.
- In the fifth graph (SOC), we can see that the SOC of the battery reduces gradually when the vehicle runs on electric motor and from 32 to 50 sec of time interval, we can see that the SOC reduces slowly because the generator charges the battery.
- In sixth graph (Fuel economy), which indicates the economy of fuel high when the vehicle runs on electric motor.
-
Overall Summary
Display the final energy values for each subsystem.
VehPwrAnalysis.dispSysSummaryWrite summary to spreadsheet.
VehPwrAnalysis.xlsSysSummary(fullfile(fileparts(which('GenerateEnergyReport')), 'EnergySummary.xlsx'))Engine Plant Summary
EngSysName = 'HevMmReferenceApplication/Passenger Car/Engine';
EngPwrAnalysis = VehPwrAnalysis.findChildSys(EngSysName);
EngPwrAnalysis.dispSignalSummary;
EngPwrAnalysis.histogramEff;Electric Plant Summary
ElecSysName = 'HevMmReferenceApplication/Passenger Car/Electric Plant';
ElecPwrAnalysis = VehPwrAnalysis.findChildSys(ElecSysName);
ElecPwrAnalysis.dispSignalSummary;Drivetrain Plant Summary
DrvtrnSysName = 'HevMmReferenceApplication/Passenger Car/Drivetrain';
DrvtrnPwrAnalysis = VehPwrAnalysis.findChildSys(DrvtrnSysName);
DrvtrnPwrAnalysis.dispSignalSummary;SDI Plots
VehPwrAnalysis.sdiSummary({EngSysName, ElecSysName, DrvtrnSysName})
Overall Summary
Display the final energy values for each subsystem.
VehPwrAnalysis.dispSysSummary
4.Keeping all other parameters same, compare the simulated results of hybrid and pure electric powertrains.
• A battery electric vehicle or pure Electric vehicle is a EV that exclusively uses chemical energy stored in rechargable battery packs with no secondary source of propulsion (e.g. hydrogen fuel cell, internal combustion engine, etc.) of energy.
• BEVS use electric motors and motor controllers instead of an conventional Internal combustion engines for propulsion. They derive all power from battery packs.
• So they don't produce any emission of waste gas and they are eco friendly.
• They also have their own limitations such as range etc.
• Example of Pure EV is Nissan Leaf.
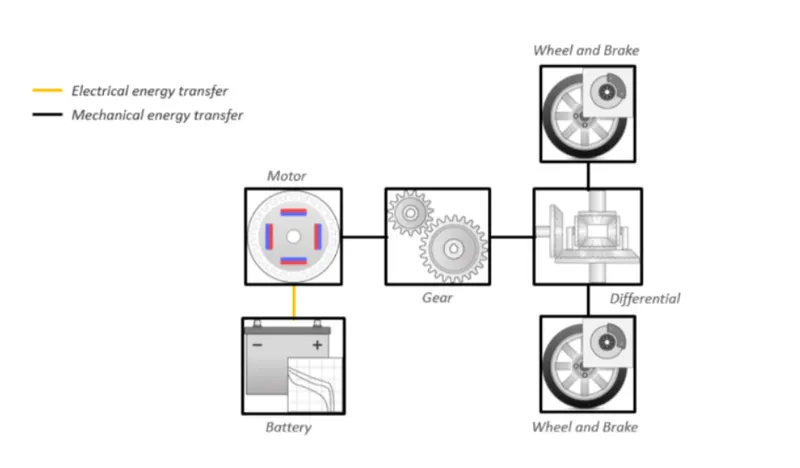
• Now comparing both Pure electric and Hybrid electric vehicle with the given conditions in a simulation to observe the behaviour of both the type.
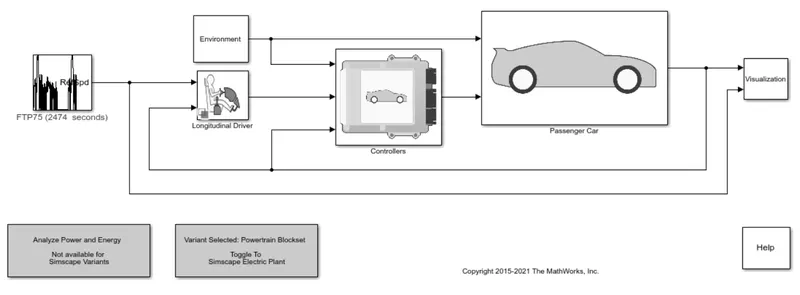
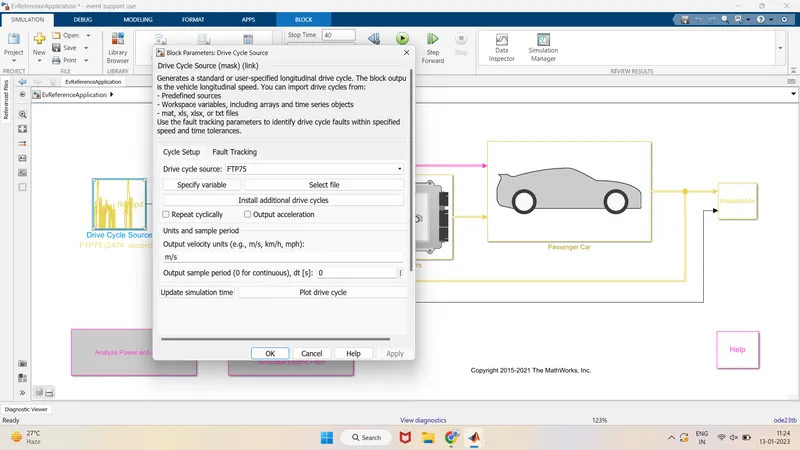
Simulation condition:
The drive cycle source for this model is set to FTP75 and simulation time for this drive cycle is 40 seconds. The below snap shows the parameters that are defined for the drive cycle and also the type of drive cycle opted.
Environment sub system:
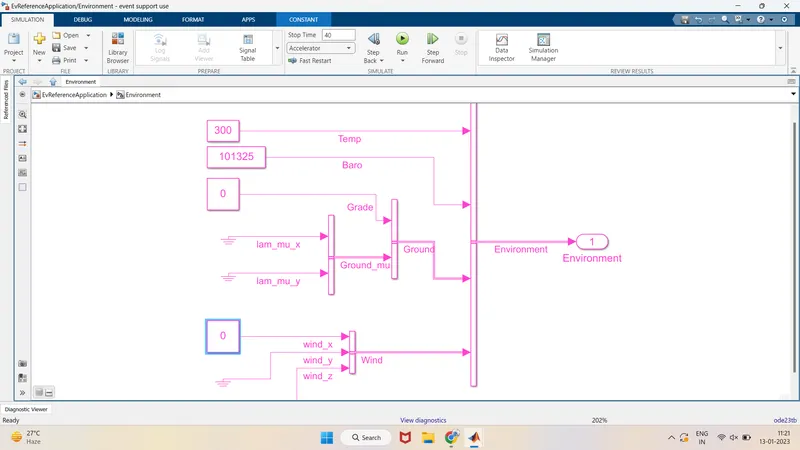
This is the subsystem where, the environmental conditions can be changed as per user requirement.
This allows us to get the results which will be similar to an actual vehicle.
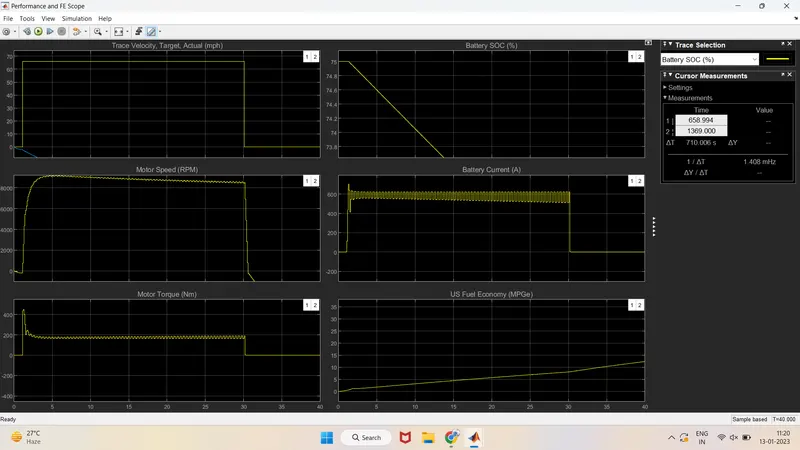
- The first graph shows the FTP75 standard drive cycle which is provided as source for the model.
- In the second graph (Speed), it can be observed that the plot of speed of the motor resembles the drive cycle which indicates that motor speed is varying according to the drive cycle.
- In the third graph (Torque), the torque of the motor is high during the acceleration and low during the deceleration.
- In the fourth graph (SOC), we can see that the SOC of the battery reduces gradually when the vehicle is accelerated and gets charged during the deceleration. For this model, SOC is reduced from 80% to 71.61%.
- In the fifth graph (Battery current), the current utilized by the motors will be more during the acceleration.
- In sixth graph (Fuel economy), it can be observed that the fuel economy is more as entire model is running only on electric motor.
-
b.HEV
All the parameters are kept same as in EV model.
Simulink model:
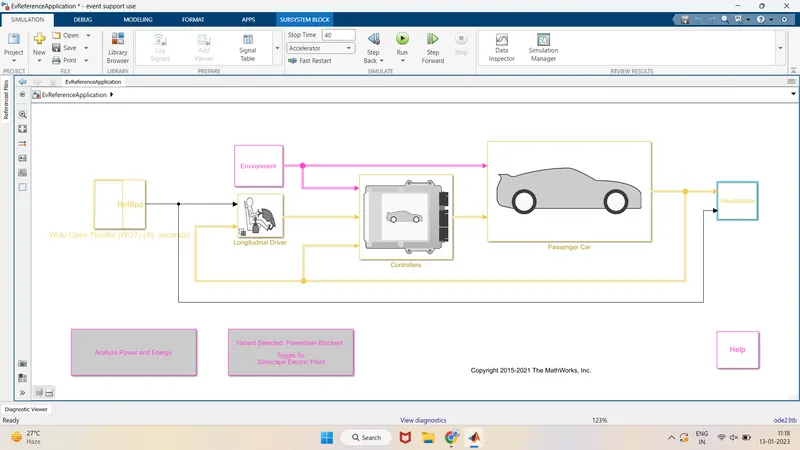
Environment subsystem:
This is subsystem where the environmental conditions can be changed as per user requirement.
All the other parameters are kept same except grade and wind velocity values.
Grade is set to 220 and wind velocity to 42ms-1 as shown in below snap.
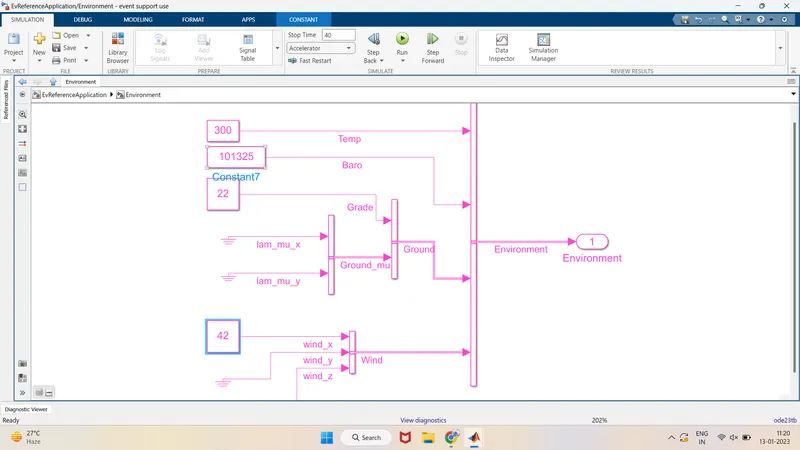
After making all the required changes the simulation is run for 40 seconds and the following output was obtained.
Output:
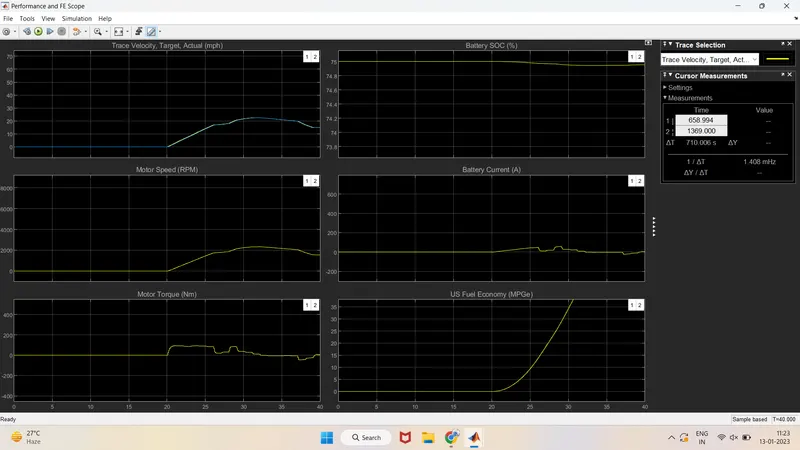
- In the first graph, the blue curve is the ideal WOT cycle and the red curve is actual WOT cycle obtained for the given parameters.
- In the second graph (Speed), it can be observed that the speed of the engine and the generator are same throughout the drive cycle and we can also see that with the reduce in the current supply the motor speed reduces during this the engine speed is increased gradually. Now, for few seconds both engine and motor operate to displace the vehicle and then the speed of engine and generator reduces gradually.
- In the third graph (Torque), the torque of both motor and engine is more with more acceleration and reduces with deceleration. But the nature of torque plot of generator is negative which indicates the generator is activated and the battery is getting charged.
- In the fourth graph (Battery current), the current utilized is more till the engine is turned on, once the engine turns on the vehicle runs on both engine and electric motor power.
- In the fifth graph (SOC), we can see that the SOC of the battery reduces gradually when the vehicle runs on electric motor and from 37 to 50 sec of time interval, we can see that the SOC reduces slowly because the generator charges the battery.
- In sixth graph (Fuel economy), which indicates the economy of fuel high when the vehicle runs on electric motor.
At last, by comparing both it can be concluded that the HEV with grade and wind velocity requires more speed, torque and battery current to overcome the given environment condition.