Week-4 Challenge WOT Condition Part-2
1. What is the difference between mapped and dynamic model of engine, motor and generator? How can you change model type?

Mapped Model:
Mapped Models are modelled using a lookup tables in which data is fed. These are steady state models. These ar Microlevel ie Low detail level models. The Sample rate is 1seconds. It gives results in few seconds because the simulations are not performed on detailed level. The inputs data is experimental based.
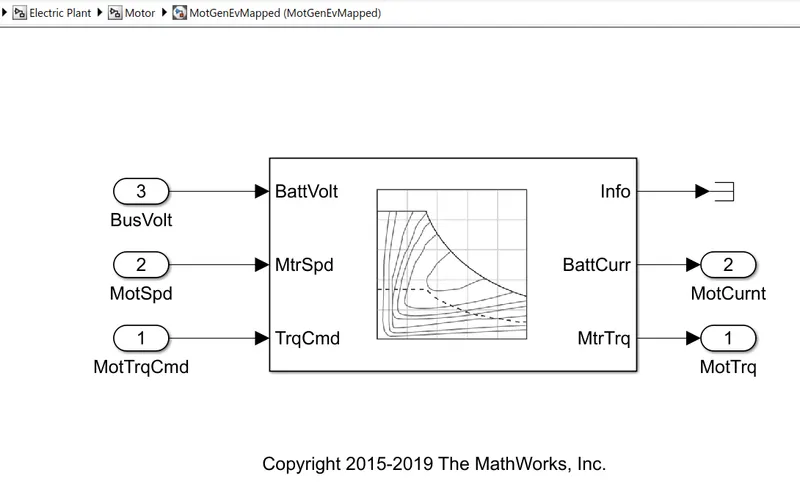
MAPPED MODEL OF MOTOR
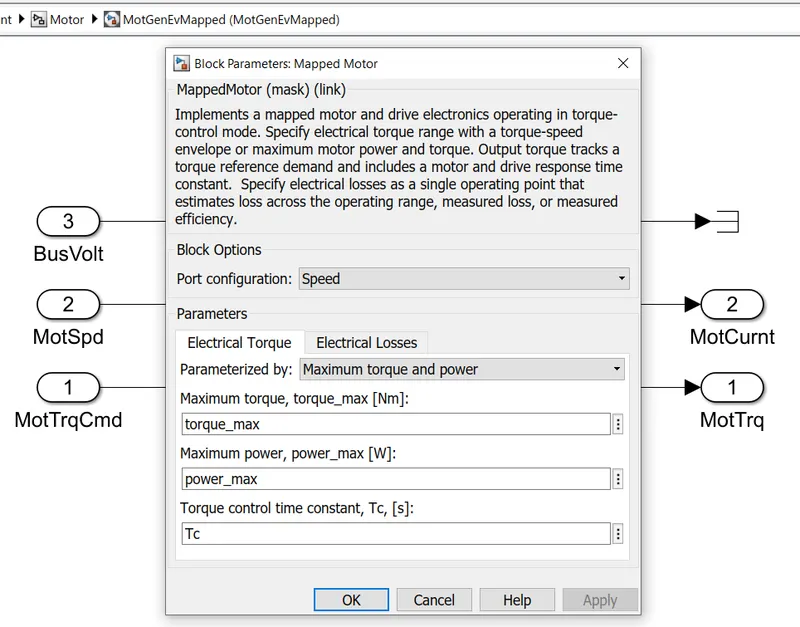
Above Models shows a mapped motor and drive electronics operating in torque-control mode. Here electrical torque range is specified with a torque-speed envelope or maximum motor power and torque. Output torque tracks a reference torque demand and includes a motor and drive response time constant. Electrical losses need to be specified as a single operating point that estimates loss across the operating range and measured efficiency.
Dynamic Model:
Dynamic Models are perform in a detailed sub transient simulations for more detailed experiments. The Sample rate is less than 1seconds. Gemerally Power Electronics Simulations are performed as dynamic. It is a mathematical or physical representation of the system relationships. To model a motor, generator and engine we need to derive the mathematical equations that shows the relationships of the motor, generator and engine.
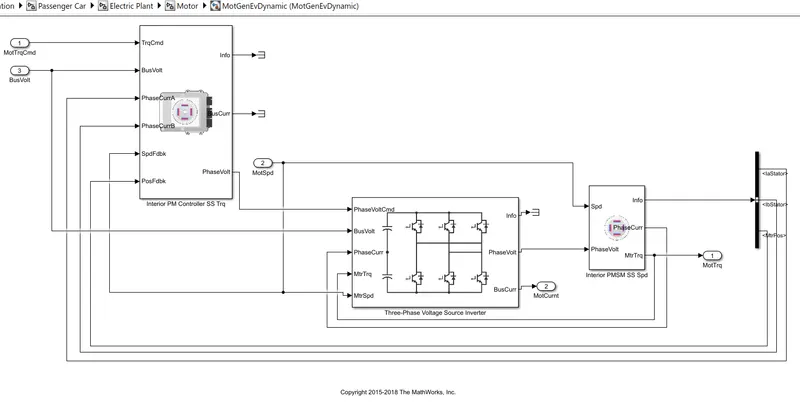
DYNAMIC MODEL OF A MOTOR
Changing Model Type:
- To Change Model Open the Variant manager in Simulink Window. The Path is Simulink → Modeling → Variant Manager.
- Then on the tab select the model sytem in which the model needs to be changed. The system may have subsystem in it.
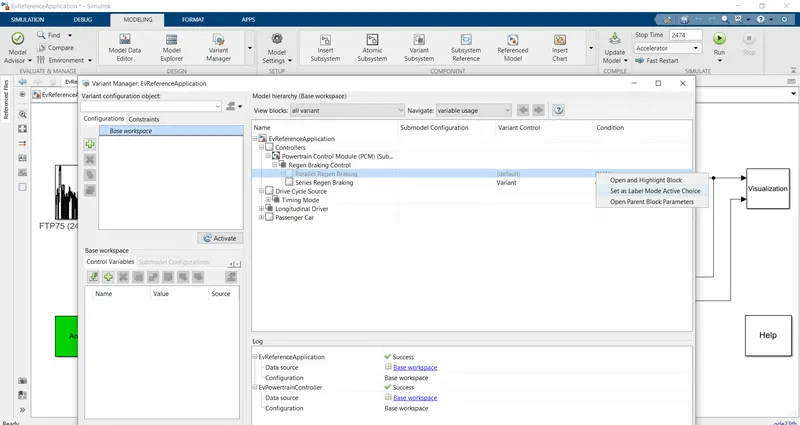
- For Ex: In above Image Controller System has 2 subsystems and in Regenerative Braking Control there are 2 modes Series Regenerative Braking and Parallel Regenerative Braking.
- Series Regenerative Braking is the selected model so to change it to Parallel Regenerative Braking Mode Right Click on it and click on 'Set as Label Model Active Choice'.
ANOTHER METHOD:
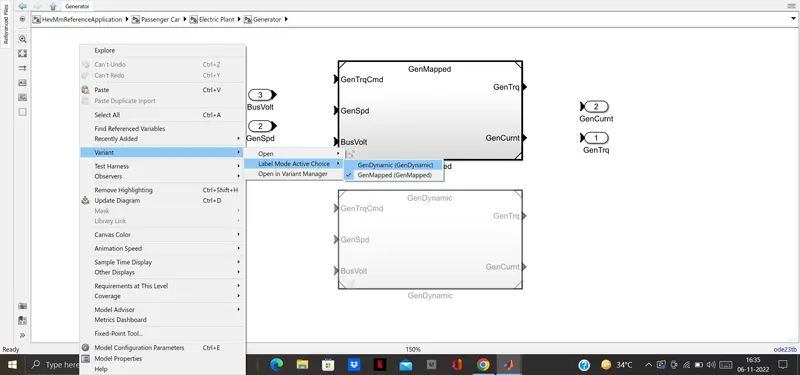
- In above image Generator model of HEV is selected.
- Right click on Window and in Variant tab select Label Mode Active Choice and select the model(Dynamic or Mapped).
- Variant → Label Mode Active Choice → Gen Dynamic.
2. How does the model calculate miles per gallon? Which factors are considered to model fuel flow?
MPG stands for Miles Per Gallon. It is measurement of fuel economy of vehicle. it is the measurement of distance travelled by a vehicle in miles for 1 gallon fuel.
1 Gallon of fuel = 3.785 Litres
A higher MPG means less consumption of fuel while driving. The cost of ruuning the car is low and car is producing fewer emissions as it burns fuel more efficiently.
A good MPG is subjective depending on the car and fuel type. Driving style has huge impact on MPG rating. Smoother driving will lead to a higher rating but jerky reactions and aggressive acceleration may result in drop in MPG figure.
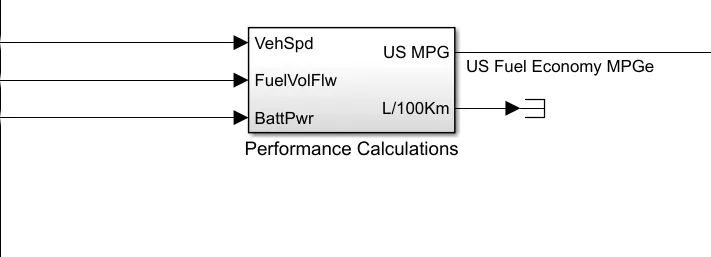
The inputs to calculate the MPG is Vehicle Speed in (m/s), Fuel flow in kg and Battery Power in Watts.
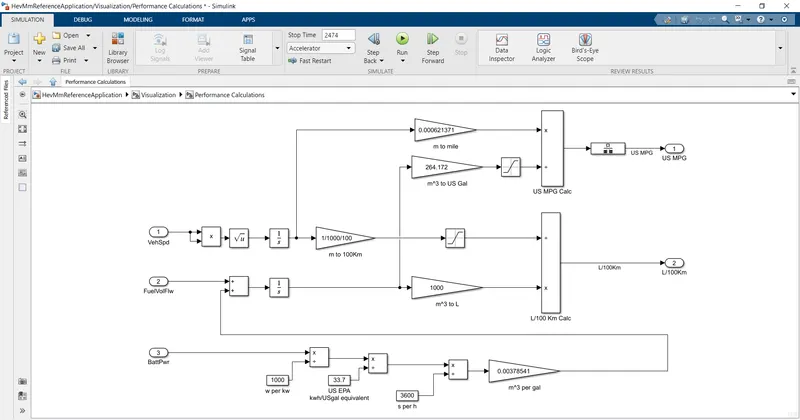
The Subsystem Model to Calculate MPG
- The Battery Power is divided by 1000 to convert watts into KW and then KW is divided by 33.7 to get results in kwh/US gal (US EPA) .
- US environmental protection agency(EPA) 1 gallon of gasoline is equal to 33.7 kWh
- Then kwh/USgal is divided by 3600 and further multiplied by 0.00378541 to convert it to m3 per gal.
- FuelVol Flow and battery power are added ie m3/gal and integrated further to get results in m3.
- Now to convert m3 into L it is multiplied by 1000.
- The Vehicle speed is squared and integrated to find the distance in metres.It is divided by 1/1000/100 to find distance in 100km range.
- The distance is converted into miles by multiplying 0.000621371 and m3 is converted to US gal by multiplying Feul flow by 264.172.
- Now Miles is divided by US gallon to get Miles per Gallon.
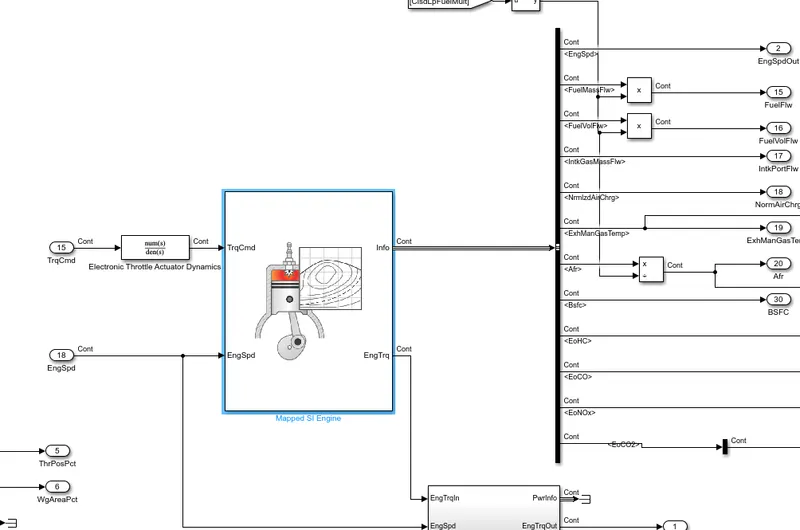
- The Factors Considered to model fuel flow are Engine (CI or SI), Fuel Flow Rate, Torque Command and Engine Speed.
3. Run the HEV ReferenceApplication with WOT drive cycle. Change the grade and wind velocity in the environment block. Comment on the results.
An HEV is a combination of ICE and Electric Motor which works parallel or together to propel a vehicle. An HEV has different types of architecture such as Series hybrid, Parallel hybrid and Series-Paralle Hydrid. In series hybrid Vehicle is propelled by an Electric Motor and ICE helps in charging of battery through generator. In parallel hybrid the vehicle is propelled by either Electric Motor or ICE depending on the capacity of ICE and Motor and power requirements. In Series-Paralle Hydrid both Motor and ICE works in parallel to move the vehicle.
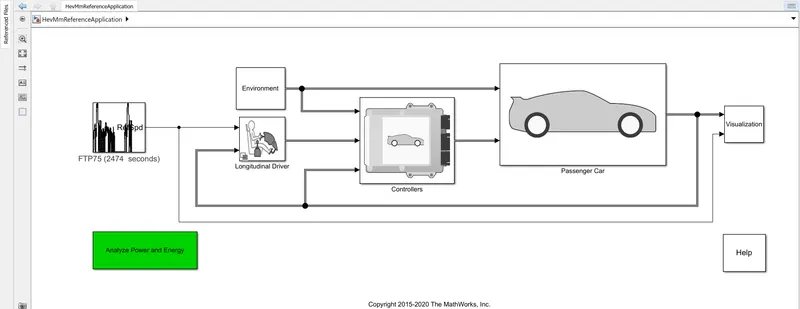
HEV REFERENCE MODEL
The above HEV model works in backwarad flow from Drie Cycle Source to Energy Storage. The HEV consists of an Longitudinal Driver to in which input of drive cycle source is given. The Controller part consists of Powertrain Control Modeule which has an Engine Control Module and Motor Control Module. The passenger Car consists of Engine plant , electric plant and Drivetrain Plant.
Case1: Without Changing the parameters
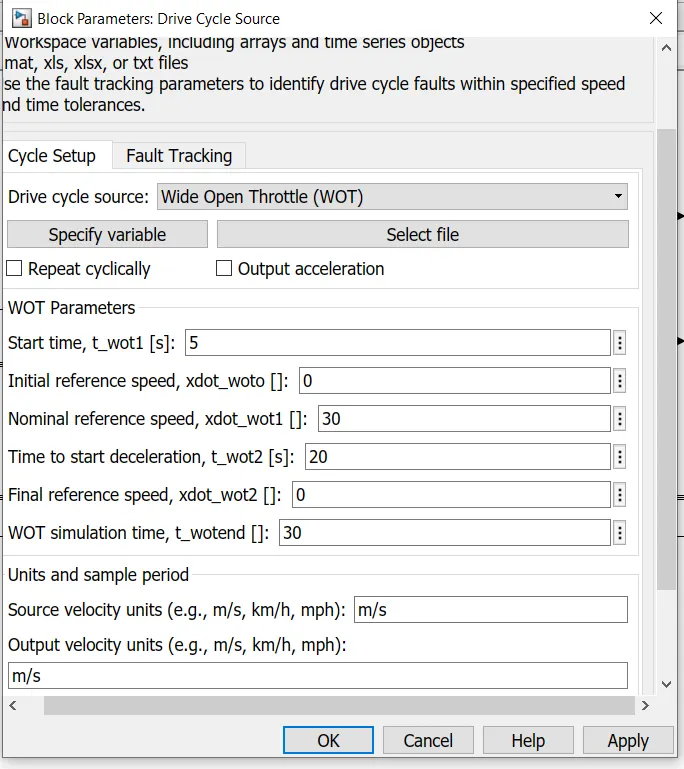
Drive Cycle Source selected as Wide Open Throttle
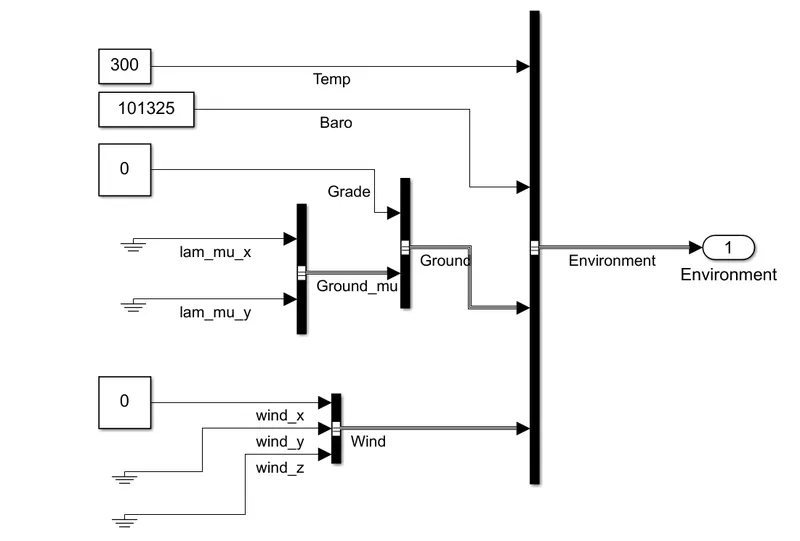
Grade and Wind Veleocity is kept as 0.
00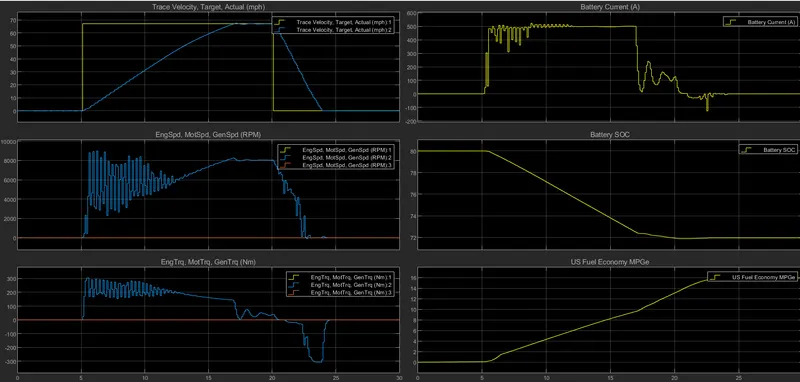
OUTPUT USING WOT
- In 1st graph the Speed of the vehicle is mentioned, yellow graph represets the WOT condition and blue graph represents the actual vehicle speed. The WOT is applied after 5 seconds and is run for 30seconds. The Vehicle attains the maximum speed of 70miles/hr after 17Seconds and remains constants for 3 seconds and after that brake is applied and vehicle speed reduces.
- The 2nd graph represents the Engine, Motor and Generator speed in RPM. The Engine and Generator RPM remains at zero but as WOT is appiedthe motor RPM starts to increase from 0rpm to 9000rpm and once vehicle attains the desired speed it remains constant atb 8000RPM and during the braking ie after 20seconds the Motot Speed starts to decrease and also goes in negative direction indicating the regenerative charging.
- The 3rd Graph reprensts the Motor Torque, Generator Torque and Engine Torque.The Motor produces a maximum torque of 300Nm and during the braking period the torque is negative. The Torque varies between 300Nm to - 300Nm.
- The 4th graph represents Battery Current. The battery maximum current discharge is 510A during WOT condition and during constant acceleartion the current stays at 500A and when vehicle is decelerating the current reduces.
- The 5th graph is Battery SOC, during acceleration the motor draws maximum current and battery discharges at 500A so SOC reduces to 71.8% from 80% and during deceleration since regenerative braking occcurs so SOC increases slightly and remains at 71.99%.
- The last graph represents the Miles Per Gallon ie Fuel Ecocnomy rate of Vehicle which is 16miles/gal.
Case2: Grade is set as 6 and Wind velocity as 12.
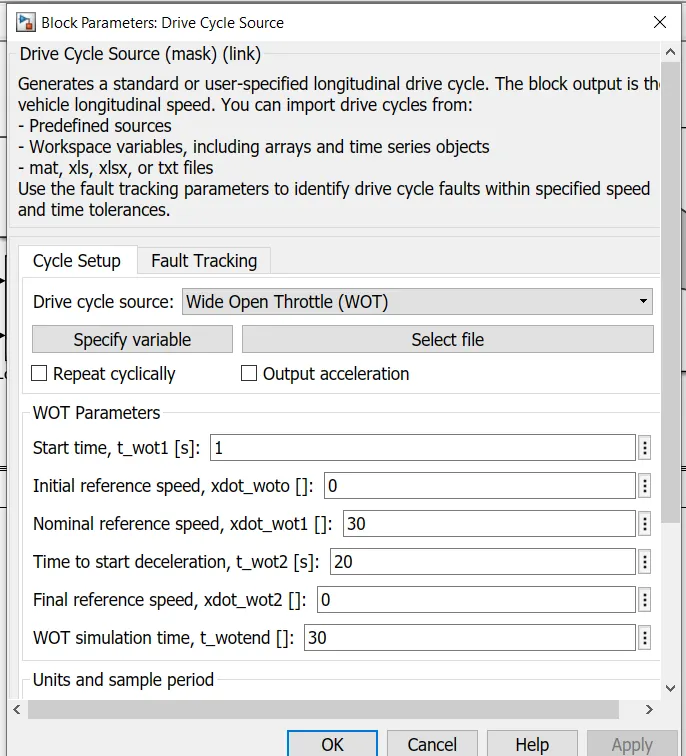
WOT Start time at 1s
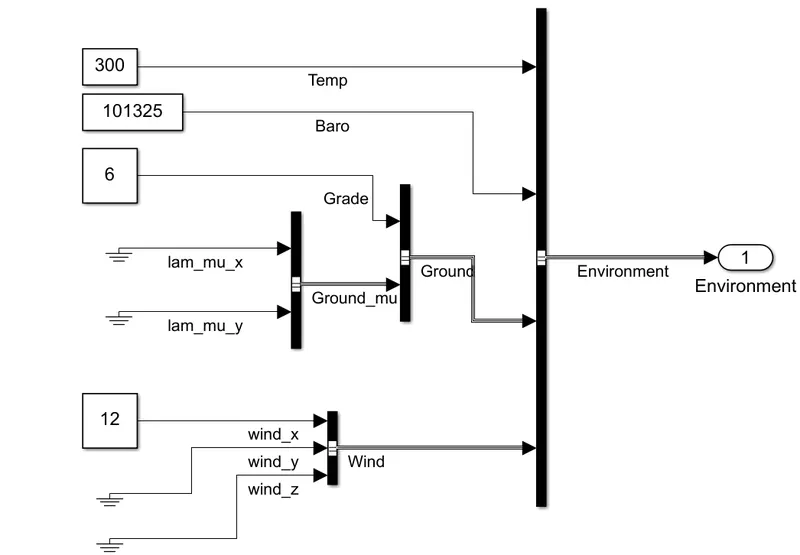
Grade set to 6 and wind velocity to 12
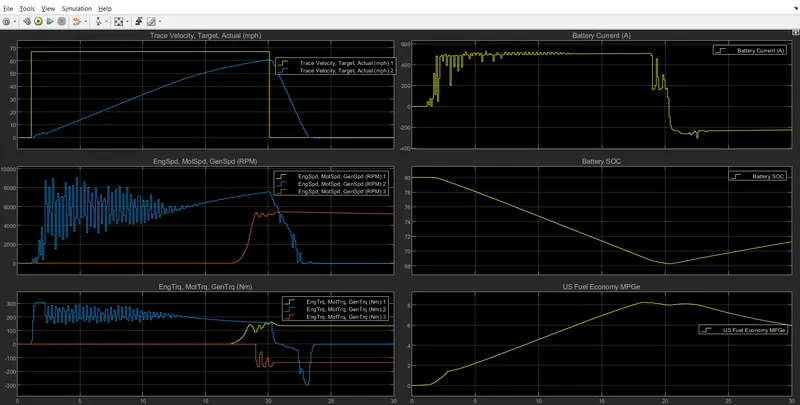
- In 1st graph the Speed of the bervehicle is mentioned, yellows graph represets the WOT condition and blue graph represents the actual vehicle speed. The WOT is applied after 1 seconds and is run for 30seconds. The Vehicle attains the maximum speed of 60miles/hr at 20 Seconds which is less than the WOT Drive cycle curve since grade and wind velocity is included and Battery maximum discharge current is limiteed to 510A.
- The 2nd graph represents the RPM of Motor, Generator and Engine. The graph of Generator and Engine is in sync with eaach other , the motor has maximum rpm of 8500 during acceleration period and engine and generator are at 0rpm but when vehicle is decelearating motor rpm is reducing but generator and engine rpm is increasing.
- The 3rd shows the torque generated by motor,generator and engine, the motor torque varies between 300Nm to -300Nm as in above case but during braking period engine produces 180Nm of torque and genearotor 180Nm torque but in opposite direction.
- The battery current is limited to 510A ie why vehicle cannot accelerate to its desired speed when WOT is applied.
- The Battery SOC is reducing till 20seconds and it is discharged quickly from 80% to 68% since vehicle is accelerating at higher rate but during decelerating the SOC increases from 68% to 71.8% in 10seconds. The battery is charged at 200A of current during deceleration.
- The MPG rating has reduced since generator and Engine are also working, when grade and wind velocity were 0 the HEV had MPG of 16miles/gal but now it has reduced to 6miles/gal. So so when grade and wind velocity are increased vehicle efficiency is reduced.
4. Keeping all other parameters same, compare the simulated results of hybrid and pure electric powertrains.
a. Hybrid Electric Vehicle Results:
- Drive Cycle selected is FTP 75 which runs for 2474 seconds.
- The HEV Model consists of number of systems such as drive cycle source, longitudinal driver System, Environment block, Vehicle Controller and Passenger Car.
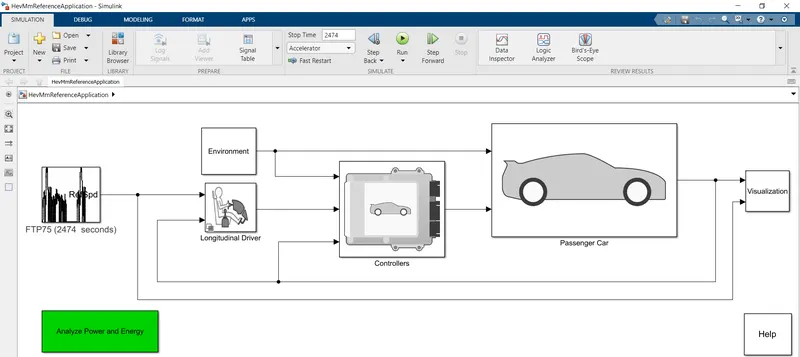
HEV MODEL
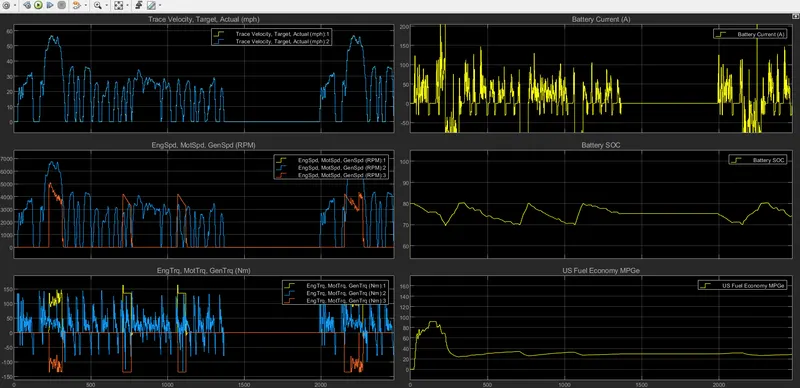
- The first graph compares the speed of drive cycle and Vehicle, the graph is overlapped since Vehicle graph is in sync with drive cycle, the vrhicle has a amximum speed of 58mph.
- Thhe 2nd graph compares the Motor Spped , Generator Speed and Engine Speed in RPM. During initial acceleration motor alone propels the vehicle but when the vehicle exceeds 50mph the engine also powers the vehicle since power requirement has increased and motor alone cannot propel the vehicle above 50mph and whenever speed reduces below 50mph the engine rpm decreases and stays at 0 when speed is below 50mph.
- The 3rd graph compares Torque of motor, generator and engine. The negative torque represents that the engine is recharging the battery.
- The battery discharges at 250A when the vehicle is at maximum speed and at average spee dof vehicle the battery discharges at 100A, the negative current represents that battery is charging due regenerative braking which occurs when vehicle is decelerating.
- The initial SOC is at 80% and it reduces to 70% and then charging occurs due to regenerative braking and since algorithm of vehicle is set such that whenever SOC reduces below 70% the Engine turns on and with the help of generator it charges the battery.
- The last graph reprsents the fuel economy of HEV in MPG which is between 25 to 33 MPG. during initial acceleration the MPG is 90.
b. Battery Electric Vehicle
- Drive Cycle selected is FTP 75 which runs for 2474 seconds.
- An Electric Vehicle Model consists of Battery, Motor , motor Controller, longitudinal driver and environment block.
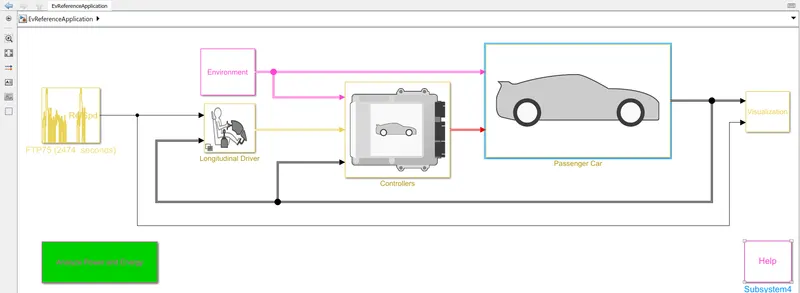
ELECTRIC VEHICLE MODEL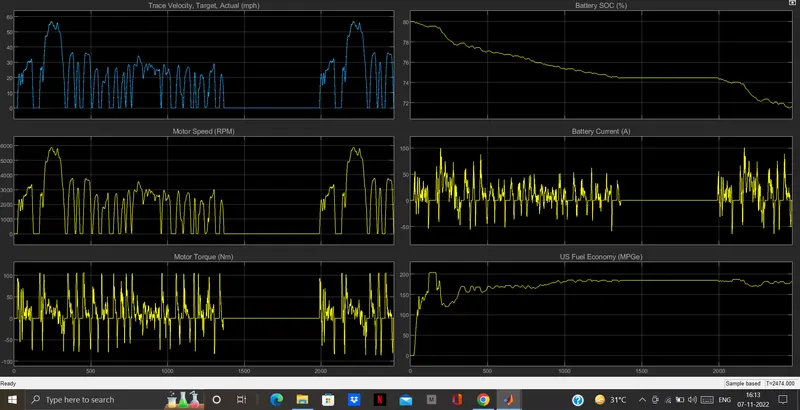
- The 1st graph isthe drive ccyle and Vehicle actual speed curve which has max speed of 58mph and vehcile curve is following the drive cycle curve.
- The Motor Speed is about 5800RPM at maximum Vehicle speed. The motor Torque varies between 100Nm to -50Nm.
- The SOC of battery reduces from 80% to 71.8% in 2474 seconds. During the deceleration of vehicle the SOC increases due to regenrative braking, the battery cureent is negative when battery is charging. The battery discharges at 50A during average acceleration but at higher speed it discharges at 100A.
- The MPG figure is 180 which indicates that vehicle is fuel efficient as compared to HEV.
COMPARISON of HEV & BEV:-
- From above results it is clear that MPG rating of Electric vehicle is greater than HEV.
- In HEV vehicle is runned by both motor and engine so whenever the power requirement is more engine is turned at that time to assist motor.
- But whenever power requirement is less at that ngine is used to charge the battery whenever the SOC is below the prescribed limit so HEV range improves due to this and during braking regenrative barking also battery charges.
- In BEV the vehicle has only one source of energy and is powered by motor alone.