Week-4 Challenge WOT Condition Part-2
Aim1:
Difference between mapped and dynamic models of engine, motor and generator.
Solution:
|
Mapped Model |
Dynamic Model |
|
|
Motor |
It is also known as static motor where the model runs based upon look up tables o some predefined input values. Simulation using this model is fast than the dynamic model. |
This model represents the real time working of the model. It represents the actual model of the equipment. It does not take any predefined values as input. It takes the real time values as inputs and give the output continuously. Simulation using this model is slow compared to Mapped Motor model. |
|
Engine |
It is steady state model where all the input parameters like air mass flow, fuel flow, exhaust temperature, efficiency and emission performance ae taken from look tables where values are predefined. Simulation time here is less when this model is used. |
This model also represents the actual working of the engine in real time. The input values change every time so the output values from the model also changes continuously. Here simulation takes more time to complete. |
|
Generator |
This is also similar like the mapped motor, where the input values for the generator block are predefined or it takes from the lookup tables. Here simulation time is less when this model is used. |
This model also represents actual generator which work in the real time environment. Here the input values are not taken from the lookup tables, the output values are calculated continuously according to the changes in the input values. Here also simulation time is more compared to mapped generator. |
To change the model from dynamic to mapped:
- In the reference application model where ever the mapped model is used, below that the dynamic model is also present and it is connected out since the connection are given to mapped models.
- To use the dynamic model, first we have to comment out the mapped model and then connect all the inputs to the dynamic model.
- Similar way is used to change from dynamic to mapped model.
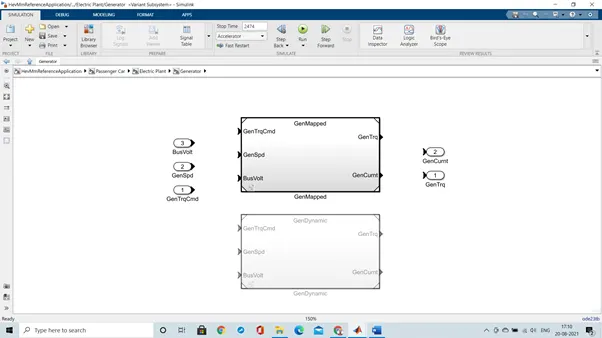
The above model shows that the dynamic model is commented out.
Aim2:
Calculating the miles per gallon,
- Usually, to calculate the miles per gallon, the automobile is filled with fuel fully until the fuel tank is full. Then the distance travelled in odometer is noted and then the automobile is started and is used until all the fuel is consumed thus emptying the fuel tank.
- Now again the distance travelled is noted down and the difference between both the readings of distance travelled is found out. Then this difference value is divided by the total fuel tank capacity of the automobile thus the resulting value obtained is the average milage of the automobile in miles per gallon.
- For example, if the vehicles initial odometer reading is 2000 miles and its fuel capacity is 10 gallons, after filling the fuel completely and starting the trip, at the end of the trip when the fuel is over, the reading on the odometer is 3000 miles then,
Difference in distance = 3000 – 2000 = 1000 miles
Fuel tank capacity = 10 gallons
Therefore, its milage is 1000/10 = 100 miles per gallon
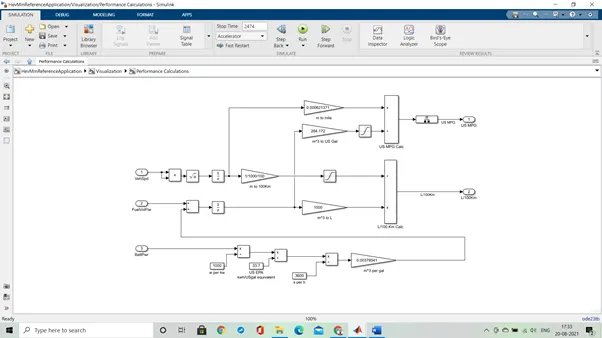
- The above figure shows how the model calculates miles per gallon. Above model can be found in the ‘Visualization block’ of the HEV model and in the ‘Visualization block’ click on the ‘Performance Calculation’ block then the above model will open.
- In the above model we can observe that factors that are needed as inputs to the model are vehicle speed, fuel volume flow and battery power. As this value changes the performance e of the vehicle also changes.
- Here first the velocity of the vehicle is converted into distance by integrating the velocity values and then distance is converted from meters to miles and km.
- Then similarly battery power is converted into volume by multiplying and dividing by constant conversion values. Then the battery and fuel volume flow are added and integrated to get the total volume of fuel consumed. Now this volume is converted from cubic meter to gallons and liters.
- Now the distance and volume of fuel is divided to get the performance results in miles per gallon and liters/100km.
- Factors that are required to model fuel flow are battery power, conversions from watt to cubic meter per gallon.
To run the HEV reference model in WOT drive cycle:
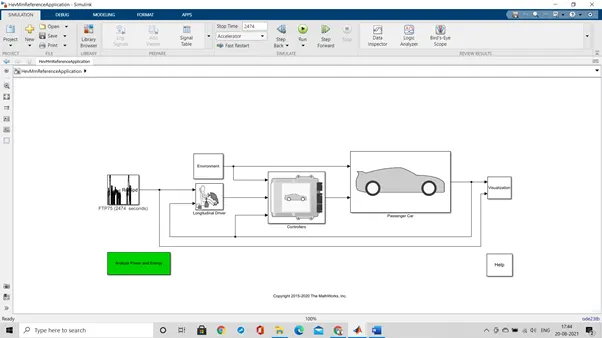
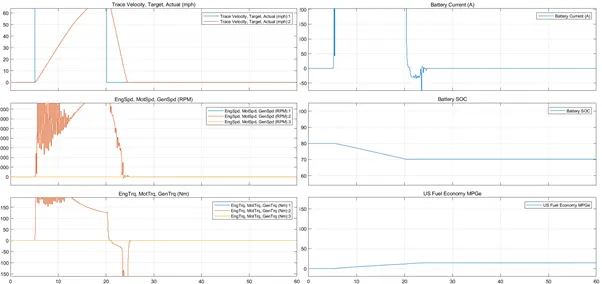
To obtain this graph first click on the ‘Drive cycle source’ block and then select WOT cycle. Now run the model and see the graph into Visualization → Performance scope.
- In the above graph 1 we can observe that it takes around 20 sec to reach maximum speed and to attain zero velocity from the maximum velocity it takes around 4 to 5 sec. so to reach top speed and again come back to rest it takes around 24 to 25 sec. So, the actual time varies from the drive cycle time.
- In the second graph we can observe that while attending the top speed, the speed of the motor is varying continuously and once achieved the speed of motor is constant and the speed reduce continuously to zero. High speed of motor is observed when the vehicle is reaching maximum speed.
- In the third graph we can observe that the motor is giving high torque to achieve the top speed and then slowly it is reducing. Once it reaches the top speed then the motor torque slowly reduces and reaches zero. From here it goes negative because the motor is rotating due to vehicle speed thus the torque produced is due to vehicle, not due to motor so, it is negative.
- In the fourth graph we can see that the current consumed by motor is high when vehicle is achieving top speed and is constant until the speed is maximum and then as the speed of the vehicle decreases the current also decreases and at a point it goes to negative which means that it charged due to regenerative braking and then again becomes zero.
- In the fifth and the sixth graph we can observe that the stage of charge (SOC) has decreased as to achieve top speed some battery charge is used. And for fuel economy graph we ca see economy is less initially as more fuel is needed to achieve top speed and then slowly it increases as the need of fuel decreases.
WOT cycle with changes in grade and wide velocity
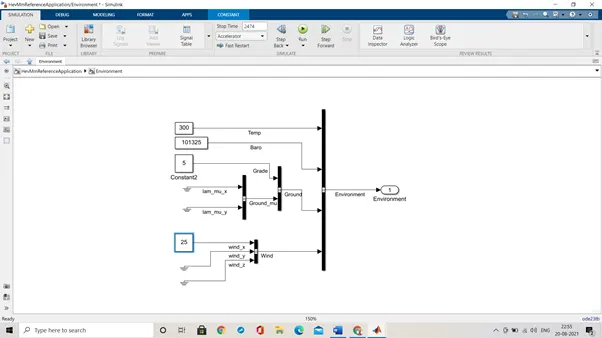
Results obtained:
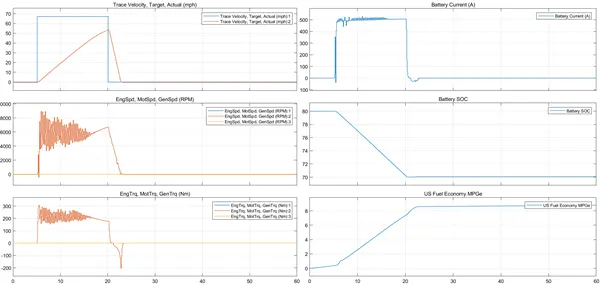
Plot 1: This is clearly visible that as the grade and the wind velocity are increased compared to the normal state the vehicle is not able to reach the target velocity.
Plot 2: In this plot comparing with the normal plot the engine speed we can see that actual speed is high and keeps on varying at that level and after a point it becomes zero.
Plot 3: There are multiple variations in all these aspects and the same is visible in both the results of normal and with the grade and the wind velocity.
Plot 4: A battery current has been fluctuating at a higher range as compared to the normal after the vehicle is reaching near to the steady/stable pace the fluctuations start and is simulated.
Plot 5: The battery state of charge remains more or less similar in both the cases and are resulted at 70 % after the end of the WOT cycle.
Plot 6: The average fuel economy differs in the range of 6 ad 8 mph in both scenarios.
Aim4:
Keeping all the parameters the same compare the simulated results of hybrid and pure electric powertrains.
The below mentioned vehicle is simulated for the EV reference.
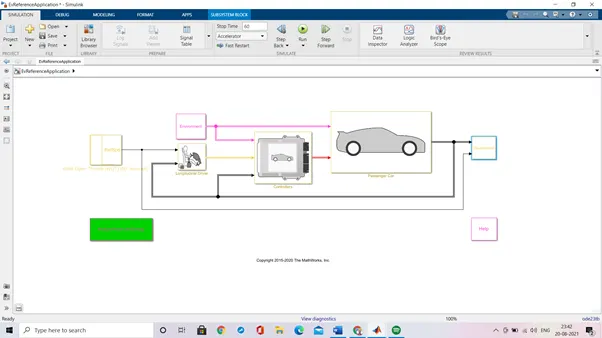
The performance and FE results obtained are appended as below,
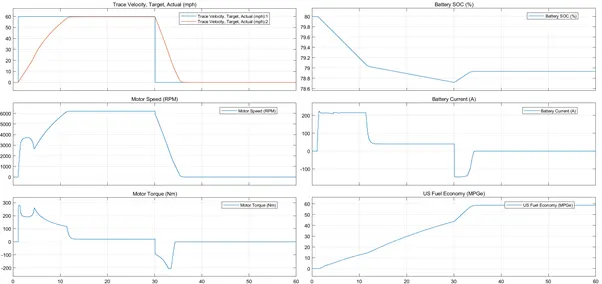
- Here in the figure, in the first graph we can see the top speed is achieved nearly at 14 sec which very quick than the HEV model graph the time taken to come to zero velocity from top speed is nearly 5 sec. so totally it takes 19 sec to achieve top speed and come back to rest, which is quick than the HEV model.
- In the second graph we can observe that the graph is much smoother than the HEV model. Thus, in electric vehicle the motor speed is smoother than the HEV motor speed.
- In third graph, here also the torque of motor is much smoother than HEV model and we can also observe that while the vehicle is decelerating, it is in regenerative braking mode, that’s why the torque is negative while deceleration.
- In the fourth graph, the SOC of battery is decreased slowly like HEV model but here it decreases much more than the HEV model. Since in electric vehicle only battery is used so battery is consumed more thus while achieving top speed the SOC line in the graph falls down more than that of HEV model graph. Since regenerative braking is happening which charges the battery so the curve has raised little bit at the end.
- In the fifth graph, we can observe that the current consumed the EV is less than that of HEV as the mass of EV is less so less current to used compared to HEV. Here due to regenerative braking, more current is produced than that of HEV to charge the battery.
- In the sixth graph, we can see that the fuel economy of the EV vehicle is very high than that of HEV. Thus, concluding that EV is now fuel efficient than HEV.
Conclusions:
The overall difference in both these simulators are vehicle operations where the EV is completely operated on the battery as the power source and on the other hand, the HEV has two power sources SI/CI Engine and battery. The results obtained are varied and the parameters are also differentiated accordingly.