Week-4 Challenge WOT Condition Part-2
AIM -
- To enumerate the difference between the mapped and dynamic model of engine, motor and generator and to change the model type
- To explain how the model calculates miles per gallon and what factors are considered to model fuel flow.
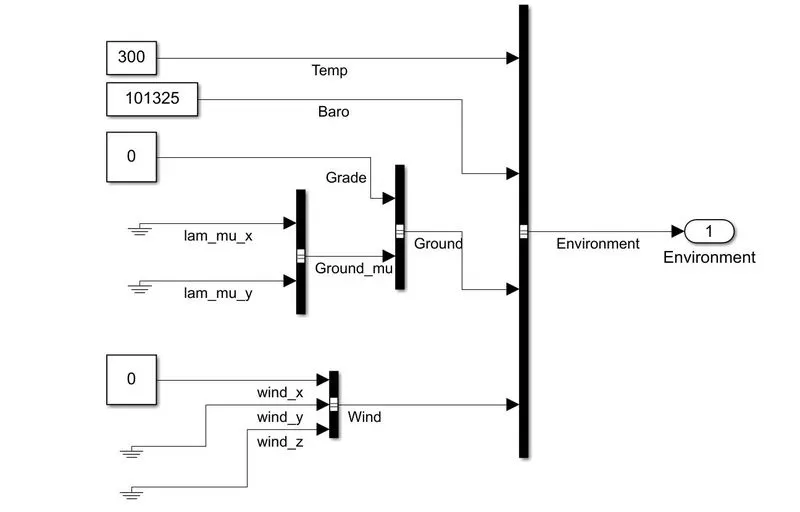
- To Run the HEV ReferenceApplication with WOT drive cycle and To Change the grade and wind velocity in the environment block.
- To compare the simulated results of hybrid and pure electric powertrains. Keeping all other parameters the same.
REFERENCE -
Software Required -
- MATLAB
1. To enumerate the difference between the mapped and dynamic model of engine, motor and generator and to change the model type.
MAPPED MODEL - Mapped model uses a steady-state 2d lookup table to characterize the model performance. the lookup table provides overall characteristics such as torque output, power output, fuel flow rate etc. we can also use a mapped model to study the effect of valve timing quantity of fuel injected on the engine output parameter.
DYNAMIC MODEL - dynamic model is used when we need a more detailed model. To have this type of model we need component level data because we need to give input to each component and take their output. This type of model is used to analyse the impact of individual components.
2. To explain how the model calculates miles per gallon and what factors are considered to model fuel flow.
In the US to compare the efficiency of gasoline vehicle with the BEVs, PHEVs, FCEVs MPGs unit was formulated it has been found that 1 gallon of gas has the same amount of energy as 33.7Kwh of electricity. In the case of an electric vehicle, this is to measure how much electric energy is consumed by the battery pack to travel a fixed distance.
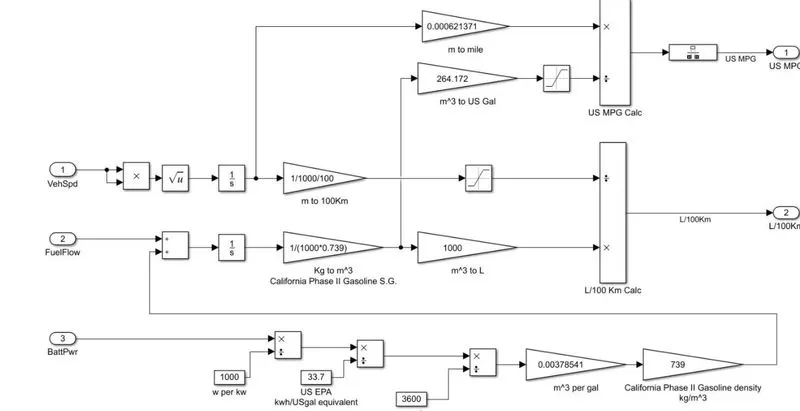 |
the fuel flow is calculated using two input which is vehicle speed and battery power.
3. To Run the HEV ReferenceApplication with WOT drive cycle and To Change the grade and wind velocity in the environment block.
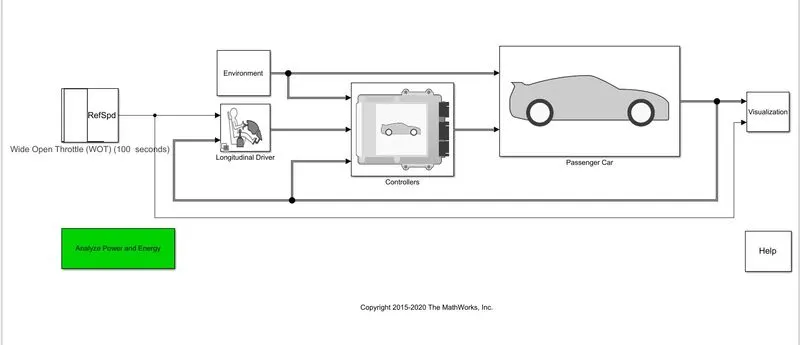
HEV REFERENCE APPLICATION BLOCK SET
 |
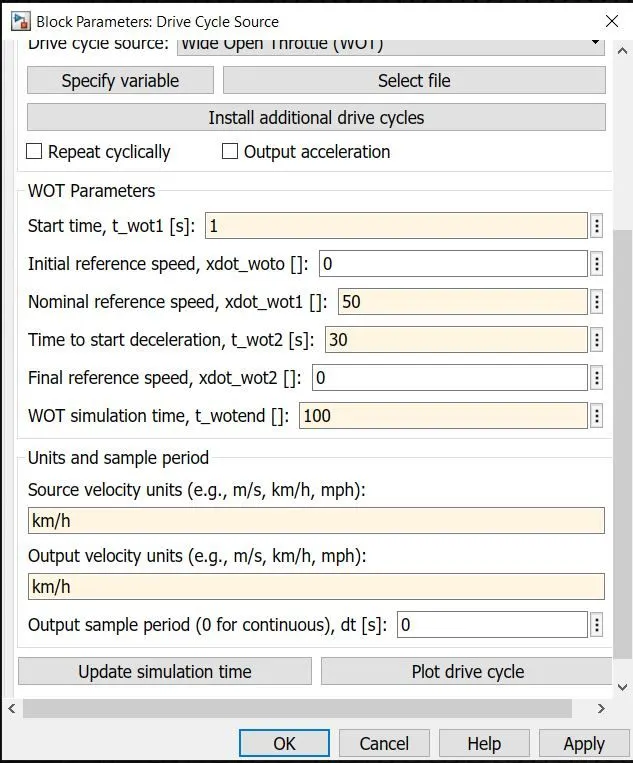
STEP-1 - Selecting the driving cycle as Wide-open throttle, Set required parameters -
 |
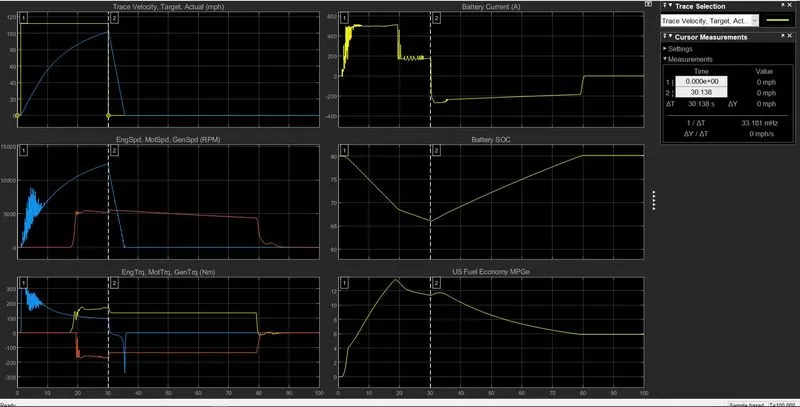
STEP-2 - output graph without changing grade and wind velocity.
 |
 |
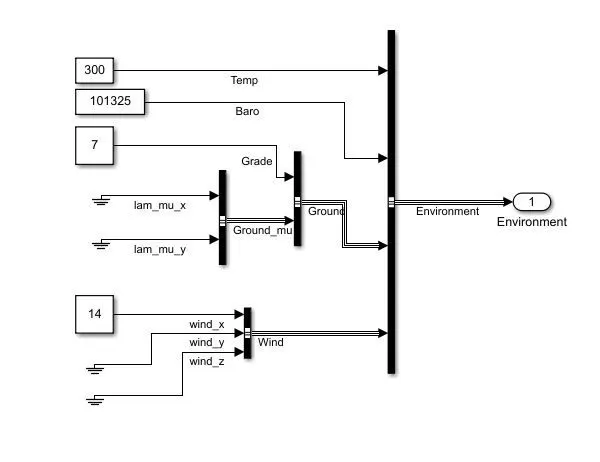
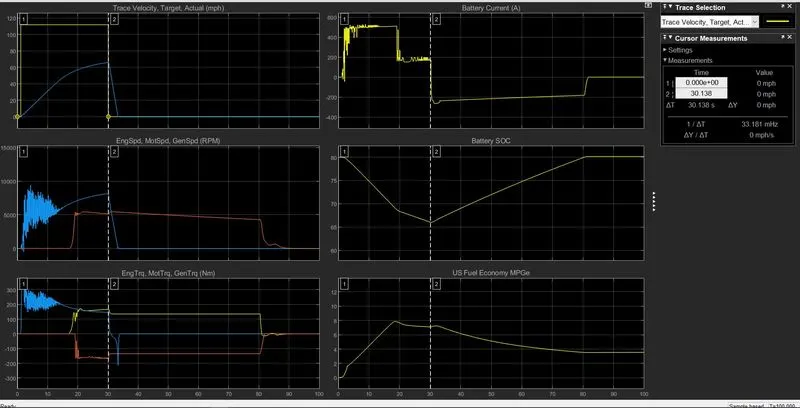
STEP-3- After adding grade-7deg and wind velocity 14m/s.
 |
 |
RESULTS-
- From the above outputs, we can say that the velocity of HEV with zero grade and zero wind velocity. The vehicle travels from 0 to 102 in 30.140 secs. and gradually decreases to zero in 5.874 seconds. but when the vehicle is added with grade and wind velocity. the vehicle travels from 0 to 65 in 29.86 seconds and gradually decreases to zero in 2.937 seconds.
- Trace velocity and the actual target - Yellow line shown in the graph above is the drive cycle input and the blue line is the actual output of the vehicle. the blue line couldn't reach the yellow line because of the low battery capacity.
- Battery current - we can see that when the acceleration is given the battery is utilised more and during deceleration or braking time the battery current gets to the negative side which indicates regenerative braking.
- Battery SOC - the State of charge of the vehicle decrease gradually and increases as the regenerative process is carried out.
- Engine speed, Motor speed, Generator speed - The blue line which is shown in the graph is the motor speed, initially, motor speed kicks as its as high torque. then engine speed and generator speed acts simultaneously.
- Engine torque, Motor Torque, Generator Torque - As we know motor torque is higher than the engine torque, so the motor starts first and gradually engine torque starts increasing, generator torque is negative because it's charging the battery.
- US Fuel economy - initially fuel economy of this vehicle increases and once the deceleration starts fuel economy starts decreasing because of the hill-climbing resistance more power required so fuel economy decreases.
4 - To compare the simulated results of hybrid and pure electric powertrains. Keeping all other parameters the same.
EV REFERENCE APPLICATION BLOCK SET -
|
OUTPUT GRAPH - After adding grade-7deg and wind velocity 14m/s.
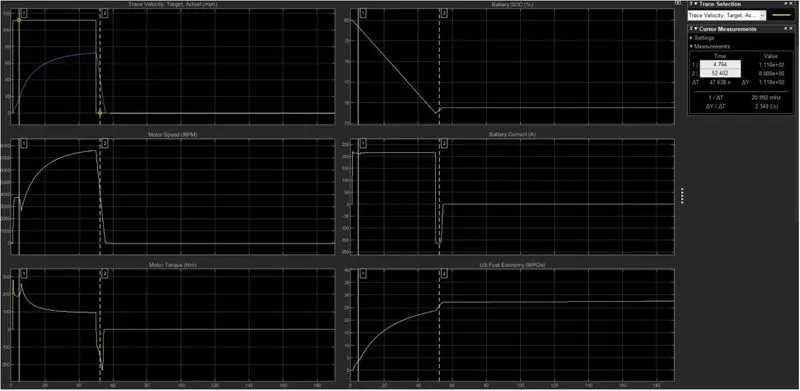 |
- Trace velocity and the actual target - In this graph was almost similar because the motor was the only component working here.
- Battery current -initially during acceleration battery current graph is the same in both EV and HEV but during deceleration, HEV had an upper hand because when the battery current is the negative engine was running in HEV but EV has only a short period of time for regenerative braking.
- Battery SOC - During deceleration in HEV there was a 15% improvement in SOC but whereas for EV during deceleration, there was only a 2% improvement in SOC.
- Motor speed and Motor Torque - Motor speed and motor torque in EV are more stable in HEV, this implies that battery power is more in EV than HEV.
- US Fuel economy - As far as fuel economy is considered EV's fuel economy is good compared to HEVs fuel economy.