AIM- To Prepare a technical report of Simulation of Baja all-terrain vehicle.Study_1-
- Study the Baja ATV with CVT and without a dashboard
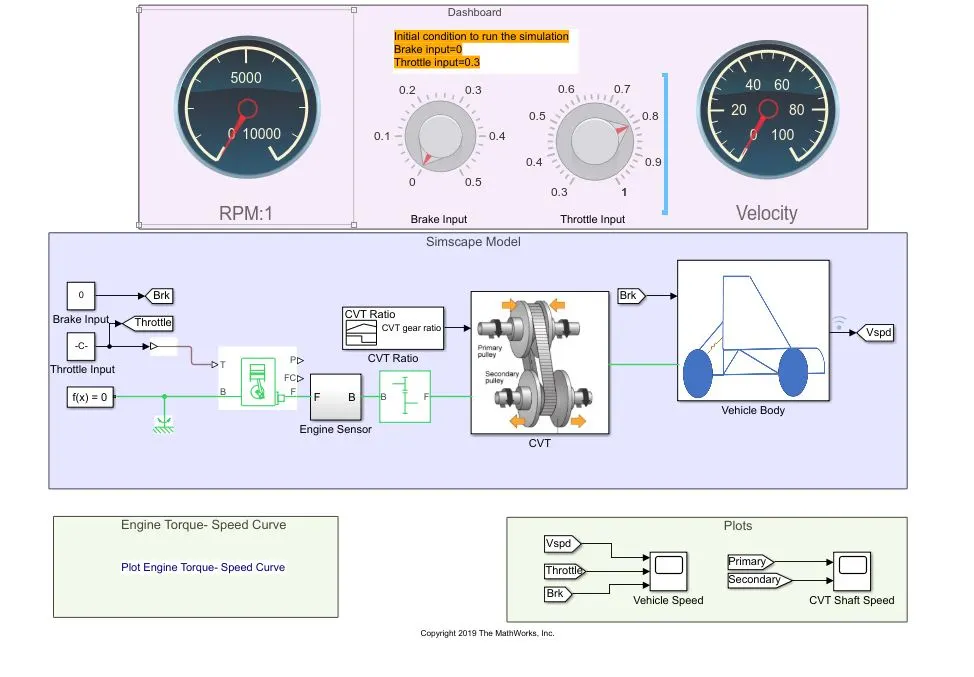
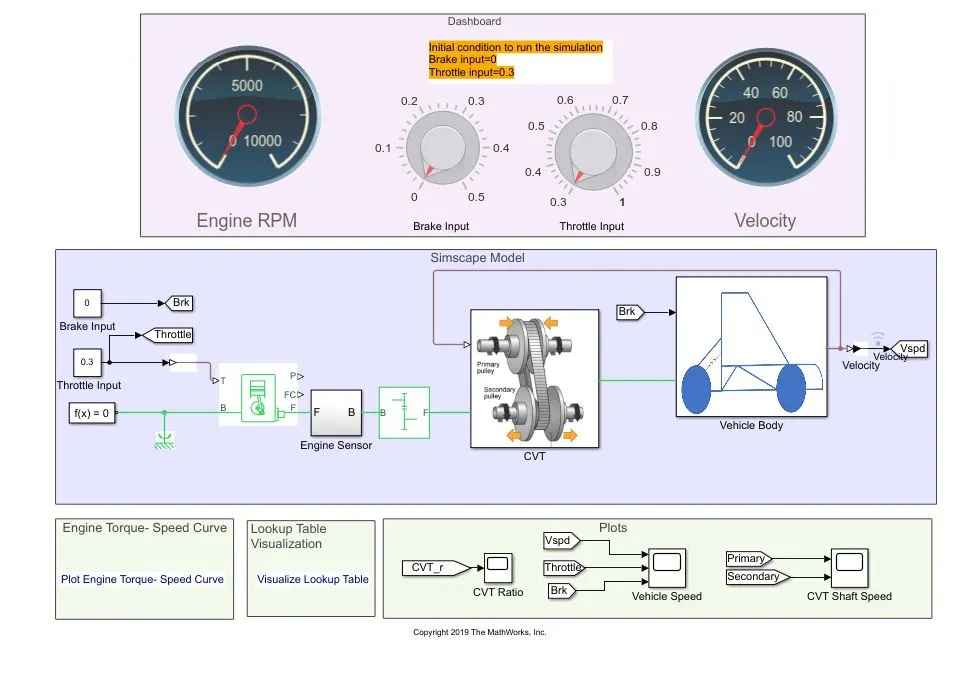
- Study the Baja ATV with CTV and dashboard
- Study the Baja ATV using lookup table without a dashboard
- Study the Baja ATV using a lookup table with dashboard
Study the Baja ATV with CVT and without a dashboard
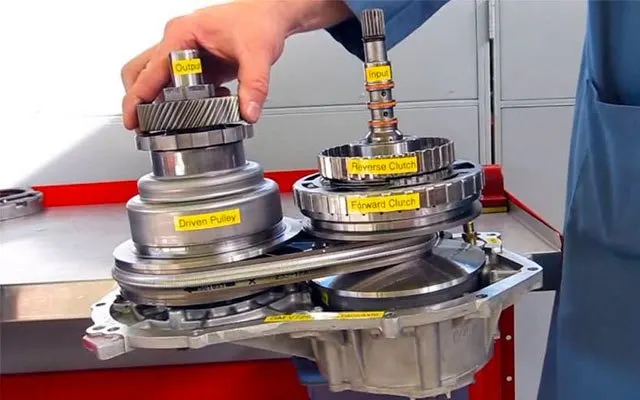
Continuous Variable Transmission (CVT)- CVT is one of the best automatic transmission where speed change is smooth and seamless. This transmission does not have step operation while changing between gears without interruption of torque flow. The CVT is more fuel-efficient than other automatic transmissions. CVT uses two pulleys with steel belts running between them. the CVT simultaneously adjusts the diameter of the "drive pulley" that transmits torque from the engine and the "driven pulley" that transfers torque to the wheels. Adjusting the diameter of drives helps them to continuously change the gear ratios.
| BAJA AVT MODEL WITHOUT DASHBOARD |
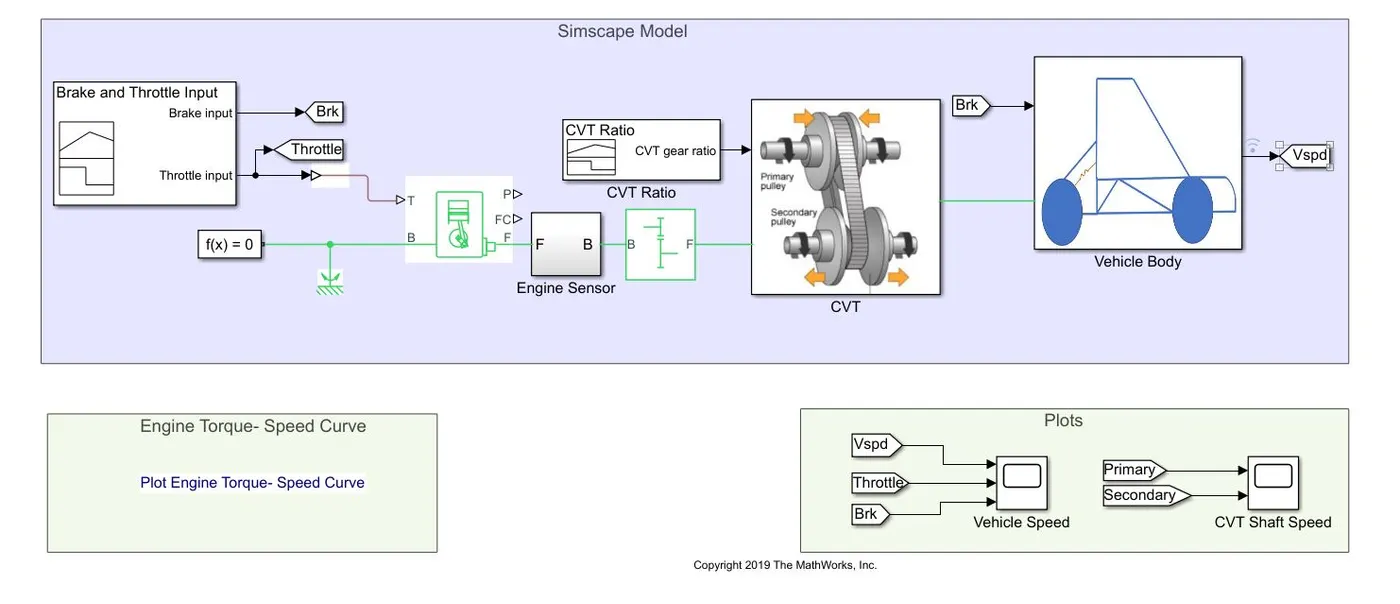
In the above simulation model, The components used are signal builder, solver, Generic engine, an Engine sensor subsystem (which contains the Ideal Rotational Motion Sensor), Simple gear, CVT subsystem (which contains input shaft inertia and output shaft inertia which represents primary and secondary pulley respectively and two ideal rotational motion sensor to sense the rpm of each pulley separately), and vehicle body subsystem (which contains brakes parameters, vehicle body block, tyres).
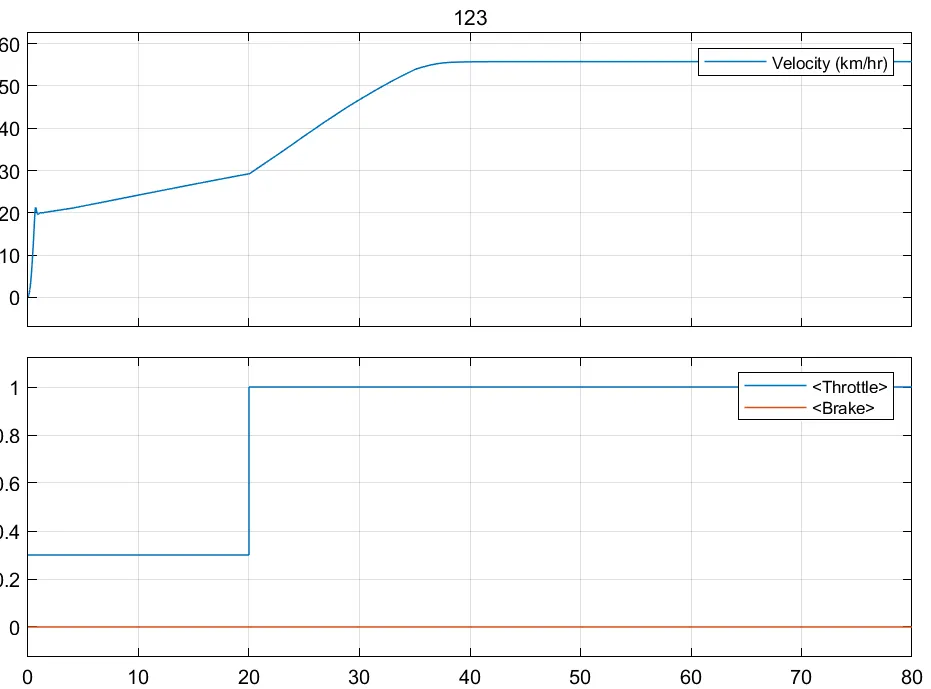
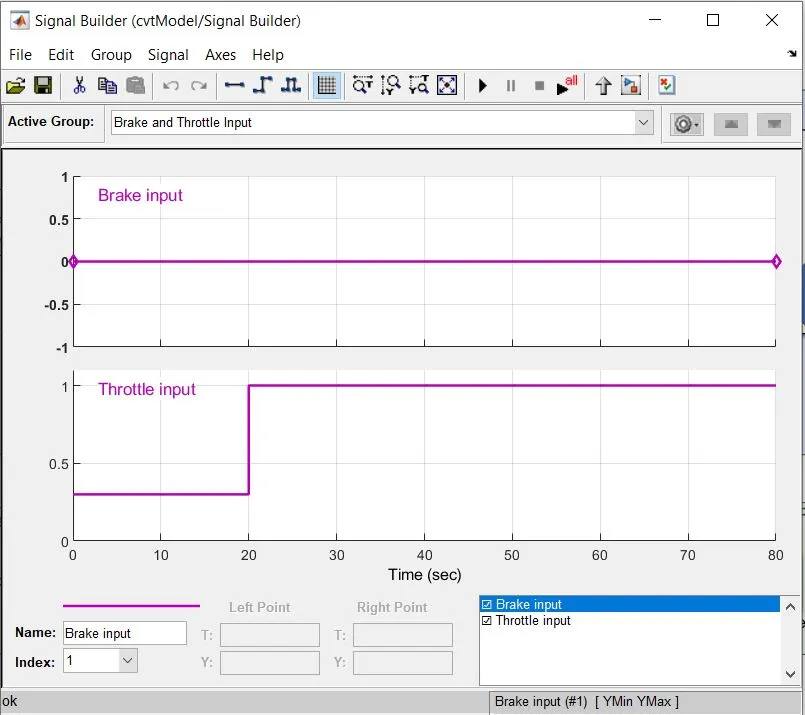
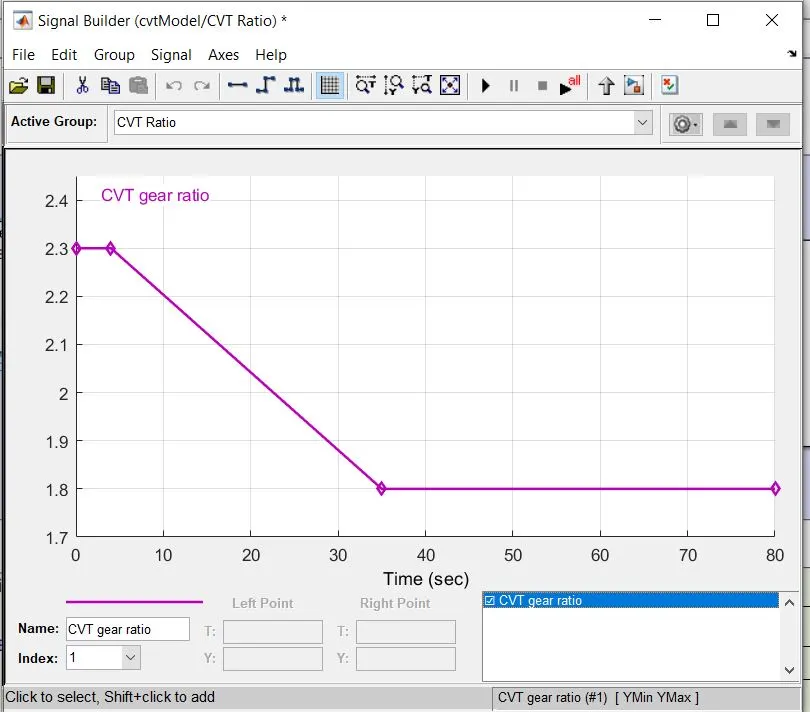
- SIGNAL BUILDER - Signal builder is used here as an input for brakes, throttle and gear ratio. as mentioned in the graphs below brake input is maintained as 0 throughout the simulation. the throttle input is given as 0.3 for the first 20 seconds and is increased to 1 for remaining time throughout the simulation. The gear ratio input is given as 2.3 for the first 5 seconds and linearly decreases to 1.8 and after that remains in 1.8 throughout the simulation. throttle input is given to the generic engine to control the flow of fuel into the engine.so that when throttle value increases fuel consumption increases and in turn increases the power of the engine.
 |
 |
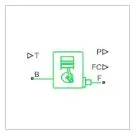
- GENERIC ENGINE - The Generic Engine block represents a general internal combustion engine.there are two types of engine, one is spark ignition and another one is a diesel engine. The rpm of this engine is 2100rpm. B and F are rotational conserving port with the engine block and engine crankshaft.T is a physical signal input port specifying the normalized engine throttle level and P is a Physical signal output port reporting the instantaneous engine power.
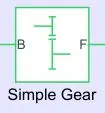
- SIMPLE GEAR - Simple gear is used for speed reduction to connect engine and CVT. B (base) and F (follower) are mechanical rotational conserving ports.
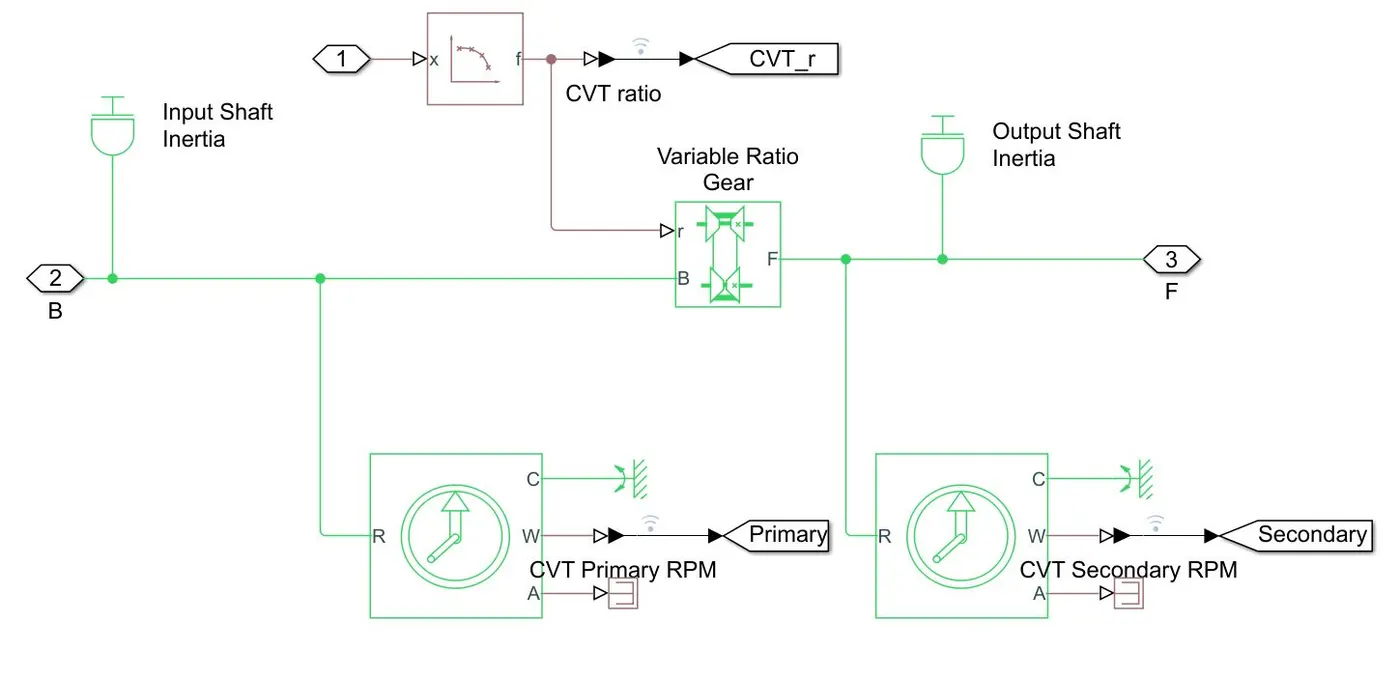
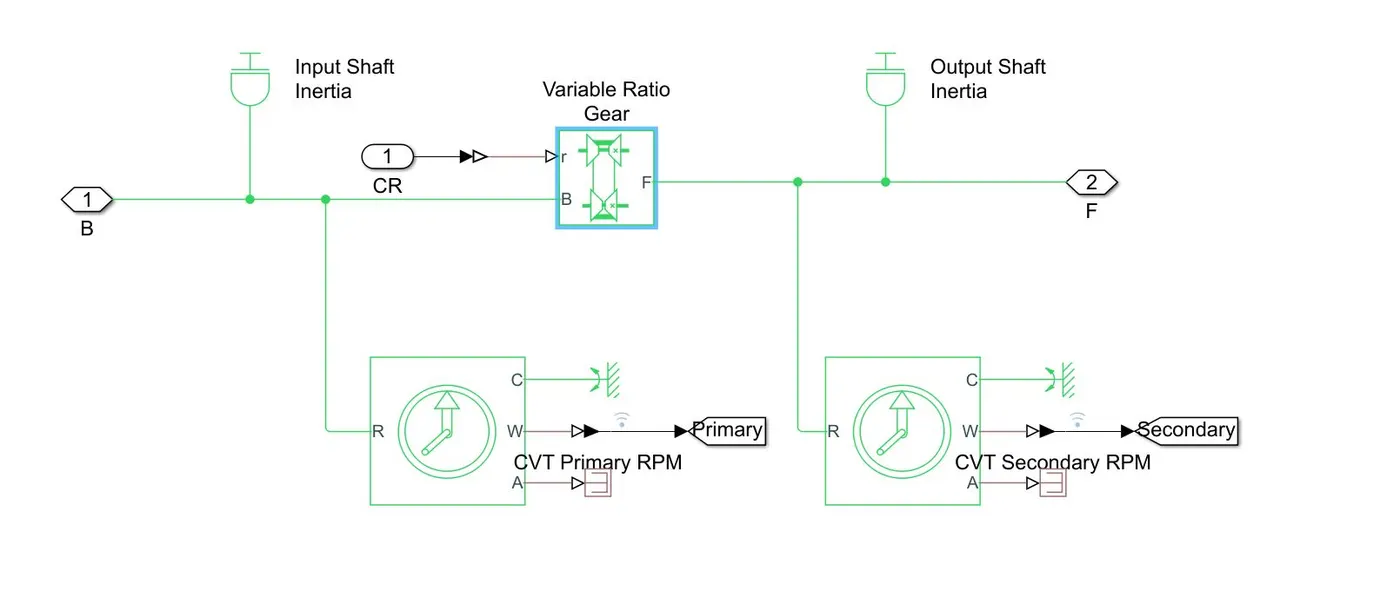
- CVT SUBSYSTEM - CVT subsystem consists of the input shaft inertia block represents the primary pulley and Output shaft inertia block represents secondary pulley. Variable ratio gear block is used to specify the gear ratio. The two Ideal rotational motion sensor is for sensing the RPM of each pulley separately.
 |
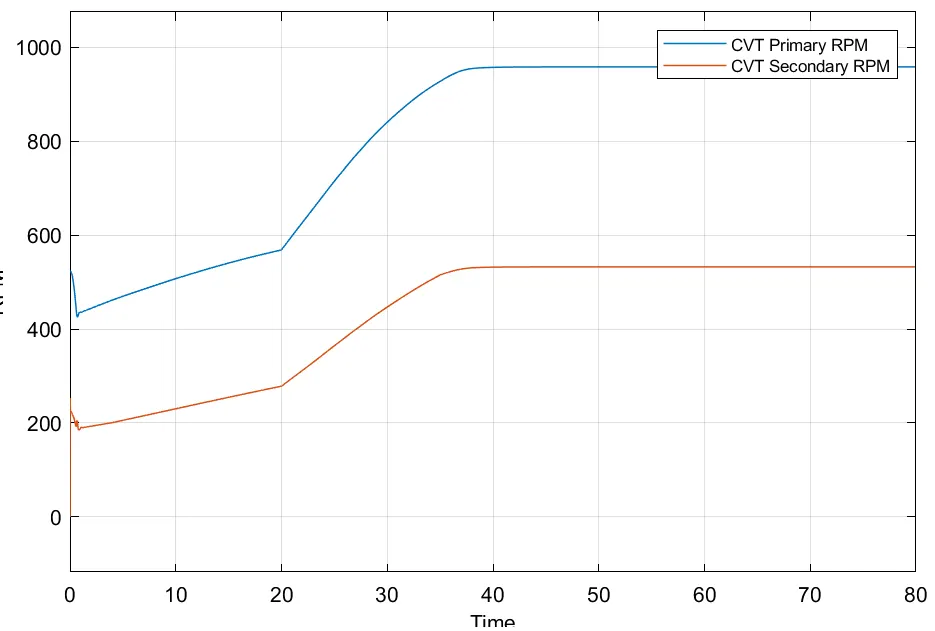
- CVT SHAFT SPEED - The below plot shows that primary pulley's RPM is higher compared to secondary pulley RPM, Therefore the radius of the secondary pulley is bigger than the radius of the primary pulley. therefore there is speed reduction in the vehicles actual speed. But as the variator in the CVT changes the radius of the secondary pulley smaller than the radius of the primary pulley then RPM of the secondary pulley would have been greater.
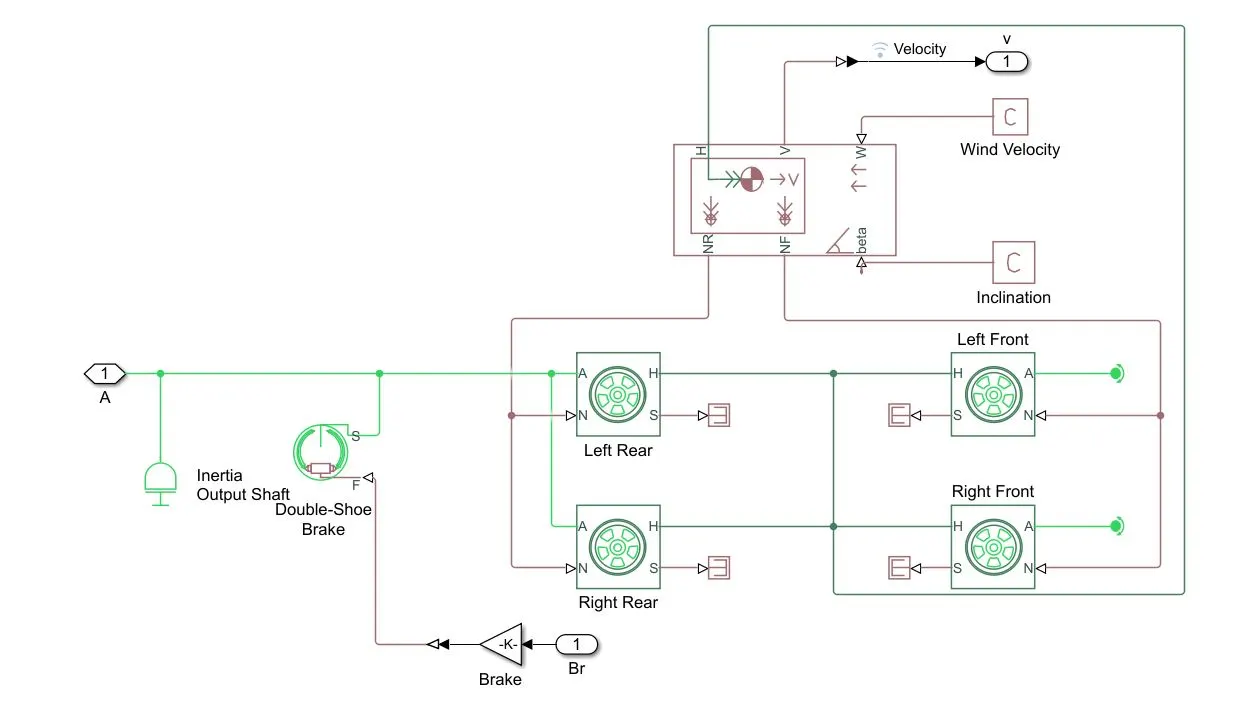
- VEHICLE BODY - Vehicle body subsystem contains four tyres, Vehicle body block where we can specify the vehicle mass which is 250kg, double shoe brake, wind velocity, inclination. double show brake Represents a brake arranged as two pivoted rigid shoes symmetrically installed inside or outside a drum and operated by one actuator. The actuator force causes the shoes to exert a friction torque on a shaft connected to the drum.
 |
- VEHICLE SPEED - From the below graph, we can say that as the throttle is increased, the velocity of the vehicle increases gradually.
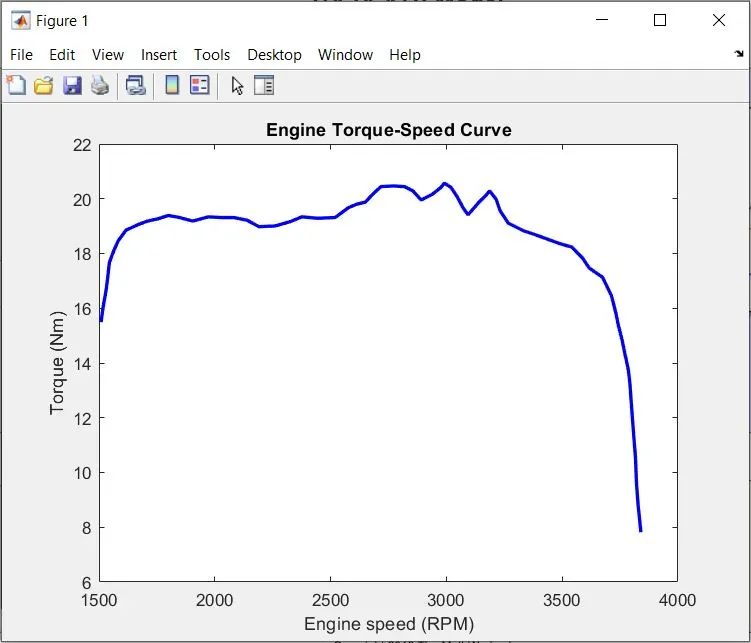
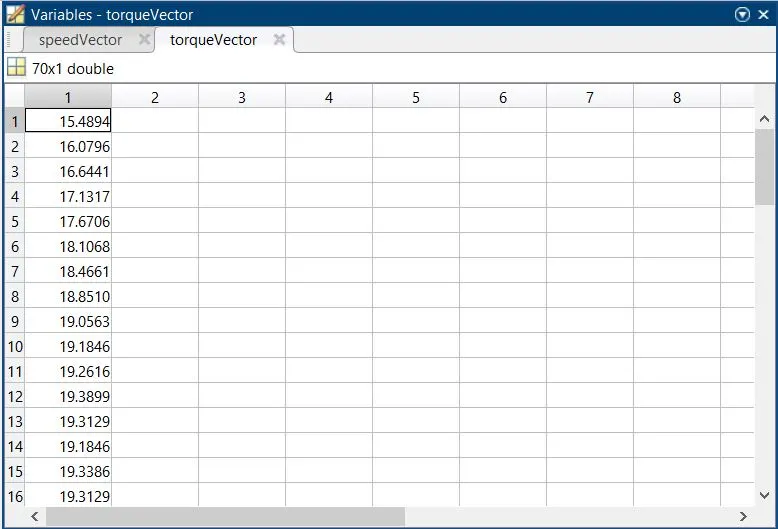
Engine Torque- Speed Curve - torque-speed curve is the input given by the user. To extract the data points from the image we use one of the file exchange called Grabit, and these data points are fed in the generic engine.
Study the Baja ATV with CVT and with a dashboard
In this above model, the only difference is that instead of signal builder for input, knobs are used we can even use slider gain for input instead of knobs. We can use knobs or slider gain because we can change the value of the inputs while the simulation is running.
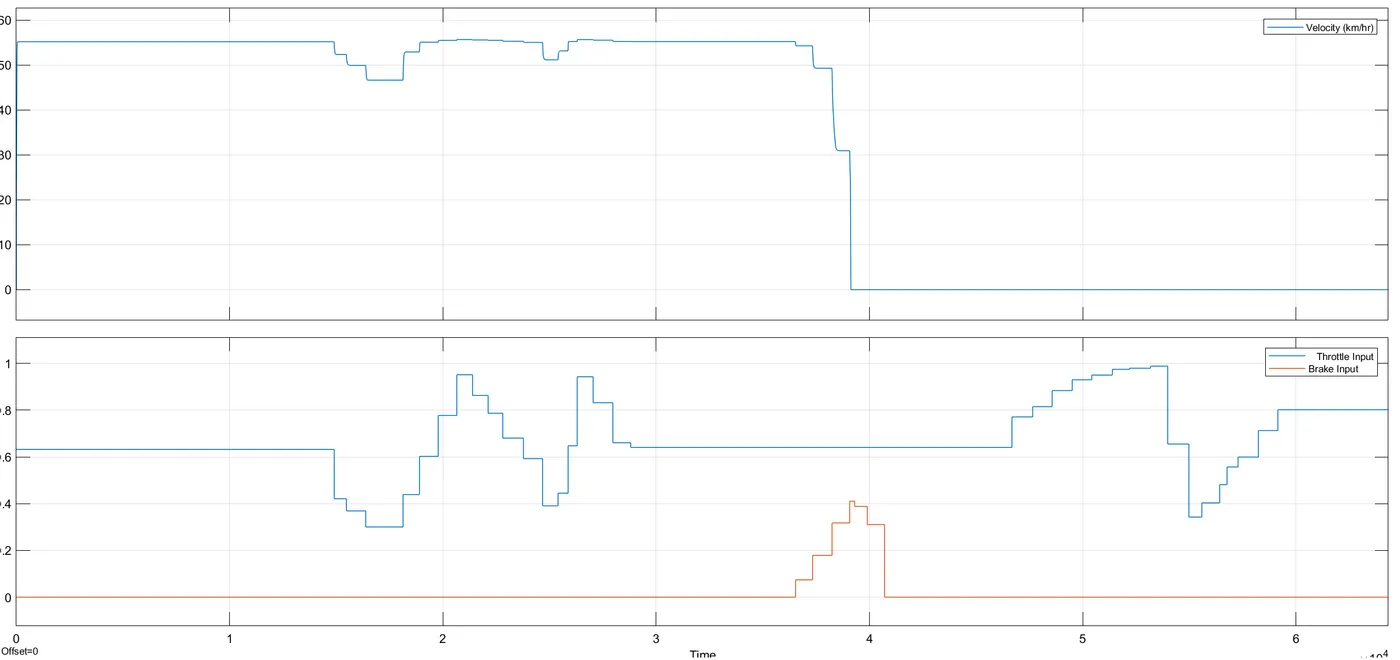
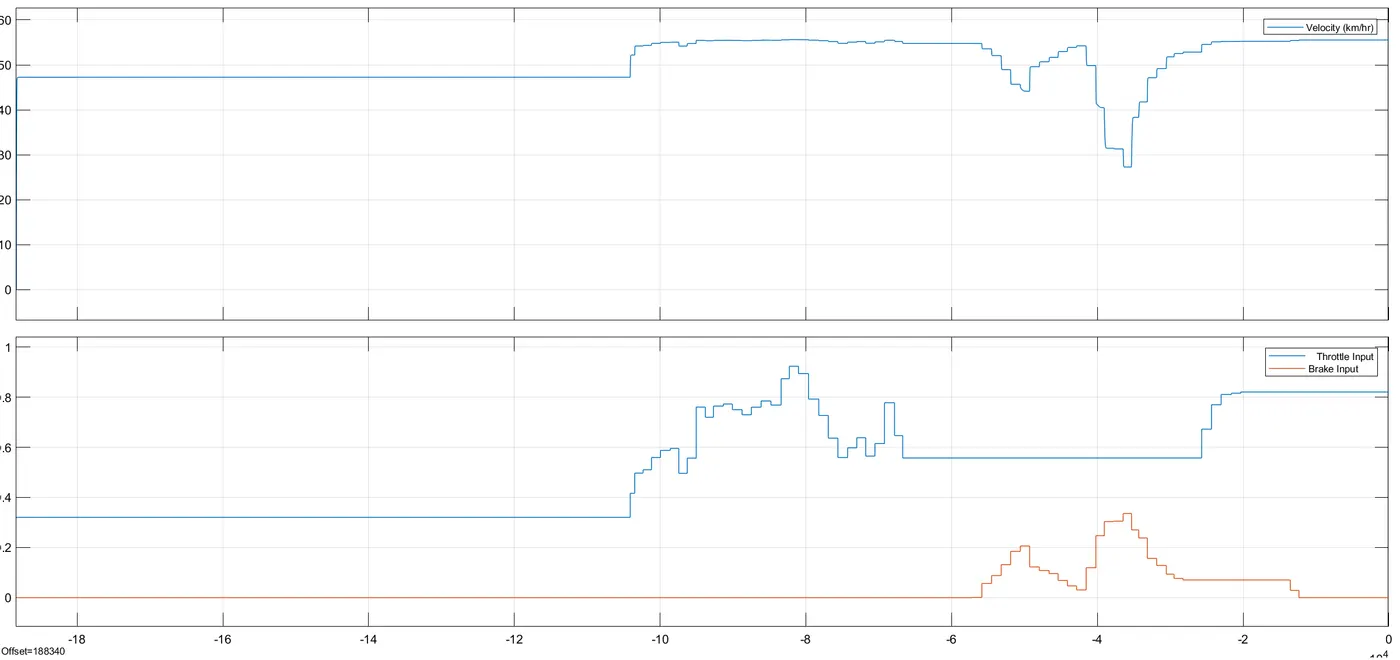
VEHICLE SPEED- From the below graph, we can say that as the throttle(knob) is increased the velocity of the vehicle increases similarly when the throttle is decreased the speed of the vehicle decreases.when the brake is applied velocity of the vehicle decreases to zero.
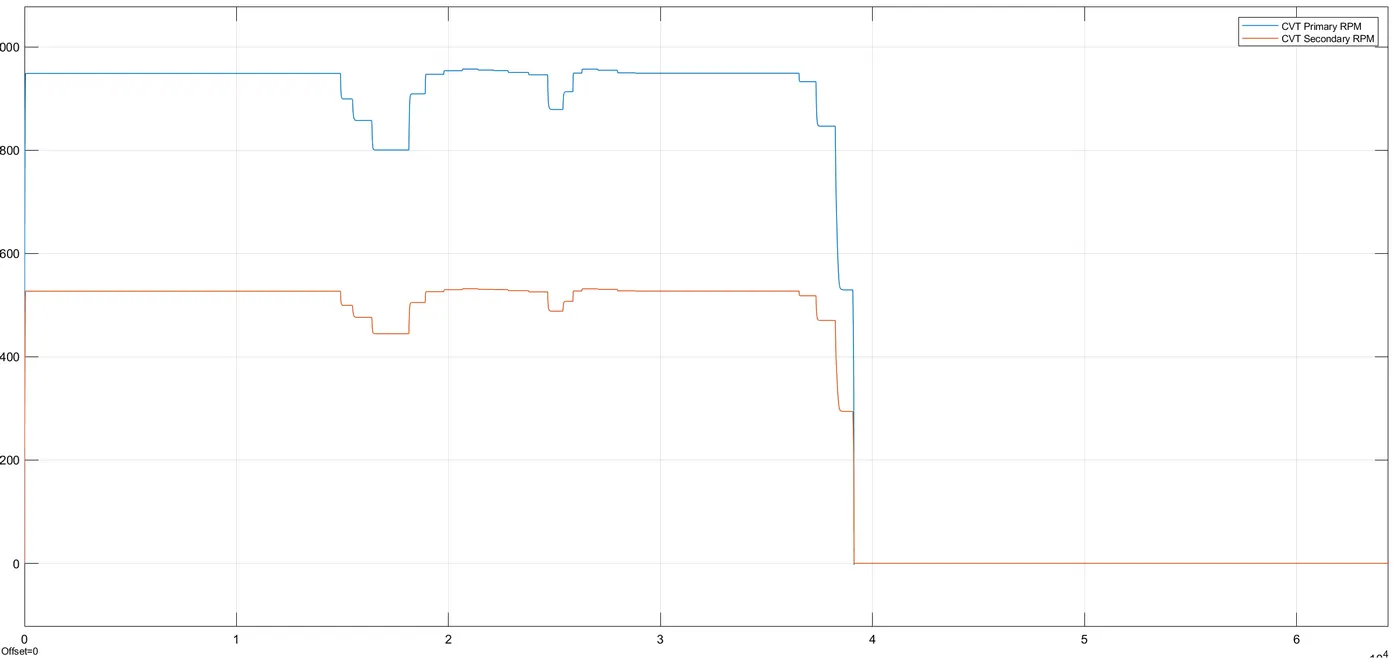
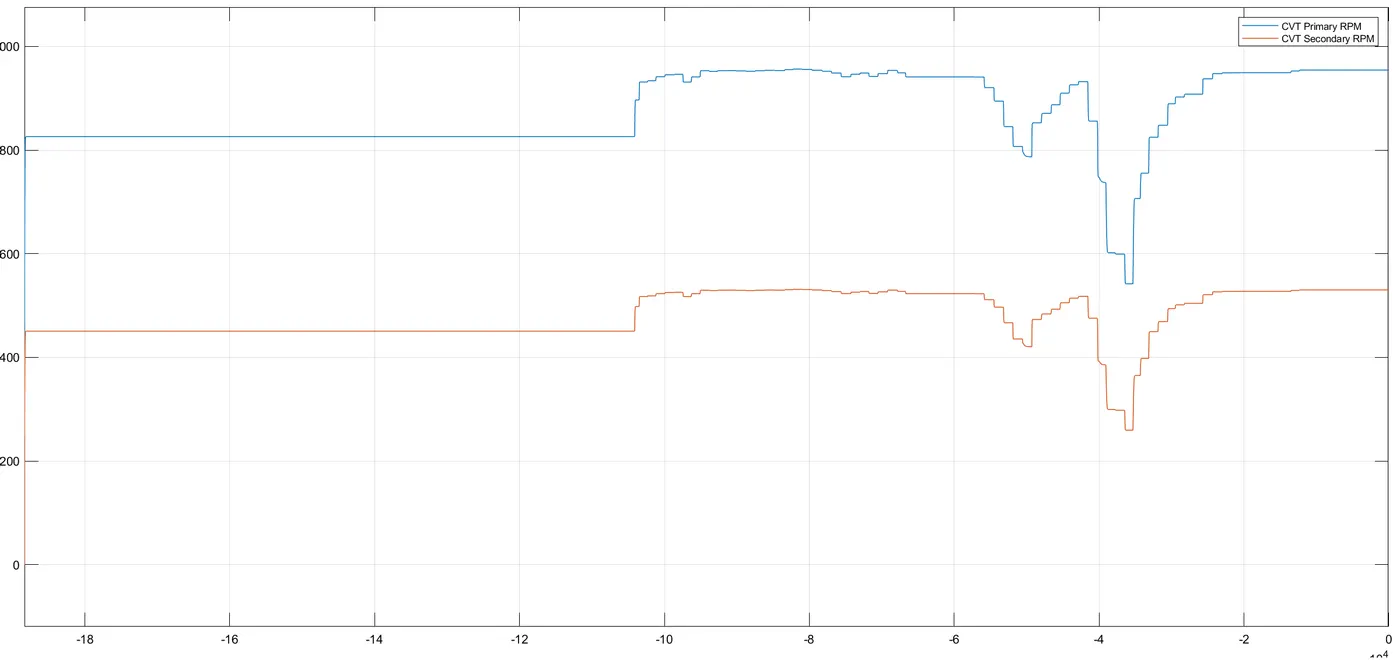
CVT SHAFT SPEED- From the below graph, we can say that RPM of the primary pulley is higher than RPM of the secondary pulley. therefore, the radius of the secondary pulley is greater than the radius of the primary pulley. In the graph, it clearly specifies that when the brake is applied both the pulley stops running.
Study the Baja ATV using lookup table without a dashboard
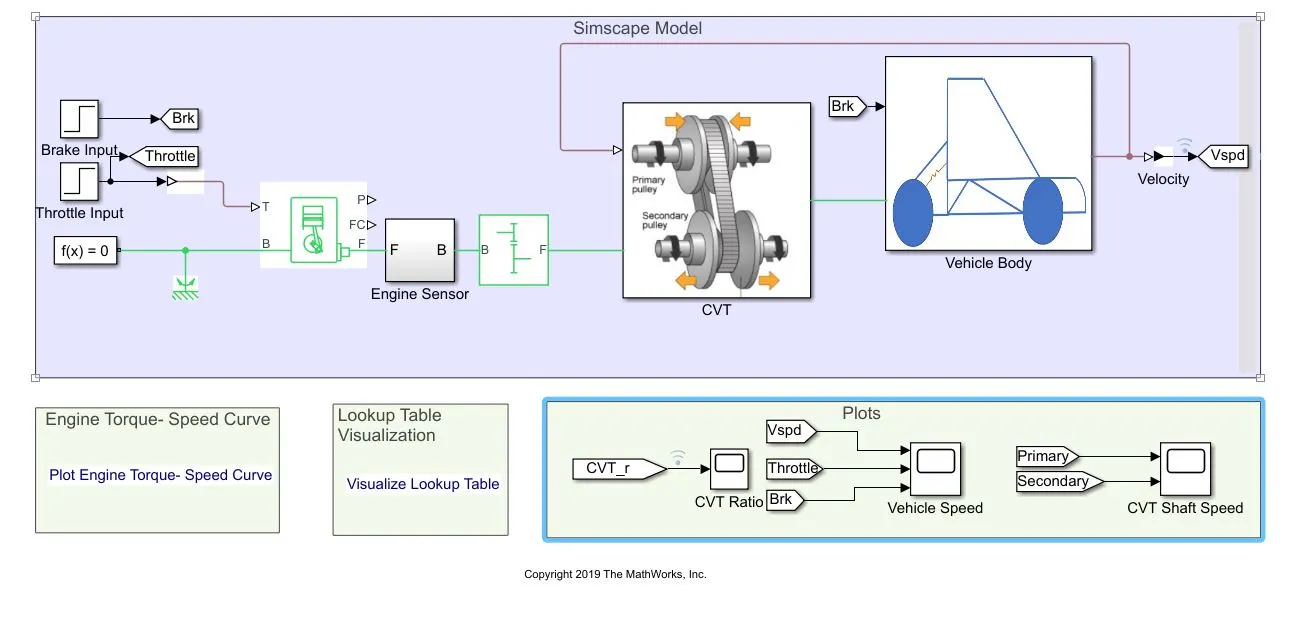
compared to the previous model everything is similar except in this gear ratio input to CVT is given through lookup table and there is feedback coming from velocity to CVT subsystem. The brake input and throttle input is given through step time. Earlier model it was the open-loop model and this is a closed-loop model.
as you can see, the lookup table replaced the CVT gear ratio input.
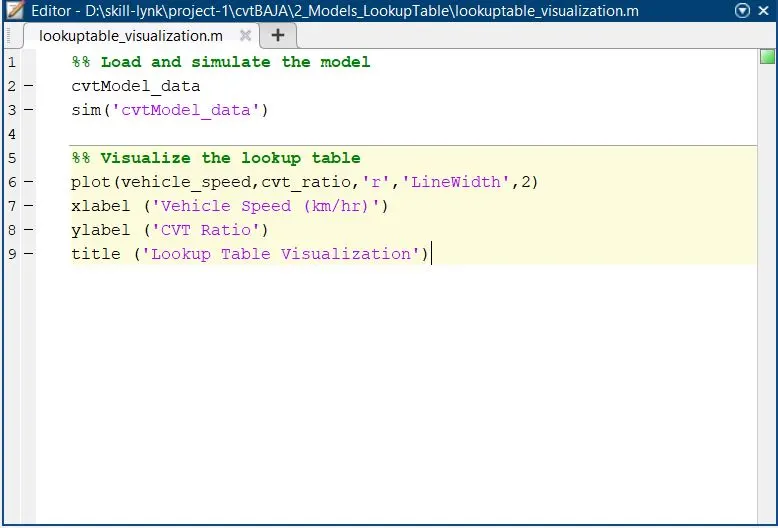
This is the script used to lock the CVT ratio and vehicle speed together.
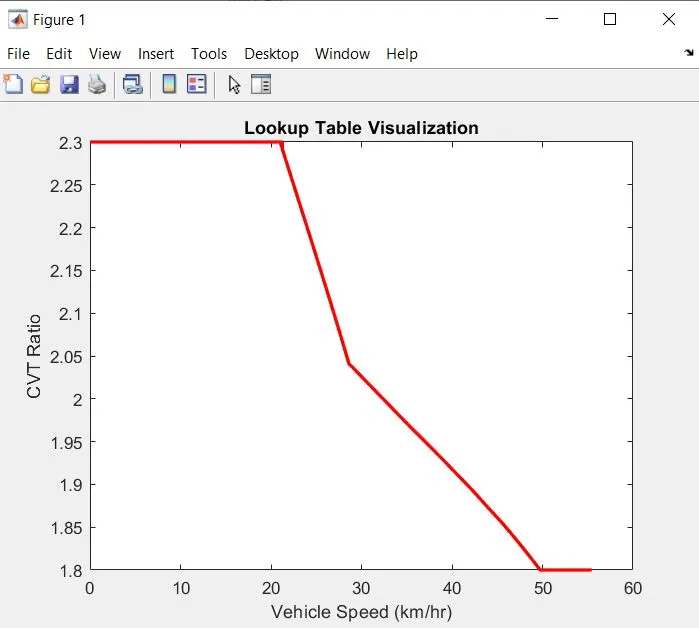
CVT RATIO OUTPUT- Lookup table are used to map output data based on input given. The output data corresponding to input is linked using a data array defined in the lookup table. Here in the lookup table, we can see that the CVT ratio varies from 2.3 to 1.8 and velocity value also changes with respect to vehicle speed.so, finally, we can conclude that the CVT ratio depends on the vehicle speed. (i.e)the vehicle accelerates, decelerates or remains constant when the CVT ratio is being varied.
Study the Baja ATV using a lookup table with a dashboard
this model is very similar to the previous model except for this model throttle input and brake input is given through knob(we can also use slider gain) and adjust the values while the simulation is running.
VEHICLE SPEED- From the below graph, we can say that as the throttle(knob) is increased the velocity of the vehicle increases similarly when the throttle is decreased the speed of the vehicle decreases.when the brake is applied velocity of the vehicle decreases.
CVT SHAFT SPEED- From the below graph, we can say that RPM of the primary pulley is higher than RPM of the secondary pulley. therefore, the radius of the secondary pulley is greater than the radius of the primary pulley. In the graph, it clearly specifies that when the brake is applied both the pulley stops running.
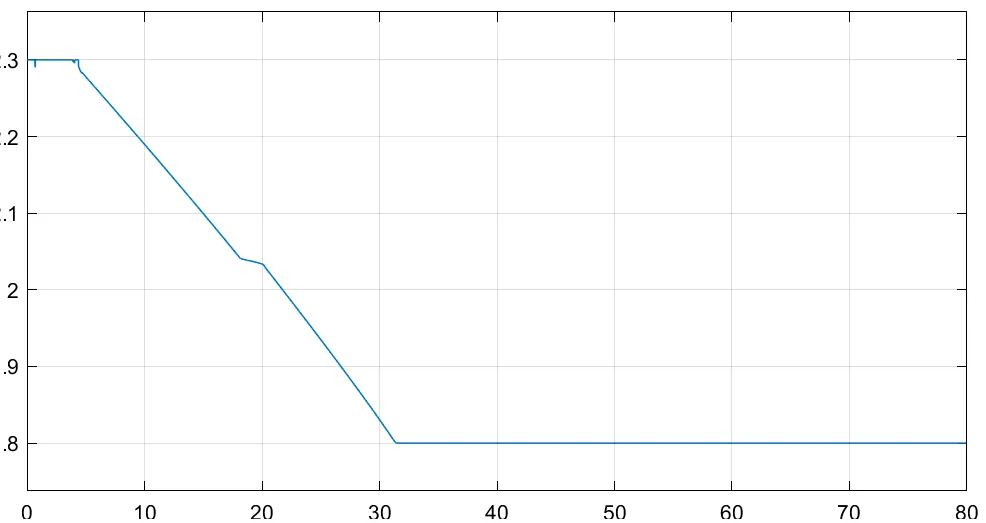
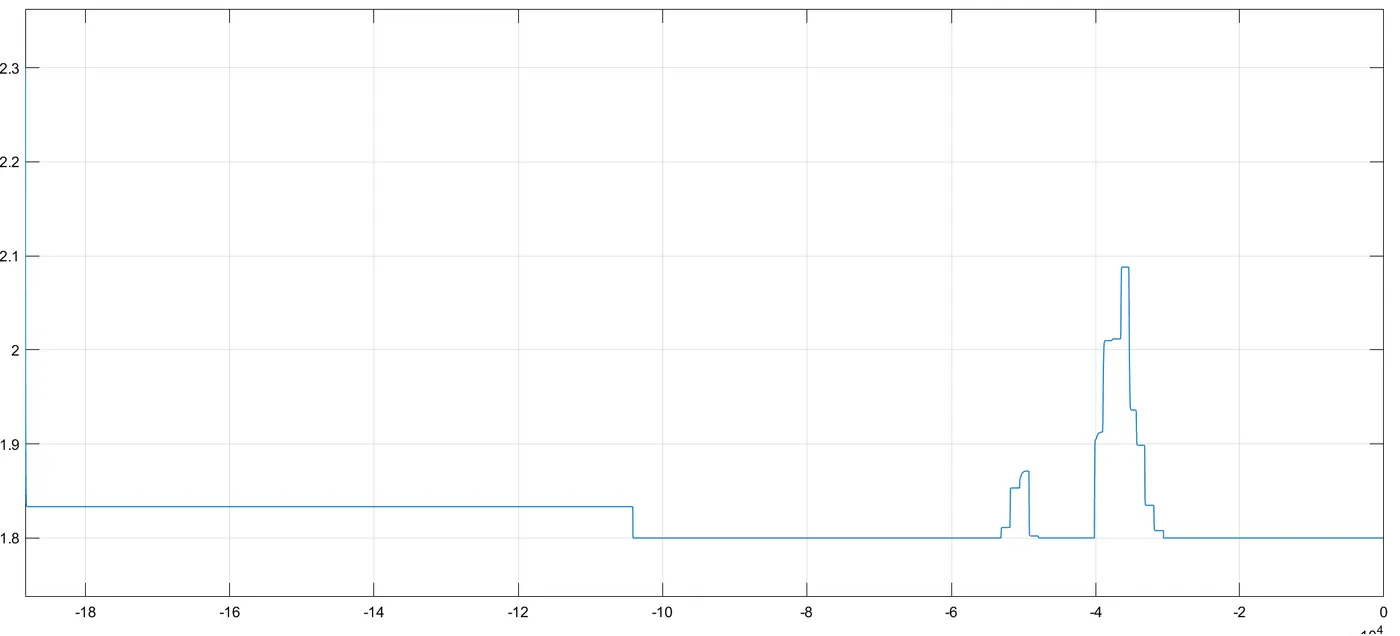
CVT RATIO- The CVT ratio for minimum and a maximum speed of the engine is predefined as 2.3 and 1.8 respectively. From the below graph and above model, we can say that initially, the throttle input is 0.3. As the throttle input is increased the engine speed reaches its maximum speed and gear ratio reaches 1.8 and when the brake input is gradually applied speed decreases respectively and gear ratio reaches 2.3. Here in the below graph, it didn't reach 2.3 because I didn't apply brake completely, I have just applied the brake partially. If I would have applied the brake till the brake input reaches 1.5 the gear ratio would have reached 2.3.
RESULT- From the above-explained details and output graphs, I understood and gone through all blocks of the model and understood the model by changing input parameters and examining the output values.
LEARNING OUTCOMES-
- This study was very helpful for me to understand how real-time vehicle simulation is carried out and also helped me get familiar with Simulink blocks.
- From the above graphs, we can say that vehicle speed and CVT shaft speed are directly proportional to throttle input and inversely proportional to brake input.