Control logic of Washing Machine and Gear shift Mechanism using Stateflow
| 1. |
AIM: To Implement control logic of a “washing machine” using Stateflow as per the given sequence
SEQUENCE:
- If the power supply is available, the system gets activated
- If the Water supply is not available, stop the process & indicate through LED
- Soaking time should be 200s followed by Washing time of 100s.
- Then rinsing happens for next 20s & dryer runs for 50s
- After all the processes have completed turn on the finished LED
STATEFLOW-It is a feature to convert our logic into a systematical arrangement. Stateflow provides a graphical language that includes state transition diagrams, flow charts, state transition tables, and truth tables.
STATEFLOW CHART :
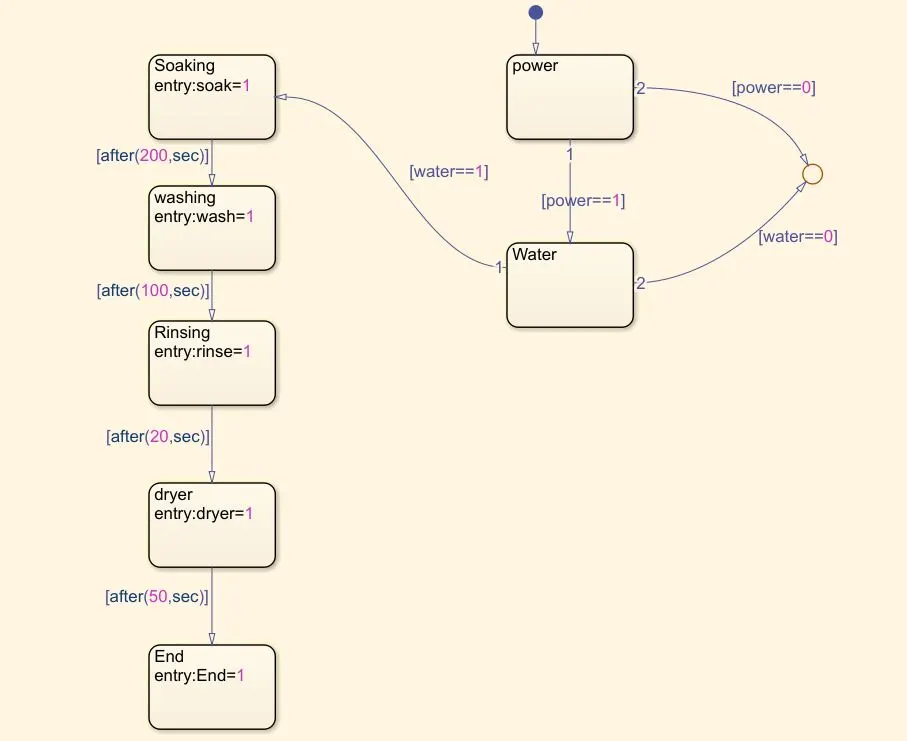 |
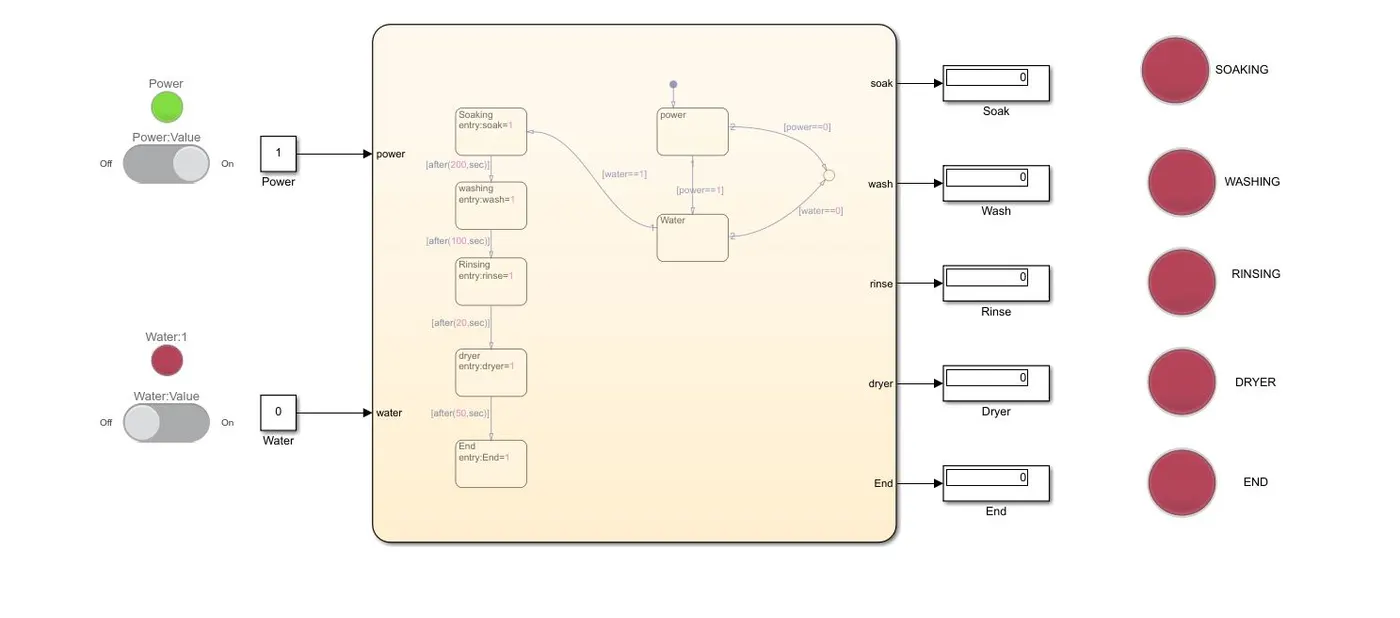
EXPLANATION OF STATEFLOW DIAGRAM-
- Power supply and water supply is created and connected with a condition( if power is turned ON, it reaches water supply and after it checks whether the water supply is turned ON, finally when both power supply and water supply is turned ON remaining steps starts in a step by step manner).
- Next step is a soaking process which takes place for 200 seconds after that washing process takes place for 100 seconds, then the rinsing process takes place for 20 seconds. then finally the drying process takes place for 50 seconds.
SYMBOLS PANE-
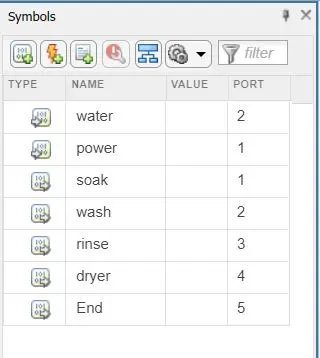 |
symbol pane plays a major role when it comes to assigning input and output data. From the above diagram Water and Power are input data and Soak, wash, rinse, dryer and End are output data. This pane helps in creating input and output port for outside connections.
BLOCK DIAGRAM-
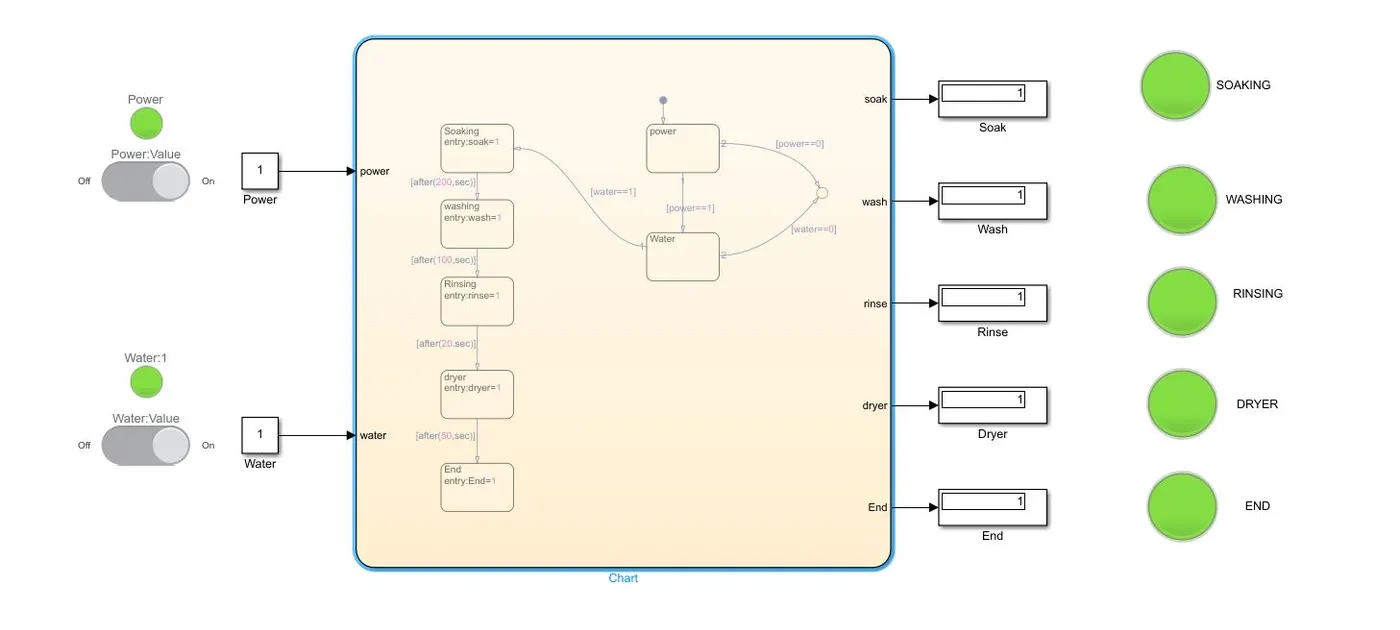 |
EXPLANATION-
- To switch ON the power supply we can just slide the power-value similarly to switch ON the water supply we can just slide the water-valve.
- the simulation time is set for 500 seconds.
- the system acts according to the condition given through Stateflow chart and displays the output in display block and also indicates via lamp block.
Now let's play around with different input conditions-
CASE-1: Power OFF and Water supply ON
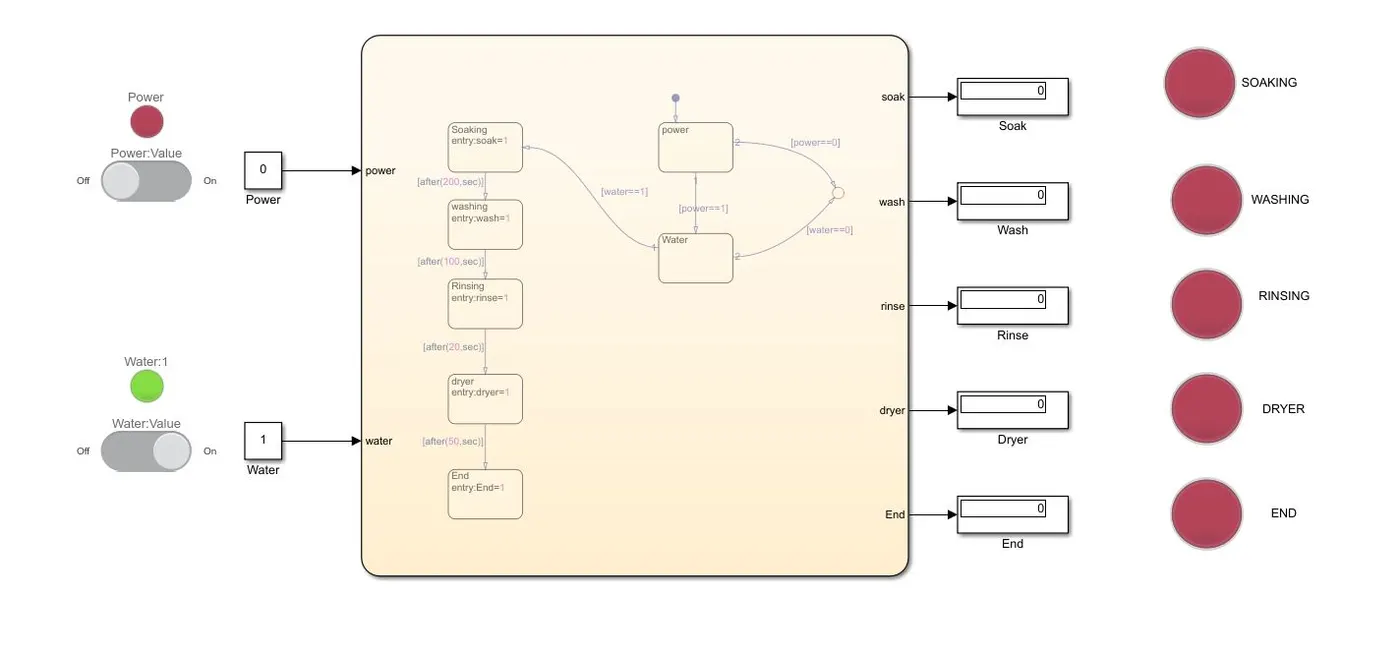 |
when the input power is OFF, the whole system doesn't work.
CASE-2: Power ON and Water supply OFF
 |
when the input power is ON and Water supply is turned OFF, the whole system doesn't work.
CASE-3: Power ON and Water supply ON
|
From the above diagram, when the power supply and water supply both are turned ON the system starts working according to conditions and display output in display block and indicated via lamp blocks.
RESULTS- From the above block diagrams we can say that control logic of a “washing machine” using Stateflow is implemented successfully.
| 2. |
AIM- To Make a Simulink chart for the “Gear shift” logic as per below conditions
CONDITIONS-
| Speed Range(km/hr) | Gear |
| 0 to 15 | 1 |
| 16 to 25 | 2 |
| 26 to 40 | 3 |
| 41 to 60 | 4 |
| Above 61 | 5 |
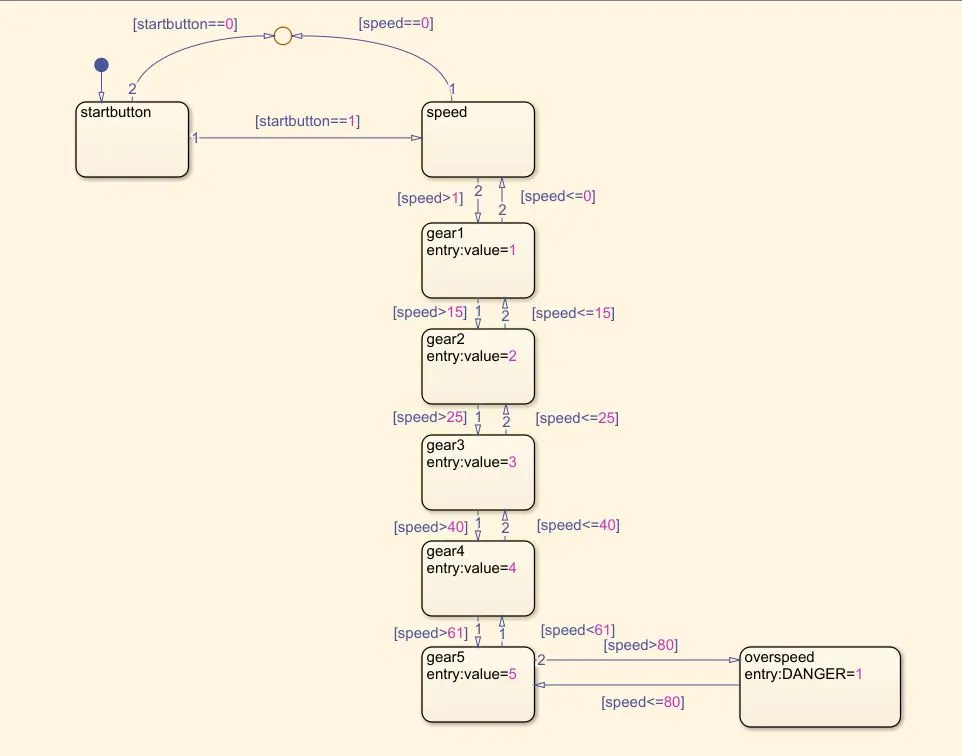
STATEFLOW CHART-
 |
EXPLANATION -
- The above chart shows that when the start button is turned ON, the engine starts and speed is in a neutral position.
- when the speed of the vehicle is more than 1kmph, gear swifts to 1st gear.
- when the speed of the vehicle increases and gets more than 15kmph, gear swifts to 2nd gear. and as soon as the speed decreases and becomes less than or equal to 15kmph, the gear swifts to 1st gear again.
- similarly, as speed increases gear swifts automatically to respective gear position as per the given condition.
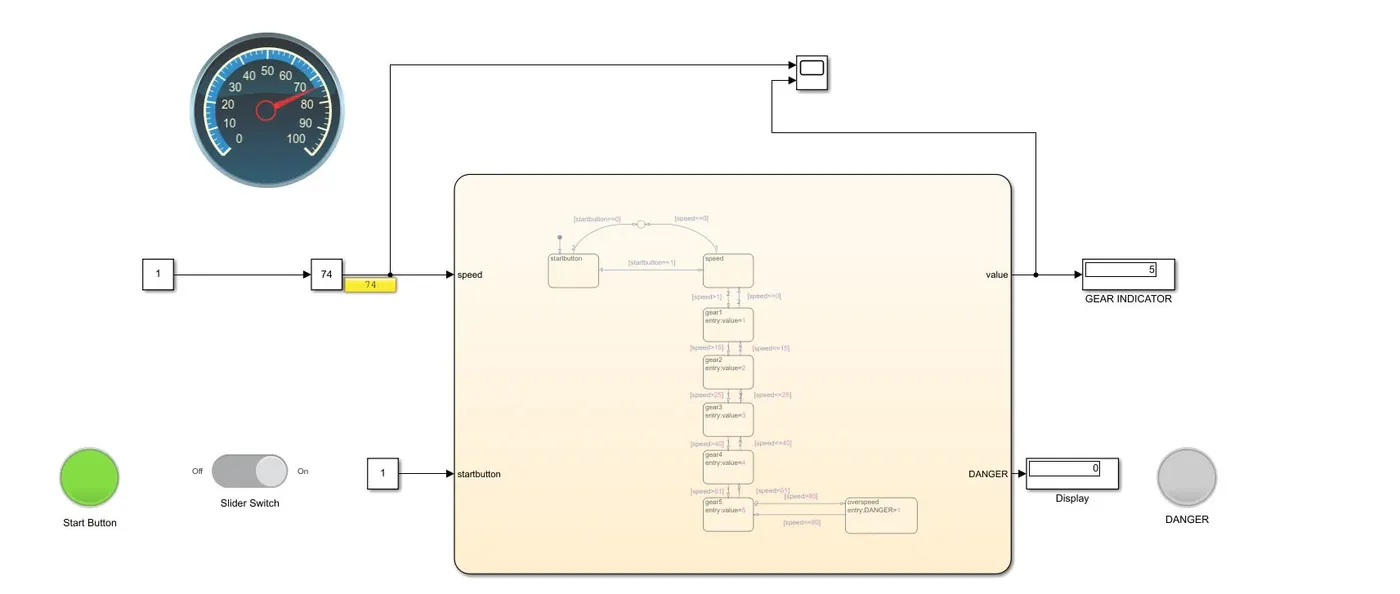
BLOCK DIAGRAM -
 |
SYMBOL PANE-
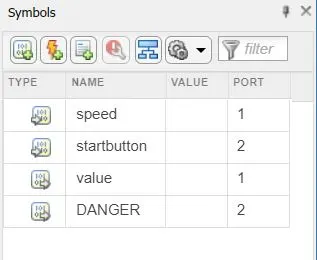 |
symbol pane plays a major role when it comes to assigning input and output data. In the above diagram Speed and start button are input data and value and Danger are output data.
EXPLANATION-
- Slider gain is used as input for speed. slider gain acts as a throttle to increase or decreases the speed while the simulation is running. Circular gauge is used to display the current speed of the vehicle.
- Constant is given as input to the start button. the slider switch is connected to the constant block so that we can turn ON/OFF the start button.
- Display block is used to display the current gear position.
- Again display block is used to display 1 or 0 if the value is 1, we can say that speed is more than 80kmph and the lamp is connected to the display. (when display=1, the lamp glows)
GRAPH-
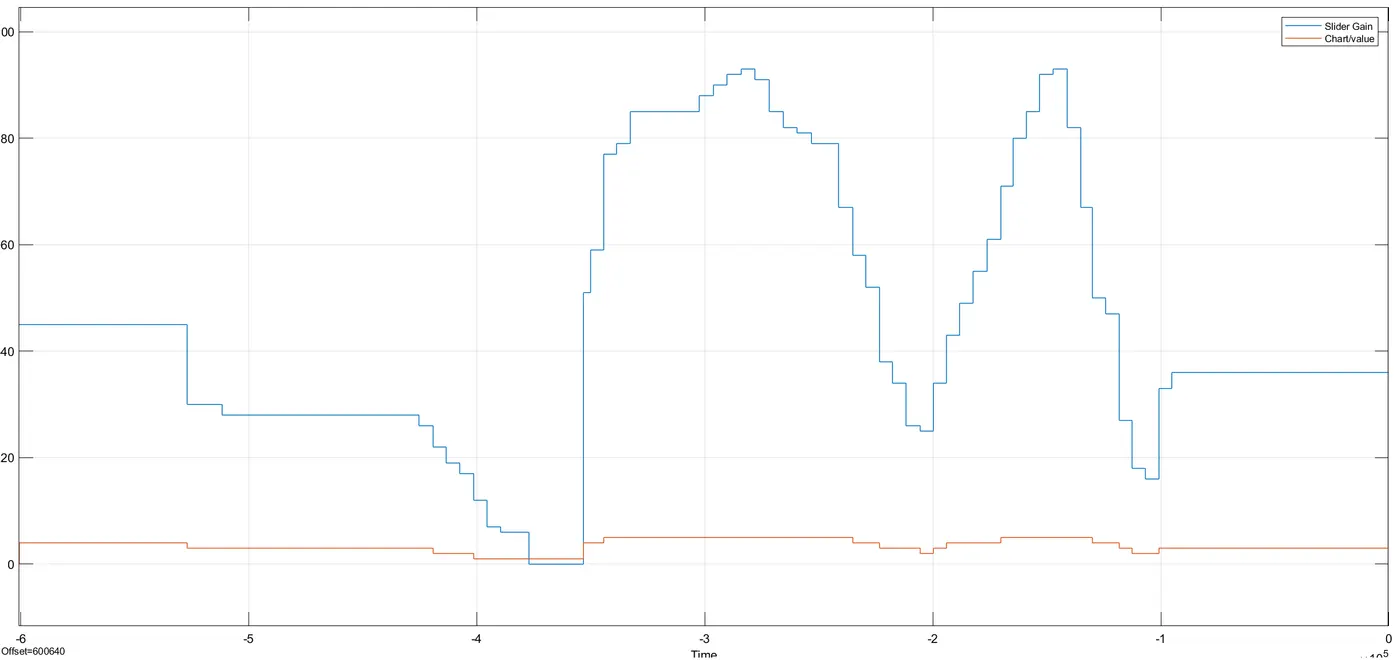 |
RESULT- From the above graph we can say that as the speed increases gear swifts according to the given conditions.