Week - 4
-
Implement control logic of a “washing machine” using State flow as per given sequence
Condition:
- If the power supply is available, the system gets activated.
- If the Water supply is not available, stop the process & indicate through LED.
- Soaking time should be 200s followed by Washing time of 100s.
- Then rinsing happens for next 20s & dryer runs for 50s.
- After all the processes have completed turn on the finished LED
Objective:
To implement control logic of a washing machine using State flow as per given sequence
Theory:
- Control logic of washing machine: The sensors of washing machine continually monitor varying conditions inside the machine and accordingly adjust operations for the best wash results. Since there is no universal control logic, different machines perform in different manners. Typically, fuzzy logic controls the washing process, water intake, water temperature, wash time, rinse performance, and spin speed. This optimises the life span of the washing machine. More sophisticated machines weigh the load (so you can’t overload the washing machine), advise on the required amount of detergent, assess cloth material type, and water hardness, and check whether the detergent is in powder or liquid form. Some machines even learn from experience, memorising programs and adjusting them to minimise running costs.
- State flow: A MATLAB Simulink function that provides a graphical language that includes state transition diagrams, flow charts, state transition tables, and truth tables. You can use State flow to describe how MATLAB algorithms and Simulink models react to input signals, events, and time-based conditions. State flow enables you to design and develop supervisory control, task scheduling, fault management, communication protocols, user interfaces, and hybrid systems.
- State machine: It is a representation of an event-driven (reactive) system. In an event-driven system, the system makes a transition from one state (mode) to another, if the condition defining the change is true.
Working:
For the given input parameters, i.e.,
- When power supply is available, the given LED lights GREEN, if not lights RED
- If, the 1st condition is satisfied, then machine turns ON and check for water.
- If Water is available, the second LED light GREEN and proceeds to the next step. If not, machine stops the process and lights RED and alert the user
- With enough water level, the machine soaks the clothes for 200 sec as instructed followed by a washing time of 100 secs.
- And finally, the rinses process takes place for 20 secs and finally dryer works for the last 50 secs.
Once all the steps are completely processed, the Finished LED lights Green.
- Chart
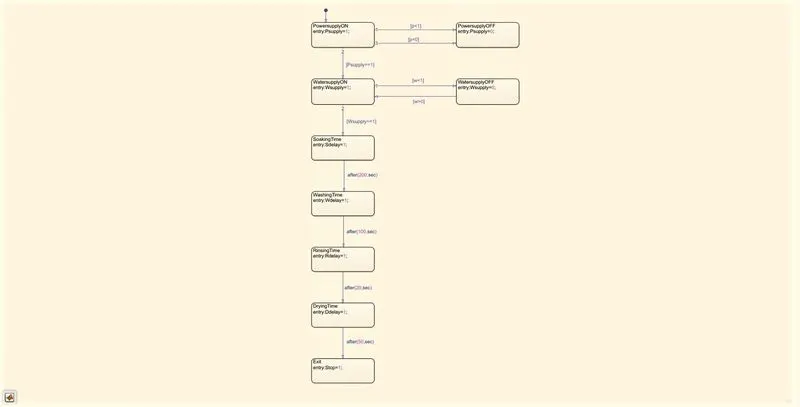
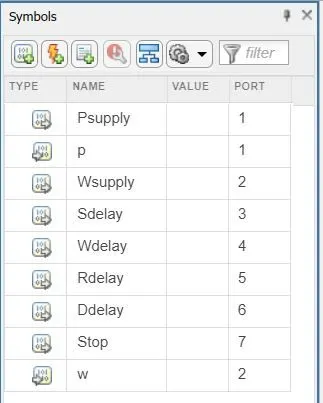
- Symbols Pane:
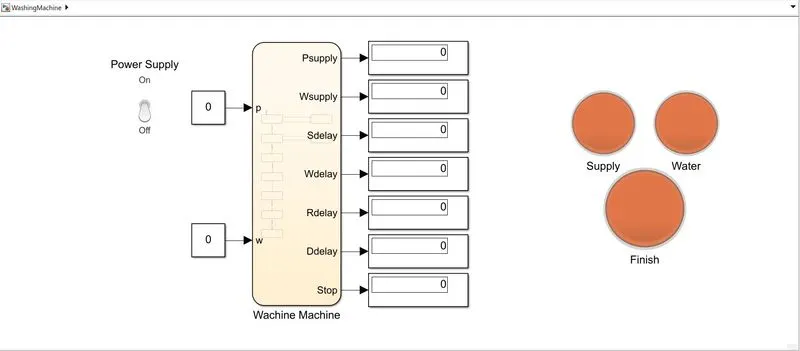
- Case 1: Both Power and Water Supply are OFF
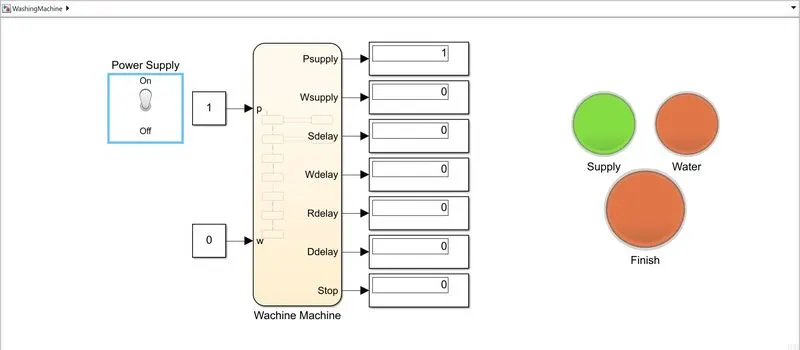
- Case 2: Only Power supply is ON:
Case 3: When both Power and Water supply are available: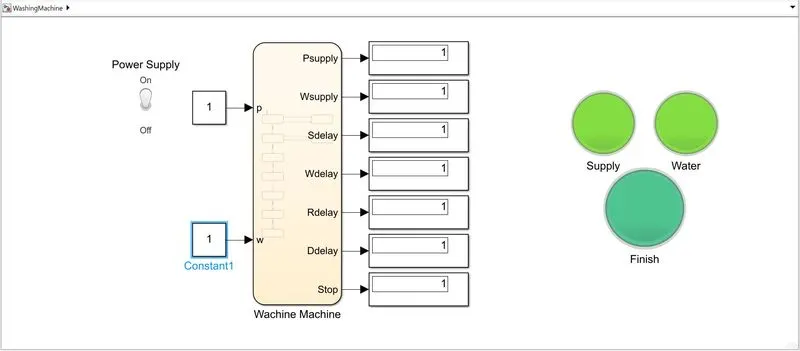
Observation:
When the power supply is available, the system gets activated. If the Water supply is not available, the machine stops the process & indicate through LED. The machine works as instructed and follows as the steps of Soaking time = 200s followed by Washing time = 100s. Then rinsing happens for next 20s & dryer runs for 50s. After all the processes have completed turn on the finished LED
-
Make a Simulink chart for the “Gear shift” logic as per below conditions:
Speed Range(kmph) Gear
0 to 15 1
16 to 25 2
26 to 40 3
41 to 60 4
Above 61 5
Give speed input while the simulation is running & display the gear number.
Objective:
To make a Simulink chart for the Gear shift logic as per the conditions.
Working:
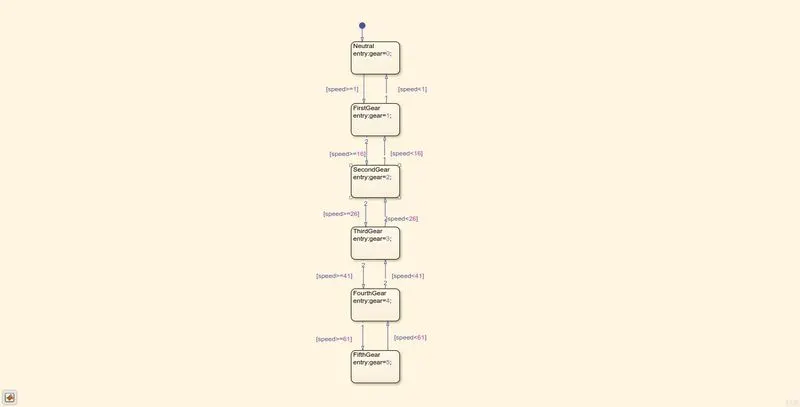
- The Speed to Gear ratio has been fed to the Chart.
- The gear shifts happen whenever the speed exceeds or fall behind the corresponding gear’s speed range.
- When the speed is greater than zero, the Gear will be in position 1 and when it reaches 16 Kmph, as per the requirement, the gear is shifted to position 2 till position 5
- Similarly, as per the speed drops, the gear position also falls to lower levels according to the speed.
- Chart:
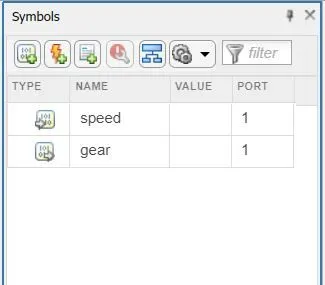
- Symbols Pane:
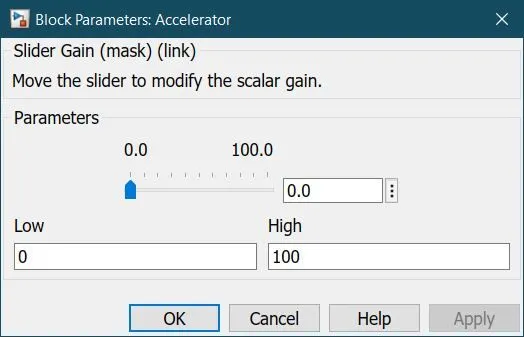
- Slider Gain:
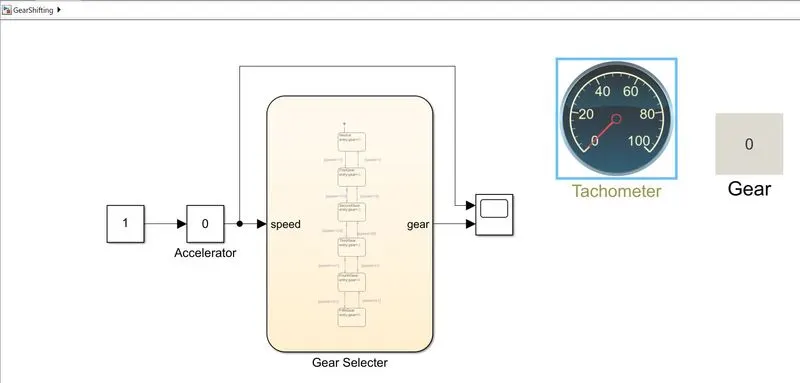
- Model:
During Operation: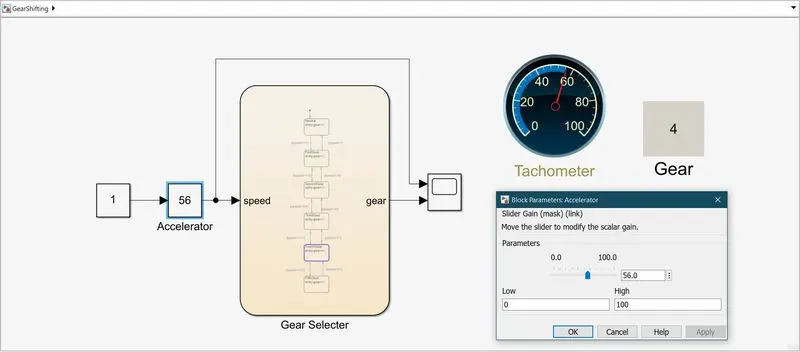
Observation:
The gear responds to the respective speed range and shifts accordingly. A slider gain used to behave like an accelerator, and a tachometer is connected to the slider gain to mimic a dashboard experience.