Week-4 Challenge WOT Condition Part-2
WEEK 4 CHALLENGE – WOT 2
- What is the difference between the mapped and dynamic models of engine, motor, and generator? How can you change the model type?
Internal Combustion Mapped and Dynamic Engine Models
Mapped:
- A model is said to be mapped when it uses a set of steady-state lookup tables to characterize engine performance.
- Here, the tables provide overall engine characteristics, including actual torque, fuel flow rate, BSFC, engine-out exhaust emissions, etc.
- These are used when you have engine data from a dynamometer or a design tool like GT-POWER and for quasi-steady-state engine simulations.
- There are two types of Mapping;
- Ci Mapped
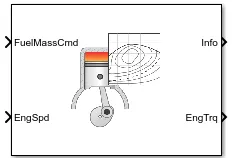
- Si Mapped
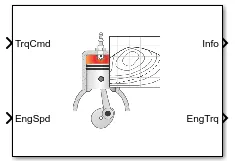
- Ci Mapped
Dynamic:
- The model decomposes the engine behavior into engine characteristics that are separated into lower-level components. By combining components in this way, the models capture the dynamic effects.
- These are used when you need a more detailed dynamic model and have component-level data and to analyze the impact of individual engine components on the overall performance.
- There are two types of Mapping;
- Ci Engine
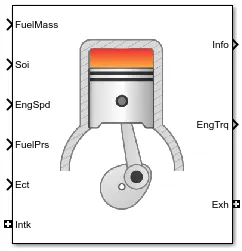
- Si Engine
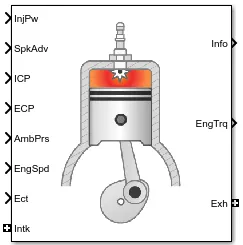
- Ci Engine
Mapped and Dynamic Motor Models
Mapped:
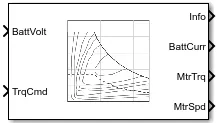
- The Mapped Motor block implements mapped motor and drive electronics operating in torque control mode.
- The output torque tracks the torque reference demand and includes a motor-response and drive-response time constant.
- Use the block for fast system-level simulations when you do not know detailed motor parameters, for example, for motor power and torque trade-off
- The block assumes that the speed fluctuations due to mechanical load do not affect the motor torque tracking.
- You can specify:
- Port configuration — Input torque or speed.
- Electrical torque range — Torque speed envelope or maximum motor power and torque.
- Electrical loss — Single operating point, measured efficiency, or measured loss
Dynamic:
- It contains an Interior PM controller, Three Phase VSI, and internal PMSM.
- Here, the data’s are adjusted in real-time
Hybrid Electric Vehicle Reference Application
- The hybrid electric vehicle reference application represents a full multimode hybrid electric vehicle (HEV) model with an internal combustion engine, transmission, battery, motor, generator, and associated powertrain control algorithms.
- Using the reference application, it is possible to simulate
- powertrain matching analysis and component selection
- control and diagnostic algorithm design, and
- hardware-in-the-loop (HIL) testing.
- To create and open a working copy of the hybrid electric vehicle reference application project, enter
autoblkHevStart – on MATLAB command box
By default, the HEV multimode reference application is configured with:
- Mapped motor and generator
- 5–L spark-ignition (SI) dynamic engine
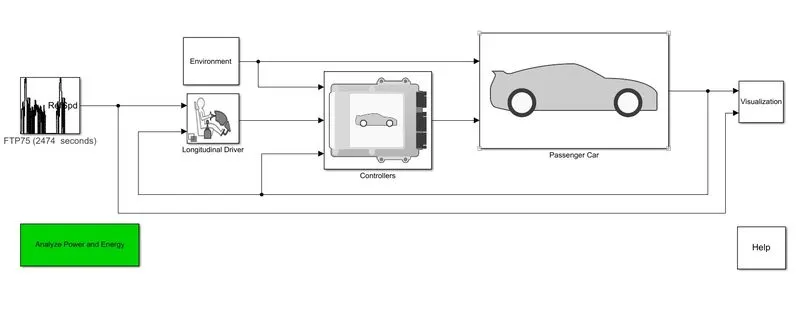
- Drive Cycle Source block — FTP75 (2474 seconds):
Generates a standard or user-specified drive cycle velocity versus time profile. Block output is the selected or specified vehicle longitudinal speed. - Environment subsystem:
Creates environment variables, including road grade, wind velocity, and atmospheric temperature and pressure. - Longitudinal Driversubsystem:
Uses the Longitudinal Driver or Open Loop variant to generate normalized acceleration and braking commands.
- Longitudinal Driver variant implements a driver model that uses vehicle target and reference velocities.
- Open Loop variant allows you to configure the acceleration, deceleration, gear, and clutch commands with constant or signal-based inputs.
- Controllers’subsystem:
Implements a powertrain control module (PCM) containing a hybrid control module (HCM) and an engine control module (ECM). - Passenger Carsubsystem: implements a hybrid passenger car that contains the engine, electric plant, and drivetrain subsystems.
- Visualization subsystem:
Displays vehicle-level performance, battery state of charge (SOC), fuel economy, and emission results that are useful for powertrain matching and component selection analysis.
To Change the model type of vehicle from mapped or dynamic Engine, Motor or Generator, we must follow these steps.
- Open the desired model of Powertrain block set in Simulink (HEV or EV)
- Double- Click on the Passenger Vehicle block to enter its subsystem
- Again Double- Click on either of the highlighted blocks to enter its subsystem depending on the Engine or Electric plant
- In the case of electric plant, right-click on any of the highlighted blocks and Goto;
Variant `rightarrow` Label Mode Active Choice `rightarrow`Mapped/Dynamic
Step 1: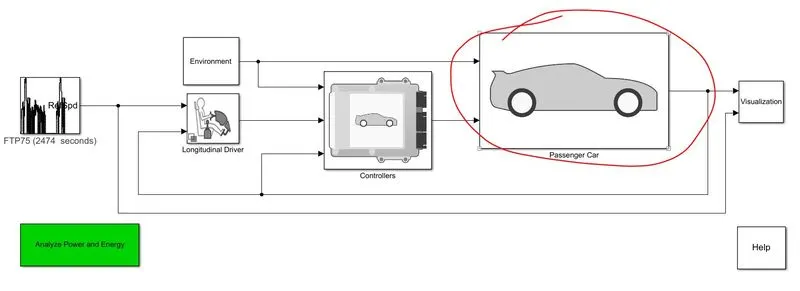
Step 2: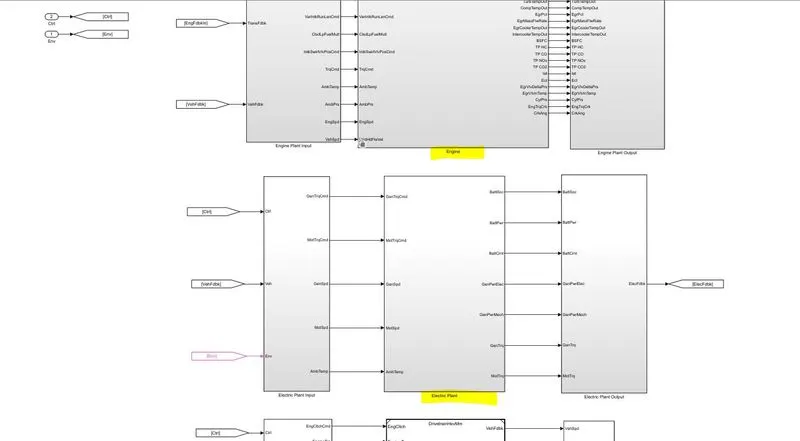
Step 3: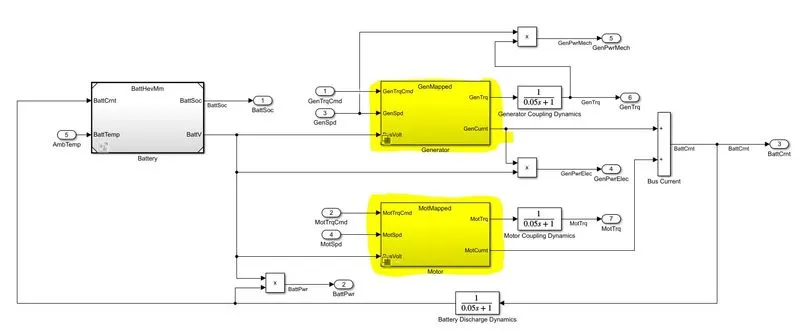
Step 4: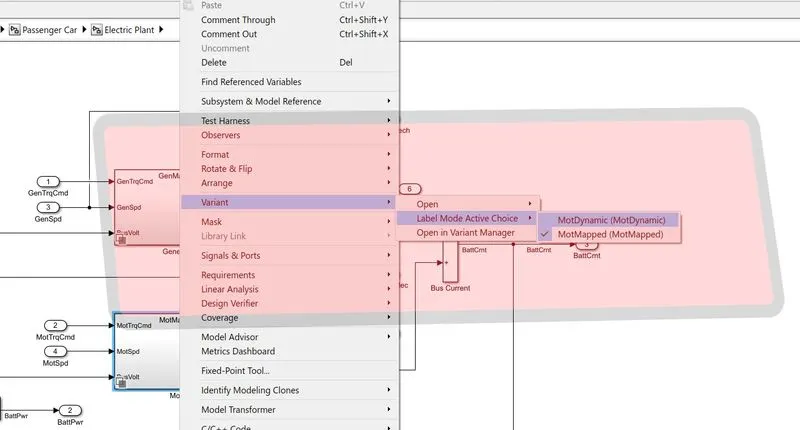
- How Does the model calculate miles per gallon? Which factors are considered to model fuel flow?
- MPG stands for miles per gallon and is used to show how far your car can travel for every gallon (or 4.55 liters) of fuel it uses.
- MPGe stands for miles per gallon of gasoline-equivalent.
- It measures the fuel efficiency of vehicles that run on non-liquid fuels, such as hybrid and electric models.
- These fuels, such as compressed natural gas and electricity, are rated in MPGe as opposed to the standard miles-per-gallon
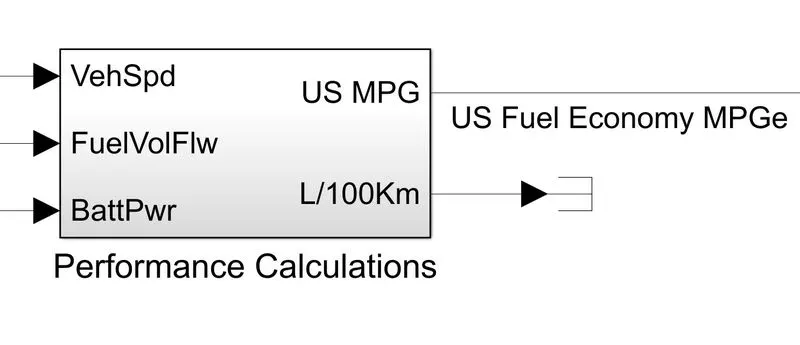
In the case of the given model of HEV Reference application, the fuel flow and economy can be represented as;
Step 1: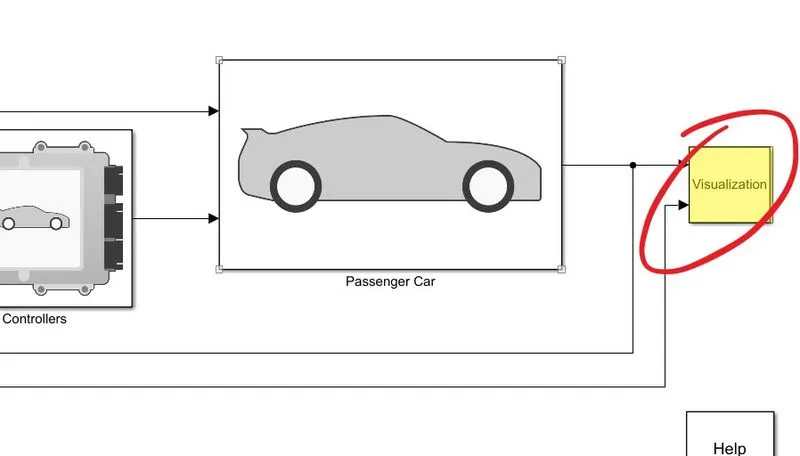
Step 2: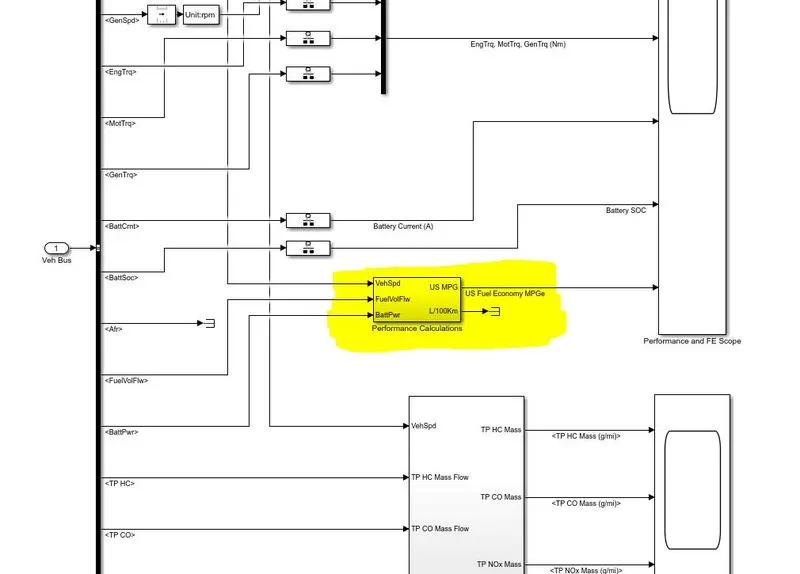
Step 3: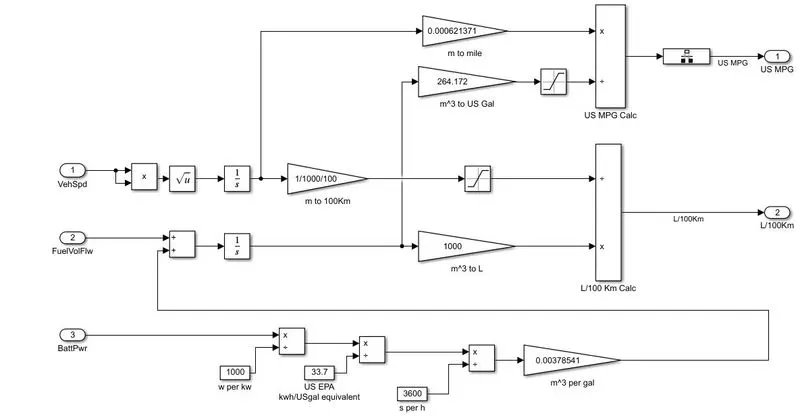
In this subsystem, three parameters are considered;
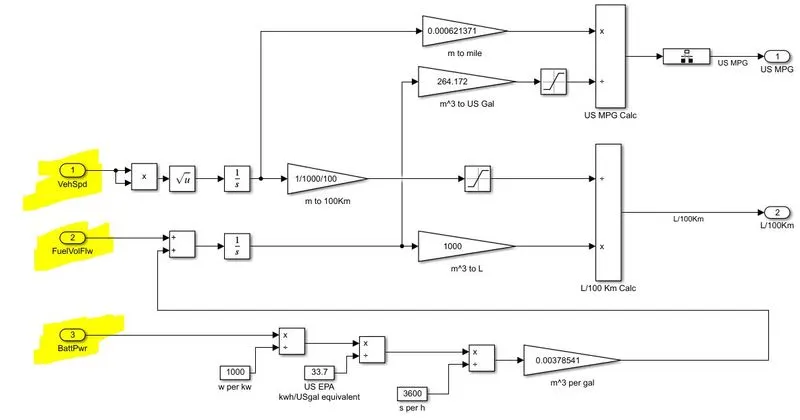
The factors considered for FUEL FLOW are;- Vehicle Speed
- Vehicle speed is the primary input for the fuel calculation
- Here, the speed in m.s-1 is converted to miles to measure the distance
- Thus, the speed is integrated with time
- Fuel Volume Flow
- The fuel flow is measured in terms of volume
- Since it is also varying with respect to time, it is integrated with time, and we could know the fuel mass
- Furthermore, to convert the fuel to liters, we multiply the mass by 1000
- At last, by taking the product of distance and fuel, we can calculate the amount of fuel consumed in liters for 100 Kms
- Battery Power
- The battery power is considered when the vehicle uses electrical energy for propulsion and the range is calculated using MPGe
- Here, the battery power given in Watts is converted to kW’s by dividing it by 1000
- To calculate the energy of battery in kWh’s, we must multiply the kW with time
- To calculate the battery range in MPGe, we must multiply the Energy with a factor of 33.7 which is termed as kWh/USgal equivalent, and divide it by 3600 to convert hours to seconds
- Finally, multiply with a factor of 0.00378541 to convert to gallons equivalent.
Calculation of Miles Per Gallons:
- To calculate MPG, two inputs are selected;
- Distance
- Fuel Mass
- From the above calculation of Vehicle speed, we can gather distance by integrating and the value in meters is converted to miles by multiplying with a factor of 0.000621371
- Similarly, the fuel in volume (m3) is converted to equivalent US Gallons by multiplying with a factor of 264.172
- These two inputs are simply divided to get the values in Miles per Gallon
3. Run the HEV Reference Application with WOT drive cycle. Change the grade and wind velocity in the environment block. Comment on the result.THEORY:
Hybrid Electric Vehicle:
Hybrid Electric Vehicles (HEVs) are powered by an internal combustion engine in combination with one or more electric motors that use energy stored in batteries
HEVs combine the benefits of high fuel economy and low tailpipe emissions with the power and range of conventional vehicles.
HEVs can be either mild or full hybrids, and full hybrids can be designed in series or parallel configurations.
- mild hybrids—also called micro hybrids—use a battery and electric motor to help power the vehicle and can allow the engine to shut off when the vehicle stops (such as at traffic lights or in stop-and-go traffic), further improving fuel economy. mild hybrid systems cannot power the vehicle using electricity alone. these vehicles generally cost less than full hybrids but provide less fuel economy benefit than full hybrids.
- full hybrids have larger batteries and more powerful electric motors, which can power the vehicle for short distances and at low speeds. these vehicles cost more than mild hybrids but provide better fuel economy benefits.
there are different ways to combine the power from the electric motor and the engine. parallel hybrids—the most common HEV design—connect the engine and the electric motor to the wheels through mechanical coupling. both the electric motor and the internal combustion engine drive the wheels directly. series hybrids, which use only the electric motor to drive the wheels, are more commonly found in plug-in hybrid electric vehicles.
Reference Application:
The Reference Applications are fully assembled models of automotive powertrains, including spark-ignition (si), compression-ignition (ci), hybrid, and electric systems.
For design trade-off analysis and component sizing, control parameter optimization, and hardware-in-the-loop (hil) testing, start with one of the vehicle reference applications.
Before integration with the vehicle model for ci or si engine and controller calibration, validation, and optimization start with one of the internal combustion engine dynamometer reference applications.
WOT Drive Cycle:
Wide-open throttle or wide-open throttle (WOT), also called full throttle, is the fully opened state of throttle on an engine (internal combustion engine or steam engine).
The term also, by extension, usually refers to the maximum-speed state of running the engine, as the normal result of a fully opened throttle plate/butterfly valve. In an internal combustion engine, this state entails the maximum intake of air and fuel that occurs when the throttle plates inside the carburetor or throttle body are "wide open" (fully opened), providing the least resistance to the incoming air.
In the case of an automobile, WOT is when the accelerator is depressed fully, sometimes referred to as "flooring it" (because automotive throttle controls are usually a pedal, so the full throttle is selected by pressing the pedal to the floor, or as near as it will go).
HEV Reference Application
Default Settings: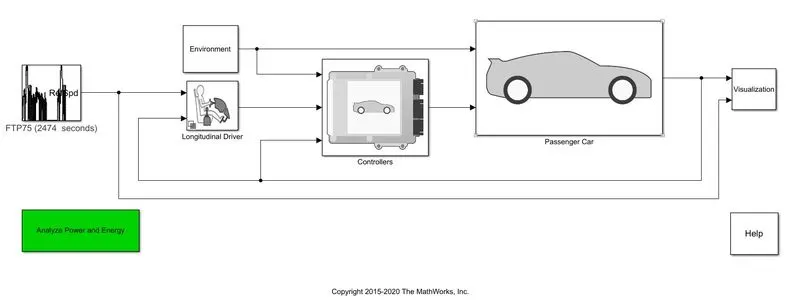
- Drive Cycle Source block — FTP75 (2474 seconds): Generates a standard or user-specified drive cycle velocity versus time profile. Block output is the selected or specified vehicle longitudinal speed.
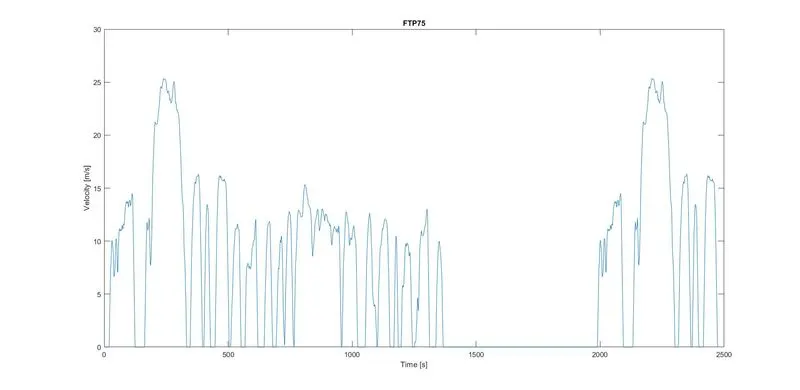
- Environment subsystem: Creates environment variables, including road grade, wind velocity, and atmospheric temperature and pressure.
- Longitudinal Driversubsystem: Uses the Longitudinal Driver or Open Loop variant to generate normalized acceleration and braking commands.
- Longitudinal Driver variant implements a driver model that uses vehicle target and reference velocities.
- Open Loop variant allows you to configure the acceleration, deceleration, gear, and clutch commands with constant or signal-based inputs.
- Controllers’subsystem: Implements a powertrain control module (PCM) containing a hybrid control module (HCM) and an engine control module (ECM).
- Passenger Carsubsystem: implements a hybrid passenger car that contains the engine, electric plant, and drivetrain subsystems.
- Visualizationsubsystem: Displays vehicle-level performance, battery state of charge (SOC), fuel economy, and emission results that are useful for powertrain matching and component selection analysis.
RESULT: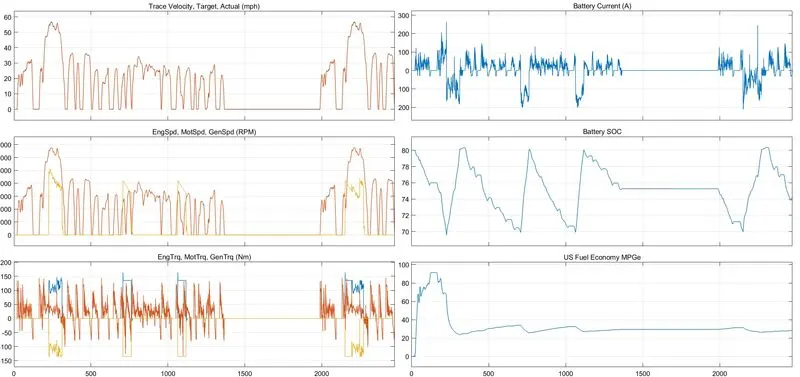
WOT Data Cycle
Case 1:
Simulation Time = 60 sec
Initial speed = 0 m.s-1
Maximum Speed = 50 m.s-1
Time to start deceleration = 40 sec
Final Speed = 0 m.s-1
Rest of the model parameters are kept the same
HEV Reference Model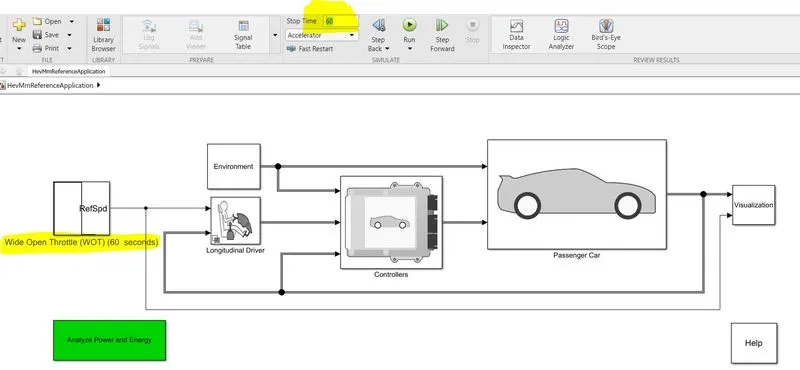
WOT Condition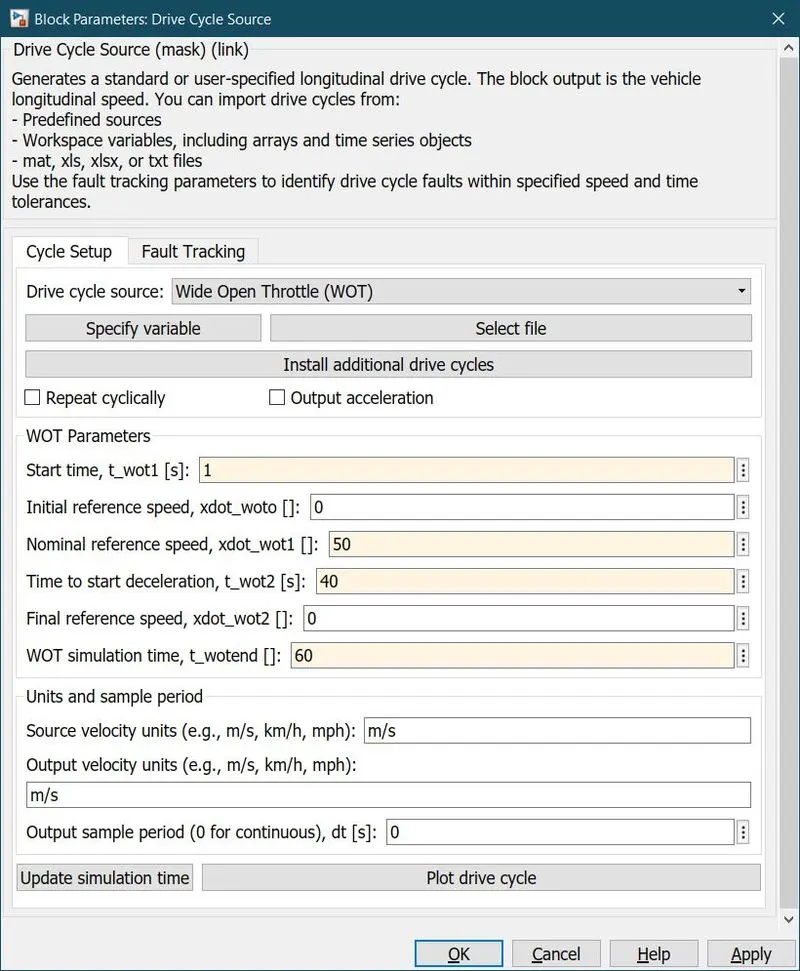
Environment Conditions: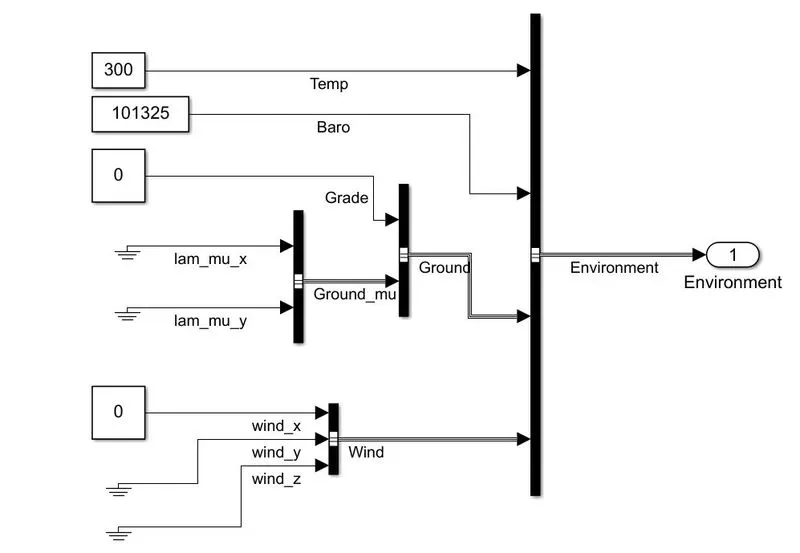
RESULT: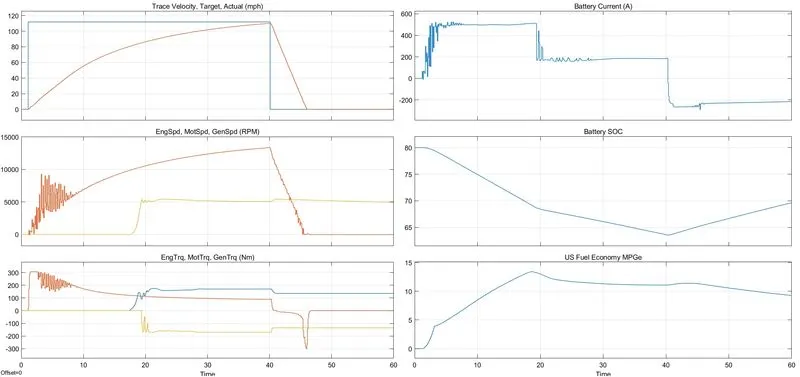
OBSERVATION:
- Trace Velocity, Target, and Actual: For any trace velocity higher than 110 mph, the maximum velocity that can be attained is 110 mph, which is the actual velocity. During deceleration, the total time taken is 4 secs
- Battery Current: Here, during the Wide opening, a huge amount of battery current is drawn from the battery of about 500 A for the first 20 secs and after that, only 200 A range is drawn from the battery. During deceleration, Battery is charged using the 200 A range due to regeneration from the generator. It is evident that the Discharging current rate is much higher compared to the charging current. Thus, we can depict that the maximum current that can be drained or the maximum discharging is around 500 A, and the maximum charging current is around 200 A
- Engine, Motor, and Generator Speed: This plot represents the Engine, Motor, and Generator speed corresponding to the velocity acquired at the given point of time.
- Battery SOC: Here the battery SOC deteriorates or drains rapidly due to the high current demand of motor for instant torque. The SOC falls to around 65 % from 80 %. And later during deceleration, the SOC slightly increases during regeneration around 5%.
- Engine, Motor, and Generator Torque: This plot represents the Engine, Motor, and Generator torque corresponding to the velocity acquired at the given point of time.
- US Fuel Economy, MPGe: This represents maximum fuel economy in MPGe at a given point in time
-----------------------------------------------------------------------------------------------------------------------------
WOT Data Cycle
Case 2:
Simulation Time = 60 sec
Initial speed = 0 m.s-1
Maximum Speed = 50 m.s-1
Time to start deceleration = 40 sec
Final Speed = 0 m.s-1
Grade angle = 50
Wind Velocity = 5 m.s-1
Rest of the model parameters are kept same
HEV REFERENCE MODEL
WOT CONDITIONS:
ENVIRONMENT CONDITIONS: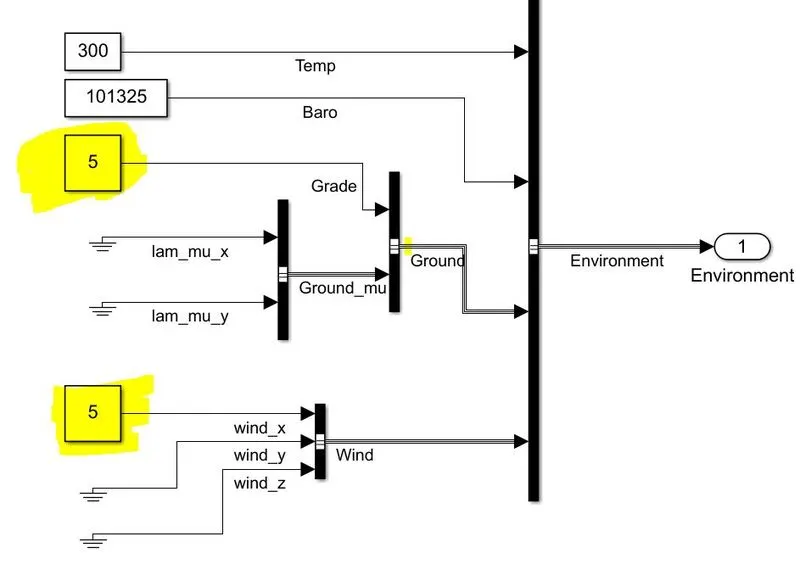
RESULT: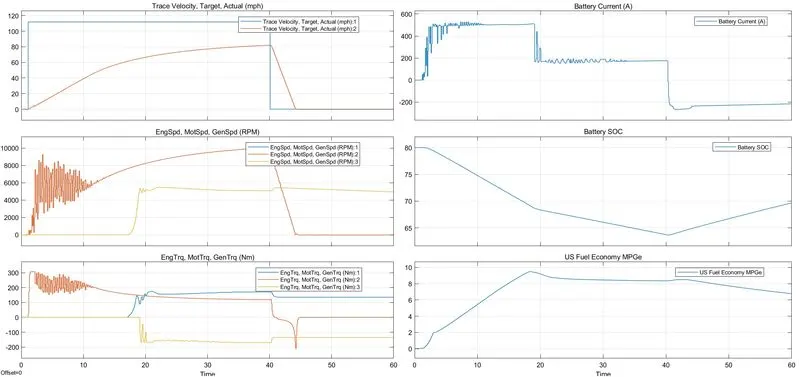
OBSERVATIONS:
- Trace Velocity, Target, and Actual: Here, since there are external environmental parameters like Gradient and Wind Speed are included, vehicle performance is drastically affected. The maximum velocity attained is 82 mph, which is the actual velocity. During deceleration, the total time taken is 7 secs
- Battery Current: Here also, during the Wide opening, a huge amount of battery current is drawn from the battery of about 500 A for the first 20 secs and after that, only 200 A range is drawn from the battery. During deceleration, Battery is charged using the 200 A range due to regeneration from the generator. It is evident that the Discharging current rate is much higher compared to the charging current. Thus, we can depict that the maximum current that can be drained or the maximum discharging is around 500 A, and the maximum charging current is around 200 A
- Engine, Motor, and Generator Speed: This plot represents the Engine, Motor, and Generator speed corresponding to the velocity acquired at the given point of time.
- Battery SOC: Here the battery SOC deteriorates or drains rapidly due to the high current demand of motor for instant torque. The SOC falls to around 65 % from 80 %. And later during deceleration, the SOC slightly increases during regeneration around 5%.
- Engine, Motor, and Generator Torque: This plot represents the Engine, Motor, and Generator torque corresponding to the velocity acquired at the given point of time.
- US Fuel Economy, MPGe: This represents maximum fuel economy in MPGe at a given point of time.
4. Keeping all other parameters the same, compare the simulated results of hybrid and pure electric powertrains.
Comparison between HEV and EV Reference models
- HEV Reference Model
WOT Data Cycle
Simulation Time = 60 sec
Initial speed = 0 m.s-1
Maximum Speed = 50 m.s-1
Time to start deceleration = 40 sec
Final Speed = 0 m.s-1
Rest of the model parameters are kept same
WOT CONDITIONS:
ENVIRONMENT CONDITIONS
- EV Reference Model
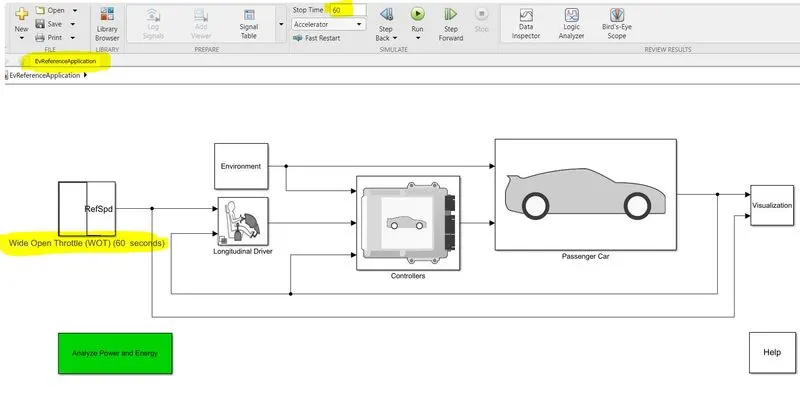
-
WOT Data Cycle
Simulation Time = 60 sec
Initial speed = 0 m.s-1
Maximum Speed = 50 m.s-1
Time to start deceleration = 40 sec
Final Speed = 0 m.s-1
Rest of the model parameters are kept same
WOT CONDITIONS:
ENVIRONMENT CONDITIONS
RESULTS:
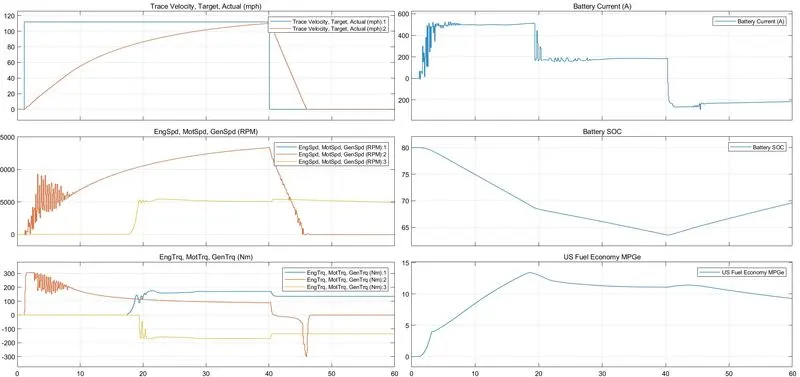
- HEV Reference Model
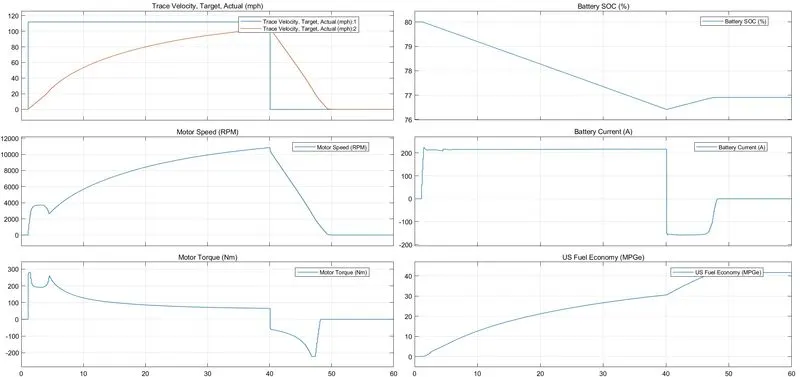
- EV Reference Model
COMPARISON:
| Parameters | HEV RefModel | EV RefModel |
| WOT Conditions | ||
| Initial Ref Speed (m/s) | 0 | |
| Nominal Ref Speed (m/s) | 50 | |
| Time to start Deceleration (s) | 40 | |
| Final Reference Speed (m/s) | 0 | |
| WOT Simulation time (s) | 60 | |
| Environment Conditions | ||
| Gradient angle | 0 | |
| Wind Velocity | 0 | |
| All the remaining parameters are kept unchanged | ||
| Actual Speed (mph) | 110 | 103.4 |
| Acceleration time (s) | 39 | 40 |
| Deceleration time (s) | 6 | 9 |
| Total Battery SOC (initial) | 80 | 80 |
| Total Battery SOC (final) | 69.66 | 76.9 |
| Battery SOC after full acceleration | 63.5 | 76.4 |
| change in Battery SOC during Regeneration | 6.16 | 0.50 |
| Motor RPM @Final Speed | 13300 | 10810 |
| Initial Battery Current during Acceleration (A) | 520 | 223.5 |
| Battery Current during Deceleration (A) | -260 | -158 |
| Motor Torque during Initial pickup (N/m) | 300 | 280 |
| Fuel Economy during Acceleration (MPGe) | 11 | 31 |
| Final Fuel Economy (MPGe) | 9 | 41.7 |
CONCLUSION:
- For the same conditions, HEV performs better in terms of Top speed.
- The Speed reached by HEV is higher than EV
- The time taken for acceleration is lesser for HEV compared to EV
- Even the deceleration time for HEV is lesser than EV
- For the same conditions, the battery performance of EV is much better than HEV.
- Even for the same SOC levels, the efficiency of EV is much higher compared to HEV
- Energy recovered through regenerative braking is huge in EV compared to HEV
- For the same conditions, the motor must run at higher RPMs for HEV compared motor only EVs
- For the same conditions, the current drawn from the battery by the motor is much higher for HEV compared motor only EVs
- The torque performance is almost identical for both HEV and EVs
- The overall fuel economy in MPGe is much higher in EVs since it doesn’t require any fuelling compared HEVs