Week-3 Challenge: ADVISOR Tool
Solution :
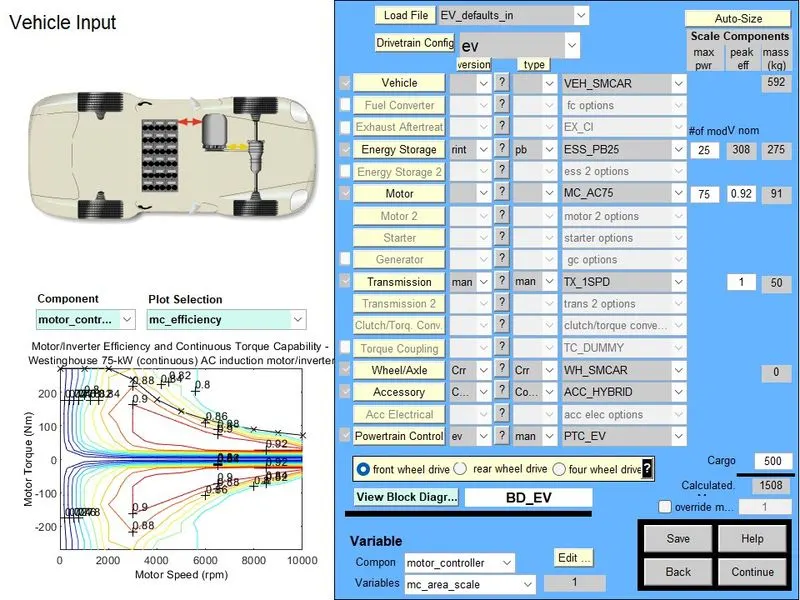
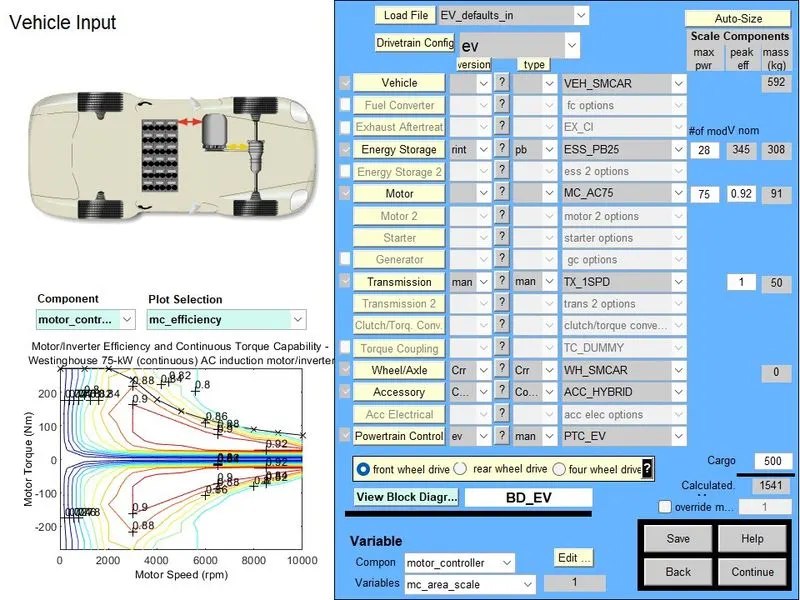
Q1) Here EV_defaults_in file is selected in ADVISOR Tool as shown in below figure also considered 500 kg mass of cargo and further simulations are made in order to observe the outputs.
Schematic window of ADVISOR tool -
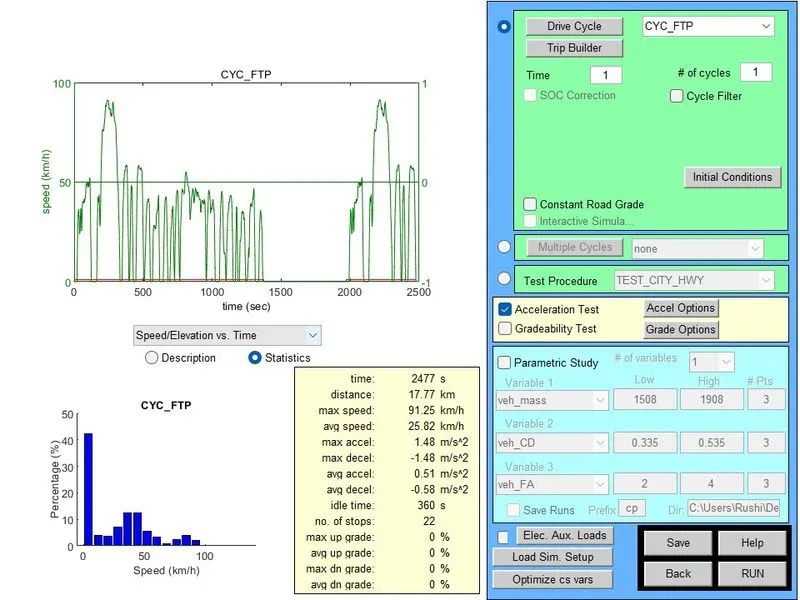
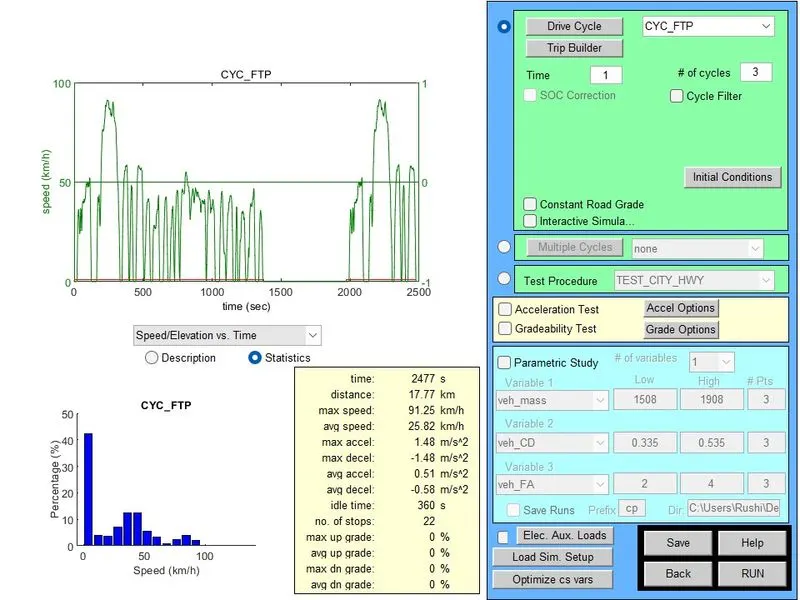
CASE 1 - Selection of drive cycle Federal Test Procedure (FTP) as instructed and selected one no. of cycle ,
Output of above selected configuration -
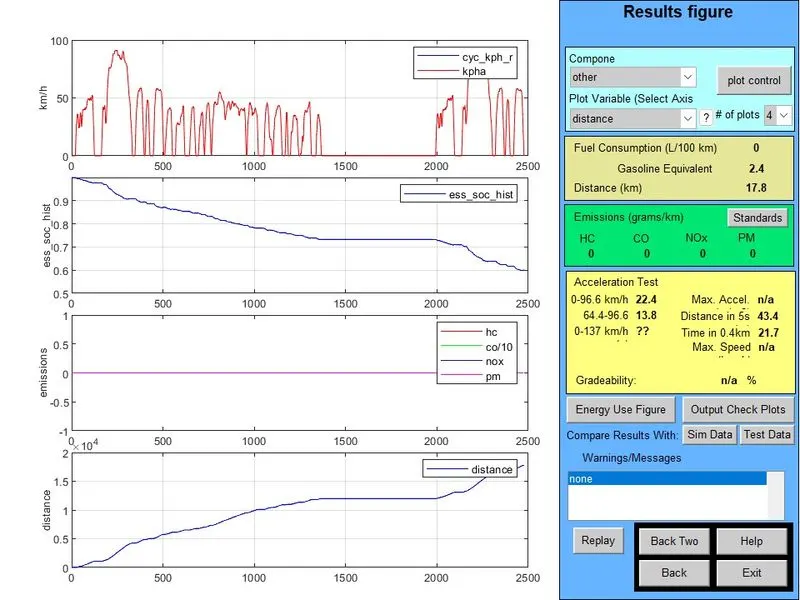
CASE 2 - Selected TWO no. of cycles for Federal Test Procedure (FTP)
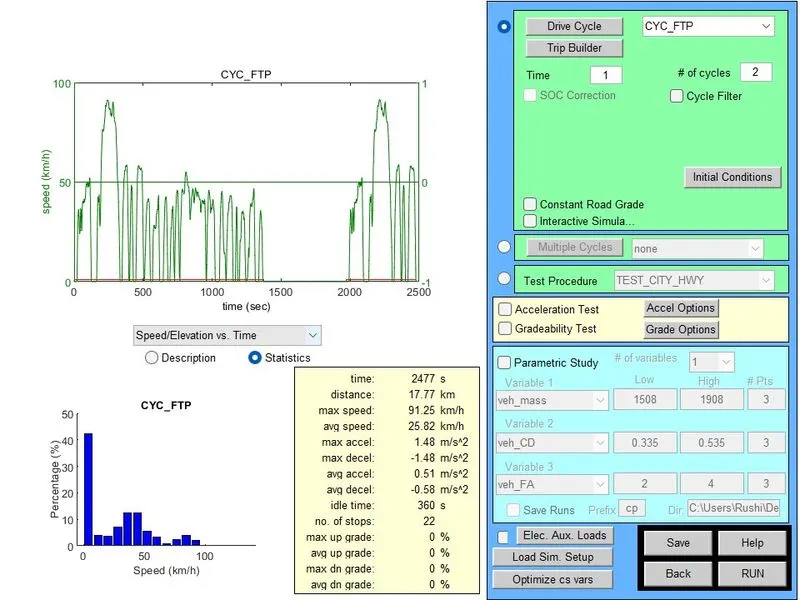
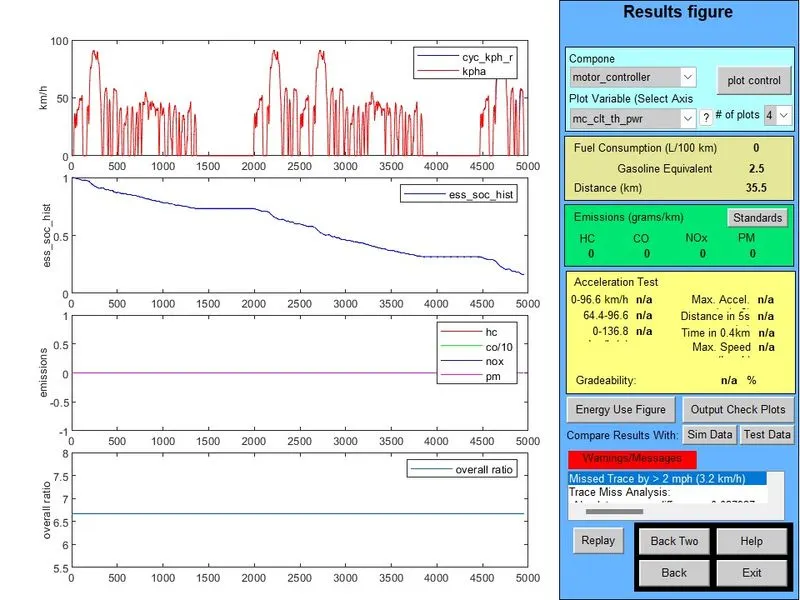
Output of above selected configuration -
CASE 3 - Selected THREE no. of cycles for Federal Test Procedure (FTP) & Output is provided below
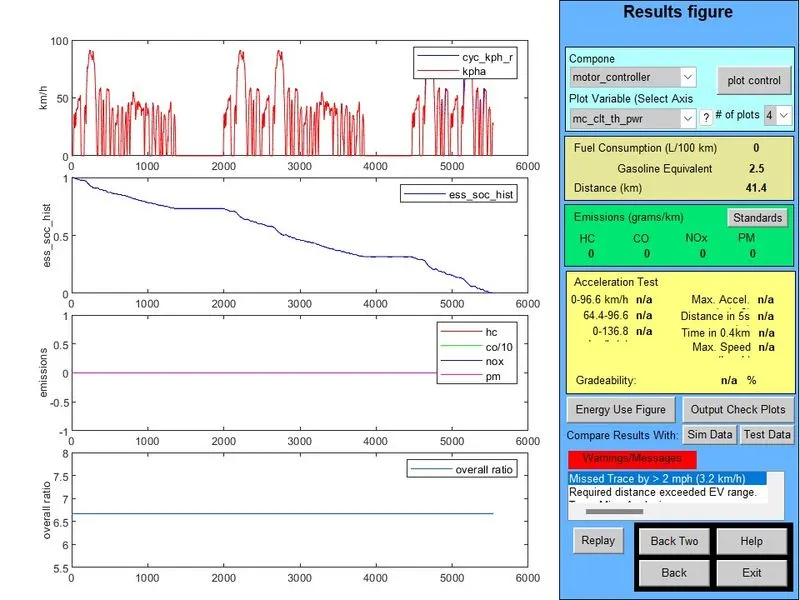
Observations : From above practice its been observed that as per the setting instructed this EV_default drivetrain/ vehicle is run initially for 01 drive cycle but batter SOC state not 100% discharge and distance found to be 17.8 Km. Then in next phase no. of cycle consider 02 and distance covered is 35.5 kms & remaining battery SOC is nearly around 20-22%. Similerly same process is repeated with 03 no of cycles and its finally observed that distance covered is 41.4 kms with SOC 0% remaining. Hence conclusion is that vehicle unable to cover the 45Kms distance with 500kg mass of cargo.
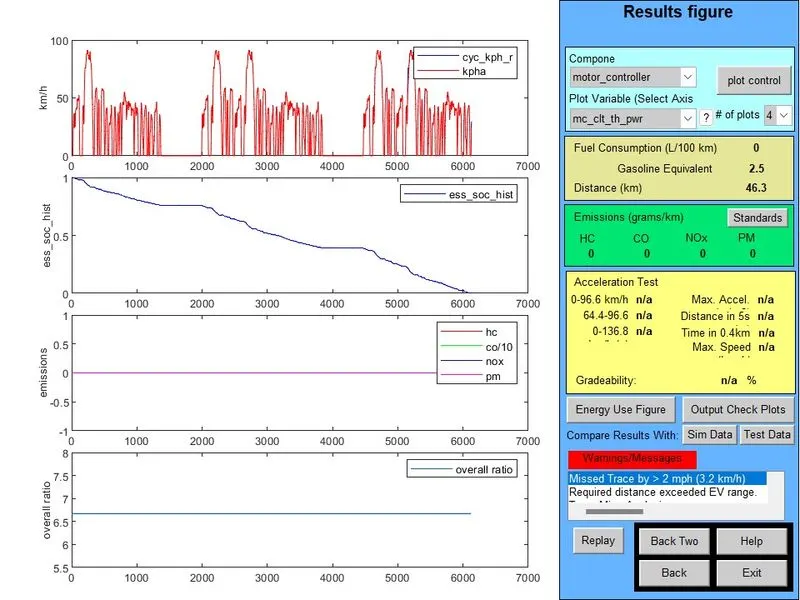
Q2) Changing the battery capacity to a specific level @ 28 battery packs to achive the objective of covering the 45kms distance. Here all other parameters are kept same and updates are made to battery only.
Drive cylce parameter window -
Output details of battery pack with 28 Nos -
Output of battery pack with 33 Nos -
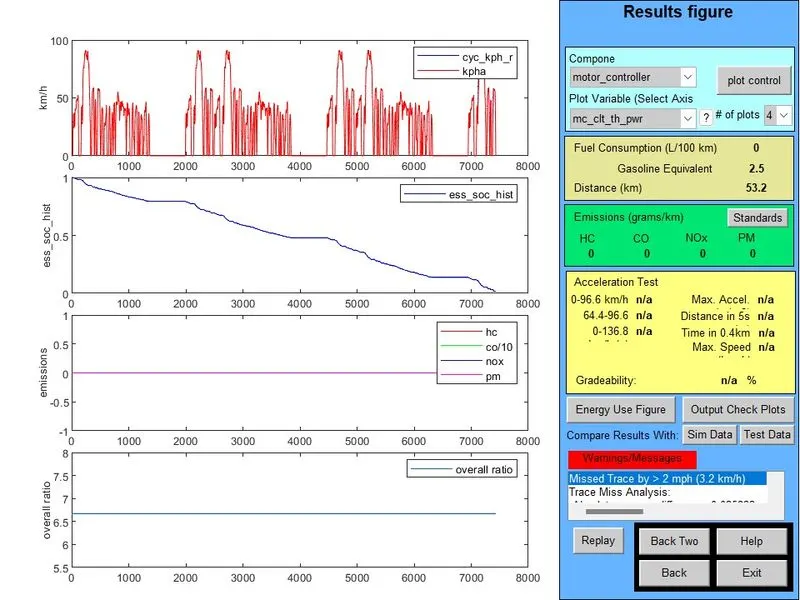
Conclusion :- Here battery capacity is change such that 45 kms distance should be covered by vehicle easily. In first case battery back selected 28 and as simulation is run observations are found that vehicle covered 45 kms distance but it was out of batter range or SOC ( from graph) however to overcome this challenge battery pack size is changed to 33 nos and final output is found to be as per our requirement like 45 km distance is covered within batter range or charge ( SOC).
Q3) Gradeability test with PRIUS_Jpn_defaults_in file is performed and followed the below steps to find the gradeability effect on vehicle.
a. Selected the PRIUS model in ADVISOR Tool by keep all the parameter default.
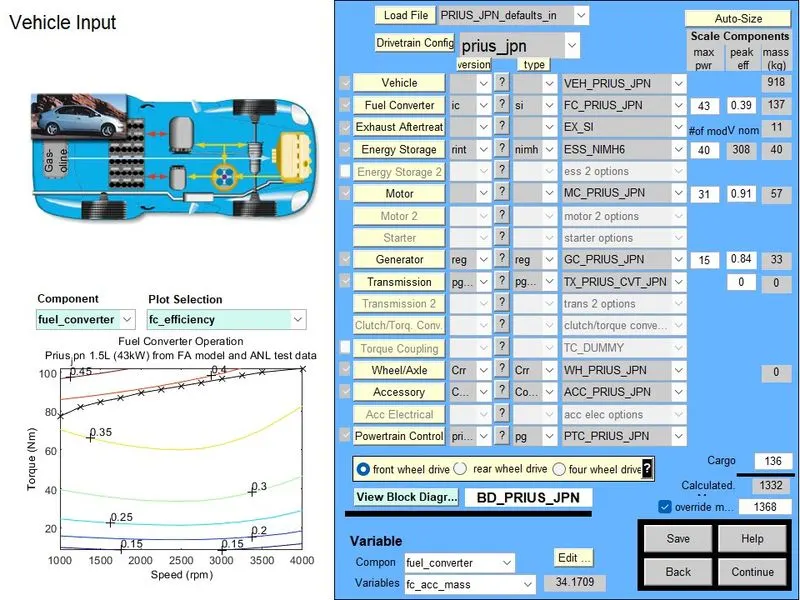
b. Here UDDS Drive cycle is selected which is prefered by ADVISOR loaded model already.
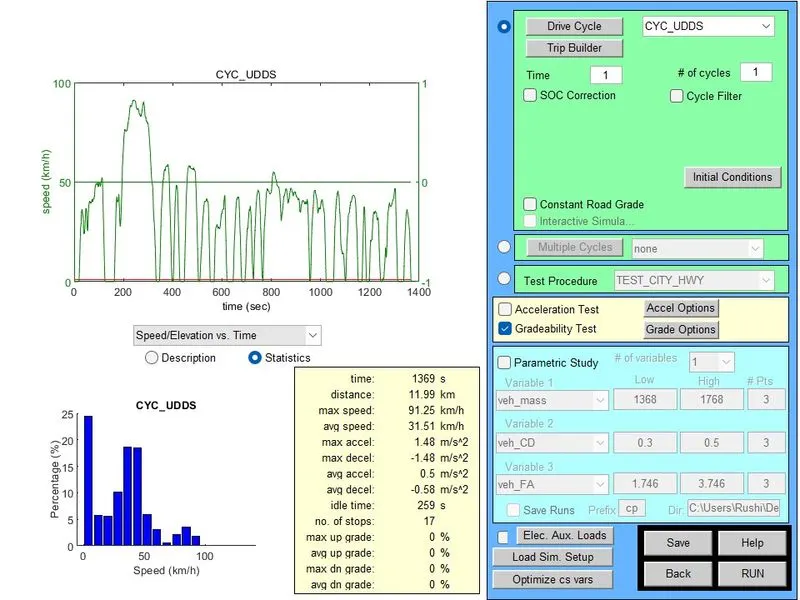
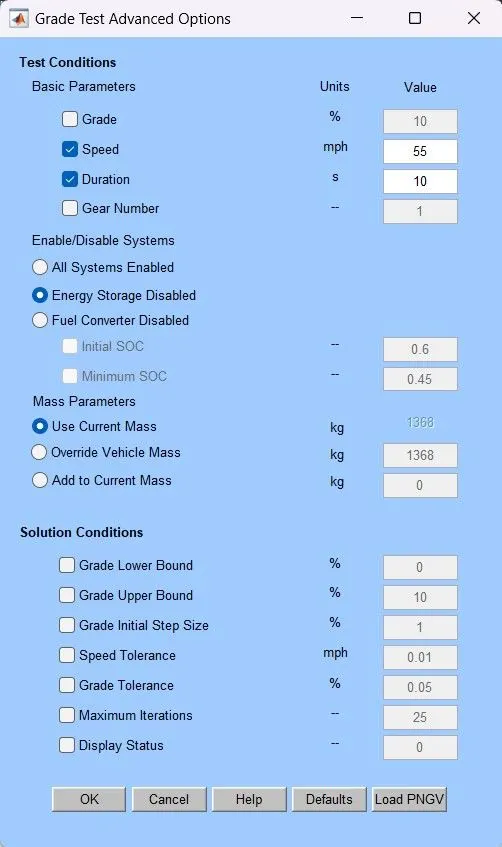
c. In above window selcted the Gradeability option to perform the tests as shown in above fig. Along with this we have taken the speed of vehicle as 55 mph to check the gradeability of this PRIUS model all details are mentioned / shown in below picture.
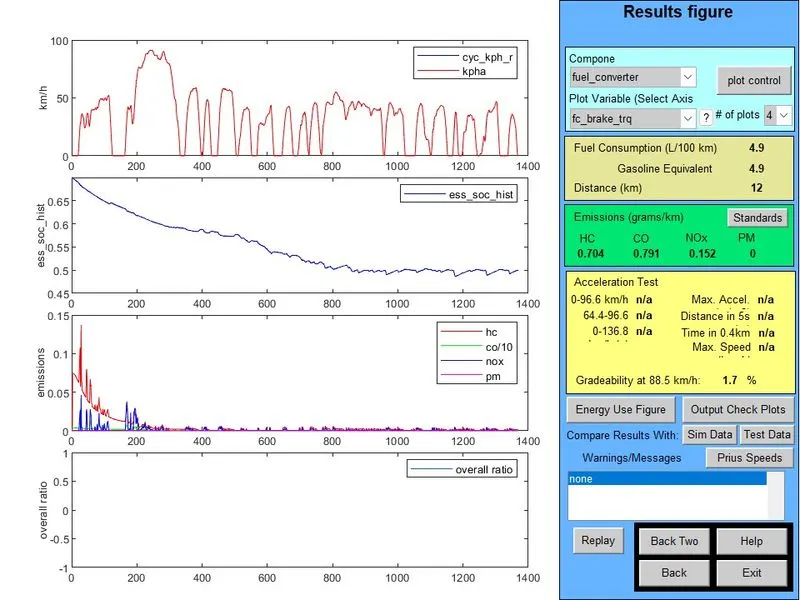
d. After running the tool for these parameters we have got the output shown below. For the 55 mph speed gradeability found to be 1.7%.
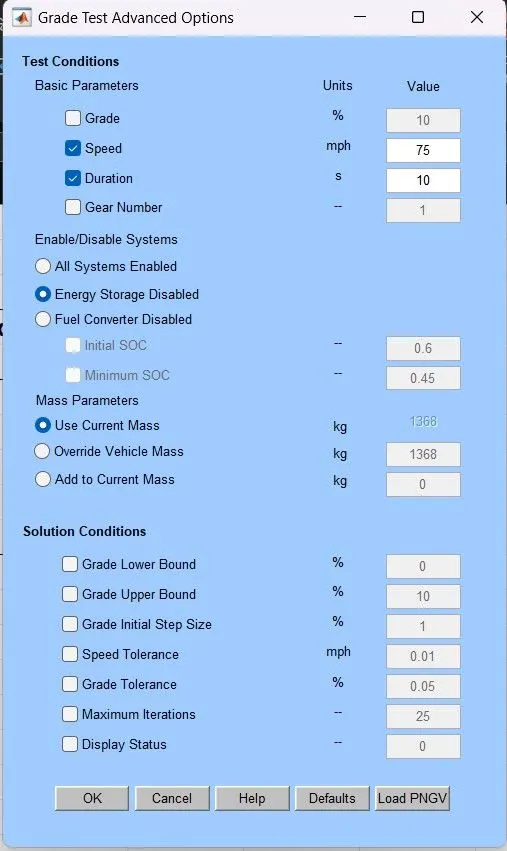
e. Similarly now speed is going to be increase stepwise now here new speed considered is 75mph as shown below .
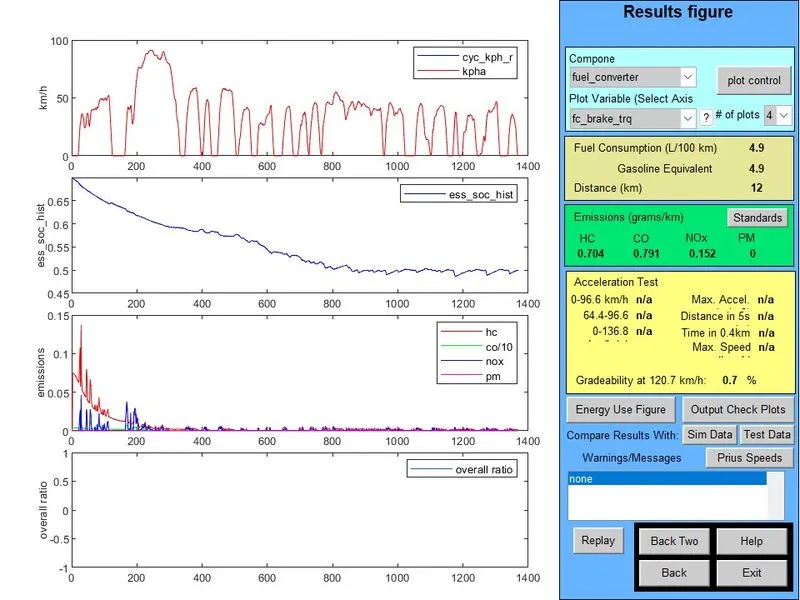
f. For above parameter of speed the tool is simulated and observed the below results. For 75 mph gradeability iis found 0.7%
g. Similarly as privious steps speed is considered is 80 mph as shown below .
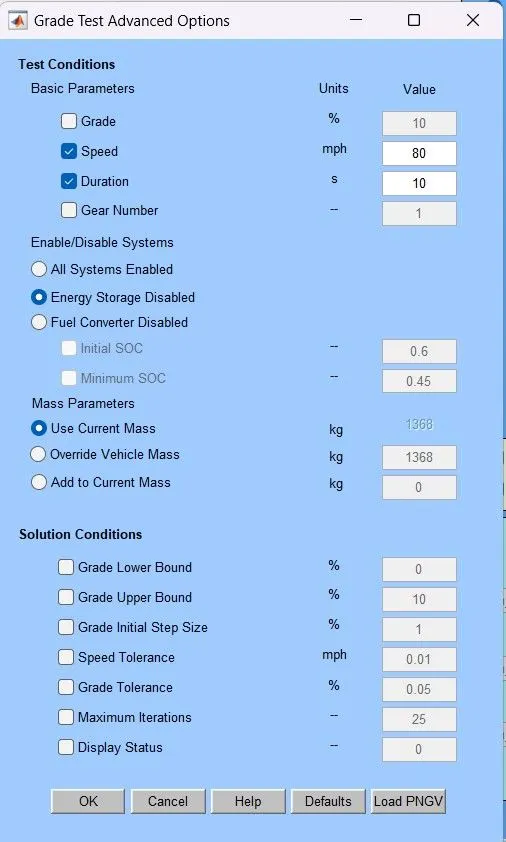
h. For above parameter of speed the tool is simulated and observed the below results. For 80 mph gradeability iis found 0.3 %
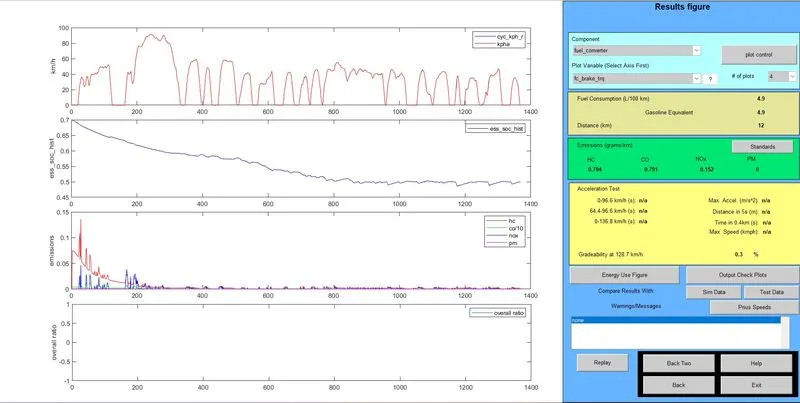
Conclusion : From all above trials related to gradeability and speed, it is observed that as we increase the speed of vehicle gradeability decreases or vice-versa. Eventhough after specific speed gradeabiltiy started getting unavailable which is it is reached its maximium limit. For example as we started increasing speed above 80 mph its value not visible in simulation ouput windows and the same details in mentioned below in tabular form from which this conclusion is drawn or stated.
| Sr No | Speed (mph) | Gradeability (%) |
| 1 | 55 | 1.7 |
| 2 | 75 | 0.7 |
| 3 | 80 | 0.3 |
| 4 | 95 | NA |