Week-4 Challenge WOT Condition Part-2
Solution :-
Q1) Difference between mapped and dynamic model of engine, motor and generator :-
a. Mapped Model : In simple words Mapped models are preloaded data provided in lookup table format. this works as per the input data provided in specific format which is map. The Mapped motor block is shown in below figure which takes input from bus voltage motor speed & torque command also giving output in form of information ,battery current & motor torque.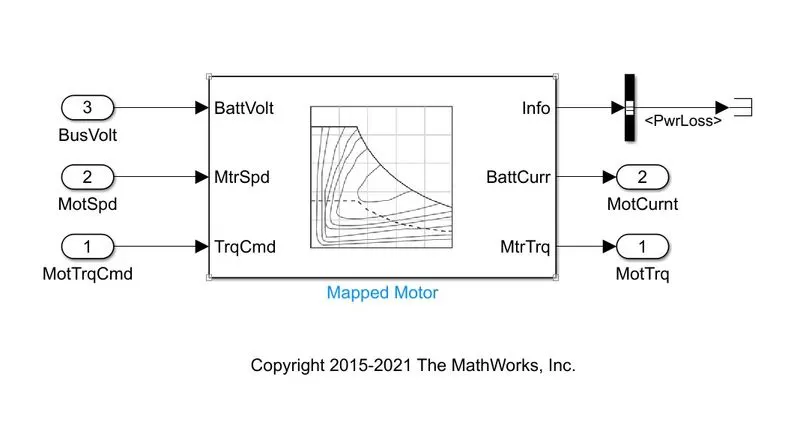
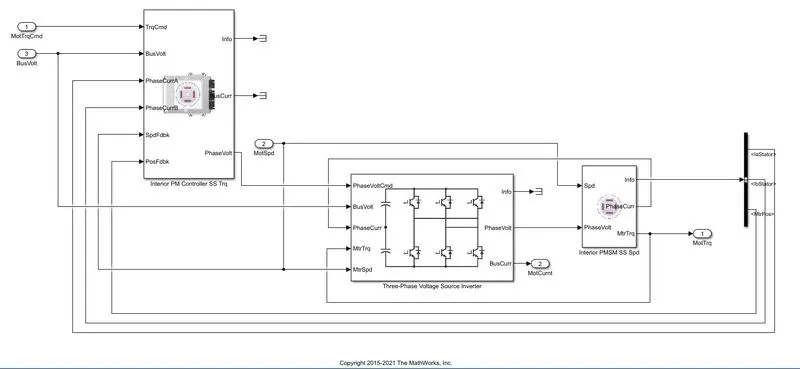
b. Dynamic Model : Dynamic model can be referred to actual input data or components received from longitudinal driver or actual driver. The dynamic block is shown in below fig from which it can be studied as it comprises of interior permanant magnet controller block , three phase voltage source inverter , interior permanant magnet synchronous motor controller block. The inputs taken by this block are motor torque, bus voltage for controlling the respective integrated block.
C. Steps to change to model types into one another :-
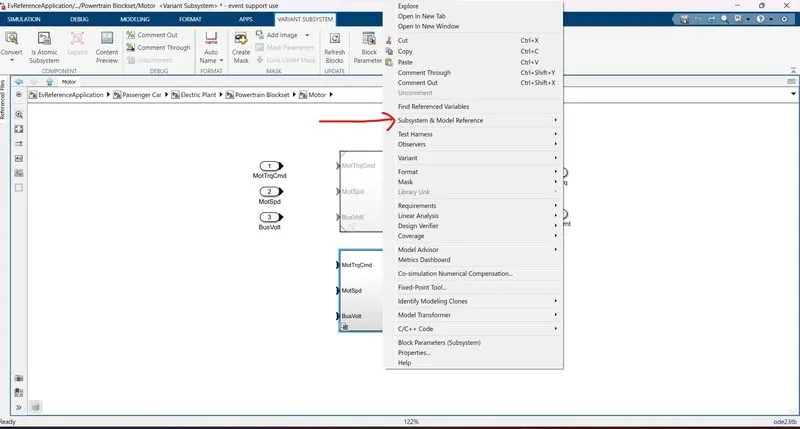
Step1 - Please right click on any of model block as shown. Then click on subsytem & model reference option.
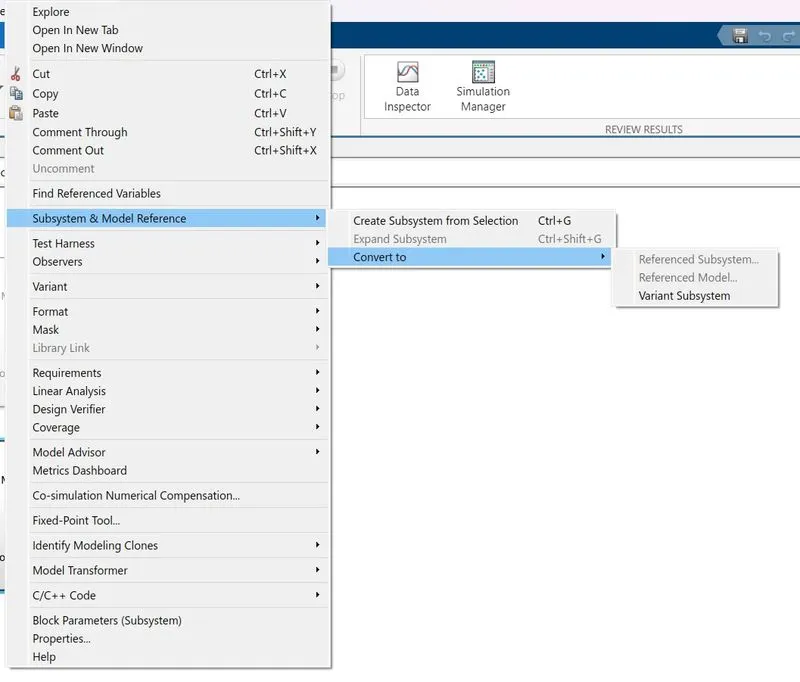
Step2- Then click on convert to and then select Variant Subsystem as shown below.
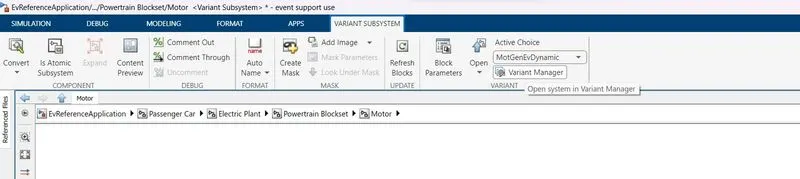
Step3- In main menu tab of MATLAB there will be Variant subsystem tab so please click on it and then opt to variant manager.
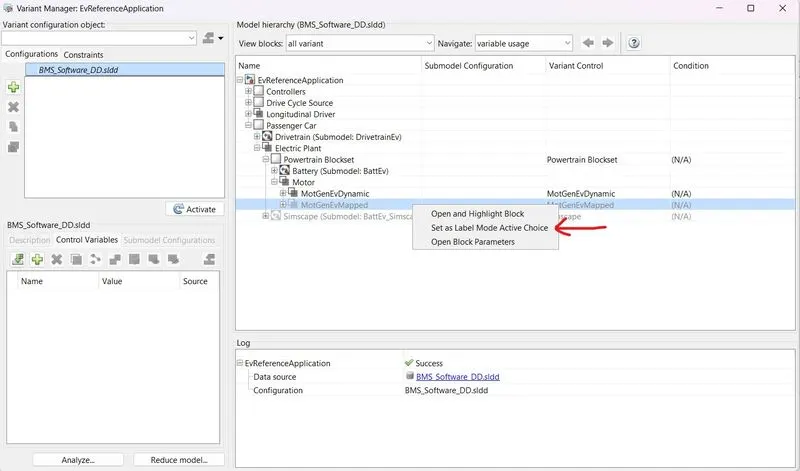
Step4- After slecting variant manager below popup box will be opned so check the mapped option or dynamic option and accordingly right click on the mode in which you want to open the block. As soon as you selected the required option close the window and you can see task completed in main model window.
Q2) Models Miles per Gallon Terminology (efficiency/economy):-
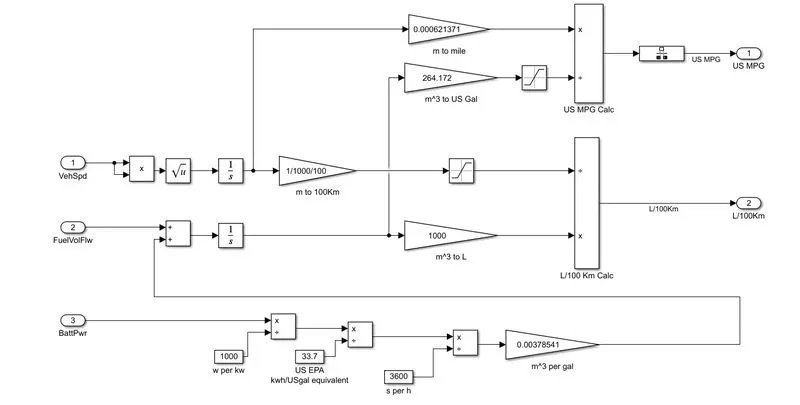
From above fig. we can observe that out miles per gallon calculations are done inside the visualization block. It takes vehicle speed , fuel flow & batter power as inputs and follow the internal calculation logic. vehicle speed is multiplied twice , taken underroot and integrated then fed back to convert it from meter to mile & meter to 100km and then to US mpg. batter power is multiplied by different factors such as w per kw, US EPA & sec per hrs and then finally added to fuel vol flow as shown. after total calculations two outputs are obtained and US MPG & L/100km.
Fuel Flow & Factors considered :
To evaluate the fuel flow following formula is considered,
`Qfuel =(Mfuel)/(((1000kg)/m^3)*Sgfuel`
Parameters are -
- Mfuel = fuel mass flow
- Sgfuel = specific gravity of fuel
- Qfuel = volumetric fuel flow
So these above factors are considered while modeling fuel flow inside SI engine block.
Q3) HEV Reference Application with WOT drive cycle :-
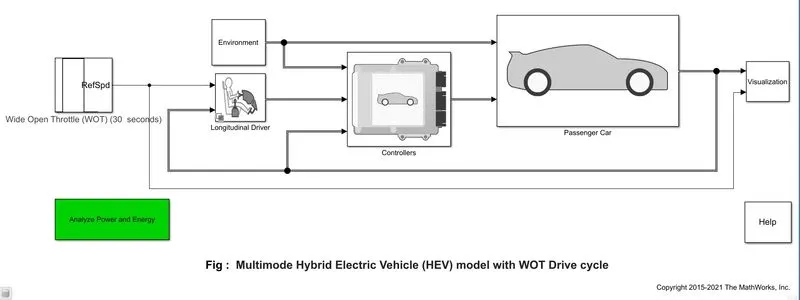
In this question we have taken the preconfigured model of HEV- Multimode from MATLAB help section. Under Powetrain blockset section we have chose HEV model and made the changes in order to achive the output for Wide Open Throttle (WOT) drive cycle or condition. Please refer to below details,
HEV Matlab model -
Changing the values of Gradeability and wind velocity in envoironment block to 10 & 15 respectively, Below pictures show the the same details.
Now setting the drive cycle to WOT and retaining the default condition of WOT,
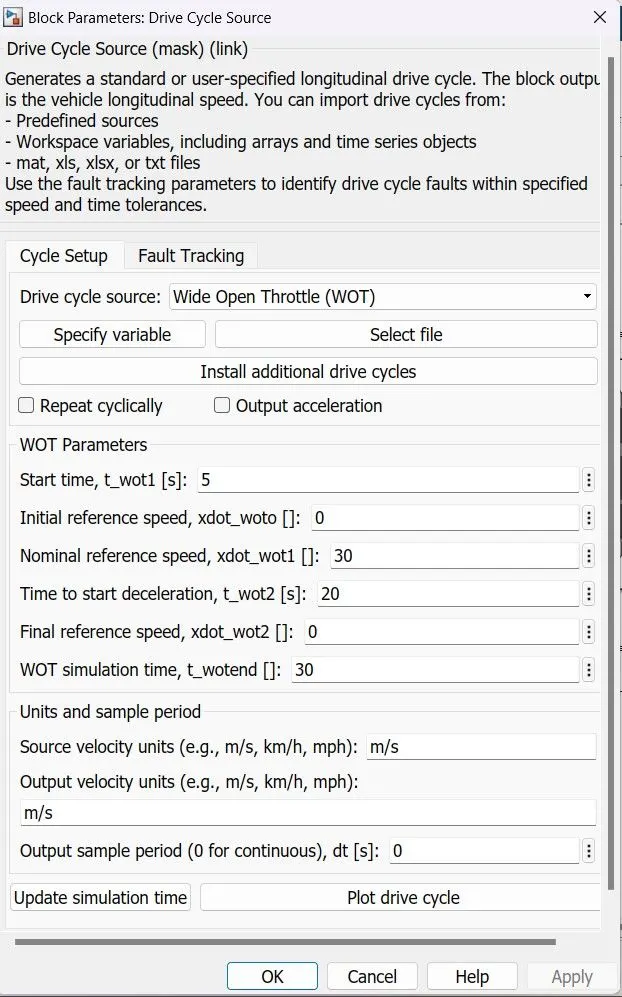
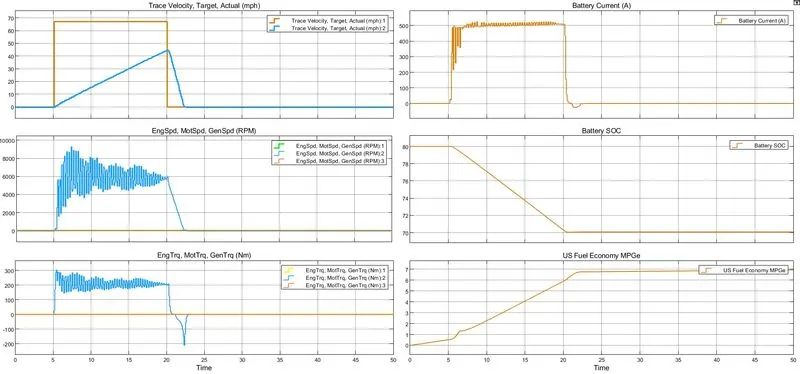
After setting up the values for the WOT drive cycles, Gradeability & Wind velocity and simulated the model. Output of the scope is provided below,
Q4) Pure EV Reference Application with WOT drive cycle :-
In this case all parameters are kept same as above case and simulated the pure electric model built in powertrain blockset. Details are provided below related to EV case,
HEV Matlab model -
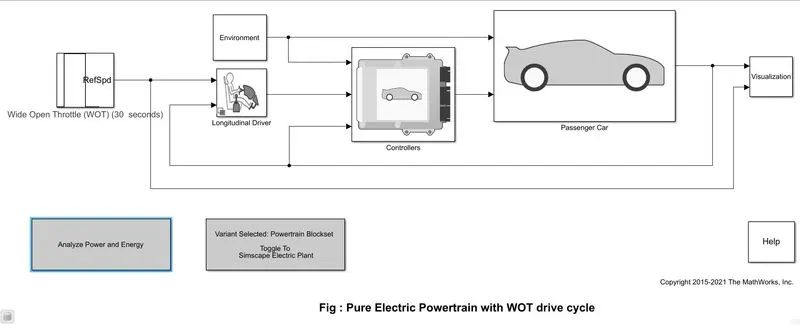
Here considering the same parameters of Drive cycle, Gradeability & Wind Velocity, all details are represented in below mention pictures,
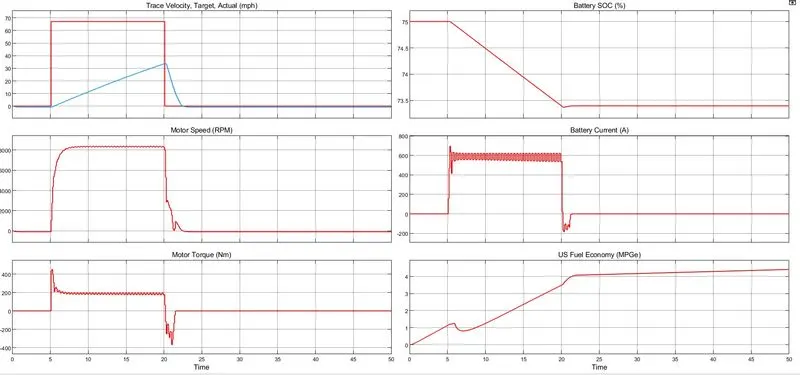
Thus after putting all the values the pure electric vehicle drivetrain model is simulated and output is obtained which is provided below,
Observation / Conclusion : From the outputs of the both cases, HEV & EV, consclusion can be drawn as below -
In HEV output, the input WOT drive cycle is observed in step format which is around 67 mph similarly the achieved acceleration or speed by the vehicle is unable to reach the input WOT acceleration. This is due to following terms-
- Gradeability & Wind velocity ,as there both terms are considered while simulation of HEV drivetrain it affected the performance at peak power requested by driver input. So that is why the targed speed / acceleration unable to reach the 67 mph.
- Battery capacity, it might be possible that the requested peak power as per drive cycle was not achived due to less battery capacity or motor capacity. As battery current was limited to around 500 A if it was above the range then vehicle would have been achived more acceleration / speed.
Fuel economy observed was around 6.9 - 7 MPGe for these performed task & battery SOC was reduced by 10% from 80% to 70 %.
However, for pure electric vehicle the observations was achieved slighly different than HEV which are mentioned below -
- The achieved speed is around 33 mph which is less than the HEV (67mph) in the case of same grade & wind velocity. Due to both parameters achieveable speed is affected due to less motor or battery capacity and limited battery current to 600 amps.
- Battery SOC % was reduced by nearly 1.5% from 75 to 73.5 % that means its required less battery than the HEV. Also fuel economy observed slighly less than HEV.
Hence, finally we can draw our conclusion on WOT case for both of these vehicles like HEV is able to achive the maximum request speed / acceleration (power) than the pure electric vehicle due to availibility of auxilary power source ( Engine/generator) which is not available in pure electric. So if we want a performance as HEV in pure electric vehicle then one must consider to increase motor or battery(current) capacity match the requirement.