Week -2
Question 1:
Objective: 1) To Create a Simulink model of Doorbell using Solenoid block, where the bell will produce sound when the metal of the Solenoid get energised from a battery through a switch.
2) To Observe and analyze the output waveform of the plunger movement of the Solenoid w.r.to the input excitation given to a switch so that the entire circuit operates for 2 seconds.
Simulink Model:
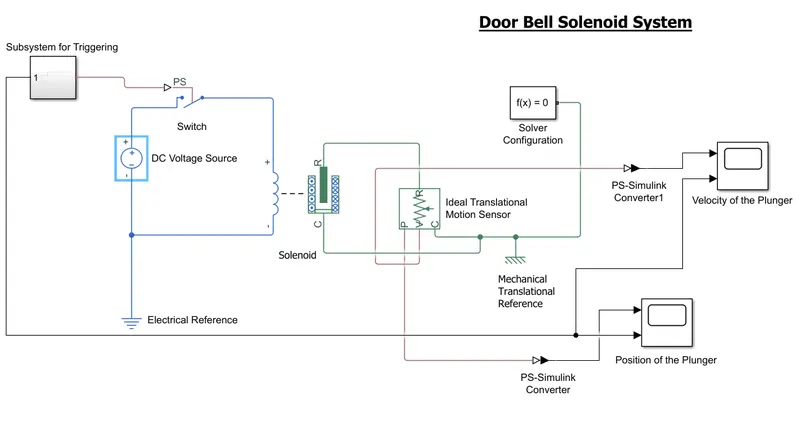
Target Model Explanation:
Here the Solenoid is operated using a switch(as given above) that is triggered by a Pulse Generator which generates a pulse having a width of 2sec. The Pulse Generator is placed in a different Subsystem which is shown below:
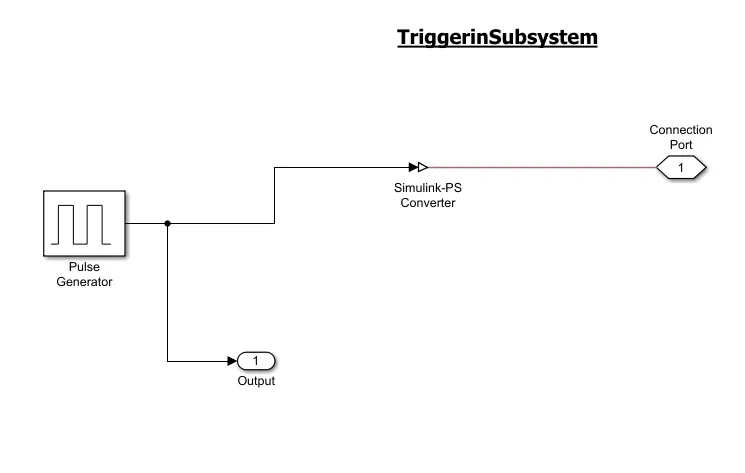
When the amplitude of the Pulse(taken as 1) generating from the Pulse Generator is more than the Threshold level of the Switch(which in our case is 0.5) then the switch gets connected and the 50V DC Voltage Source falls across the Solenoid and will get operated. So as the inductance of the Solenoid gets energised from the DC voltage source it will then attract the plunger and the movement of the plunger will then get observed by using an Ideal Translational Motion Sensor. From the Sensor point of view, it consists of two output ports from where both the position and velocity of the plunger can be observable when it gets connected to the respective Scope.
Results and Discussion:
The output waveform of the plunger position w.r.to the input pulse is shown in the figure below:
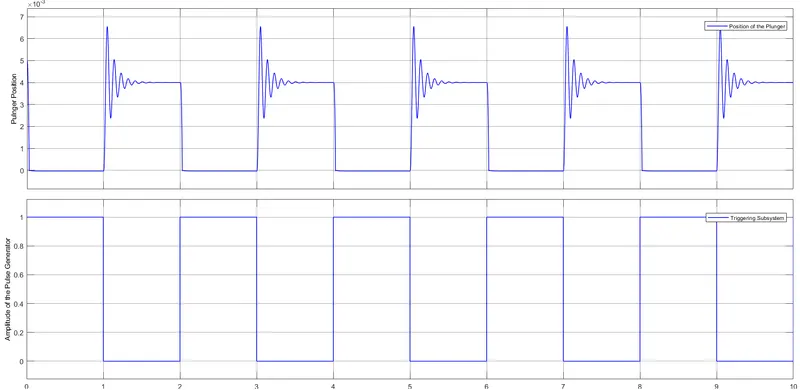
From the above curve it can be clearly seen that when the amplitude of the input pulse generator is falling from 1 to 0 then the position of the plunger is actually changing its state from energised position to de-energised position. Basically when the Solenoid is energised(i.e. when the amplitude of the input pulse generator is 1) then the plunger gets connected to the ground reference(i.e. its moves from R to C as shown in the simulink model) and thats why the waveform is showing zero corresponding to the amplitude of 1 of the Pulse Generator. Now when the amplitude of the pulse falls from 1 to 0 then the plunger moves away from ground reference and we can observe the peak as shown above. The waveform consists of certain ripple in the leading edge is because of the fact that the Solenoid consists of certain damping and in this project the Damping Constant is taken minimum(=1). With increase of the value of Damping Constant the ripple will get reduce but on the other hand the time taken by the waveform to get settle to a steady state will get increase.
The velocity waveform corresponding to the input pulse is also shown below:
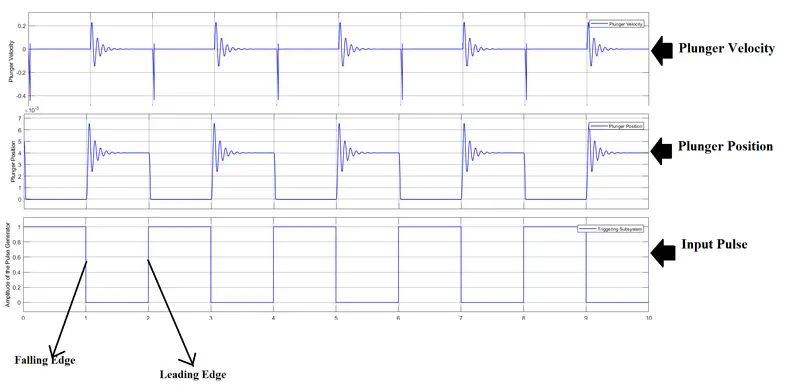
The above discussion can also be justified w.r.to the velocity waveform also where in the falling edge of the input pulse the change in the velocity waveform can be observed as the plunger is moving away from the ground reference( i.e R is moving away from C as shown from the simulink model) whereas in the leading edge of the input pulse the plunger is moving towards the ground reference (i.e R is moving towards C) so thats why there is a change velocity waveform observed and as it is moving in the opposite direction thats why it is shown in the negative axis.
Question 2:
Objective: 1) To build a Simulink Model consisting of a Thermistor that will sense the temperature of a heater system and will turn on or off the fan correspondingly.
2) To observe and analyze the output waveform in a condition when the temperature of the heater system is above 298K then the fan will operate otherwise it will remain OFF.
Simulink Model:
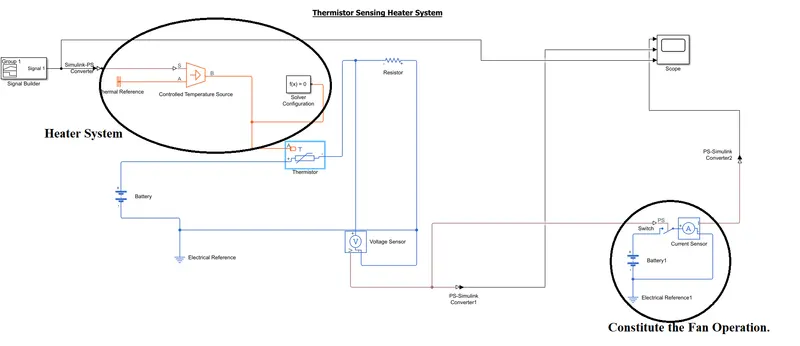
The Fan operation is represented using a Battery, PS Switch and a Current Sensor.
Target Model Explanation:
In the above Model, the input signal feeded to the Controlled Temperature Source is created using the Signal Builder according to the condition given in the question. The input signal so created is coming as shown below:
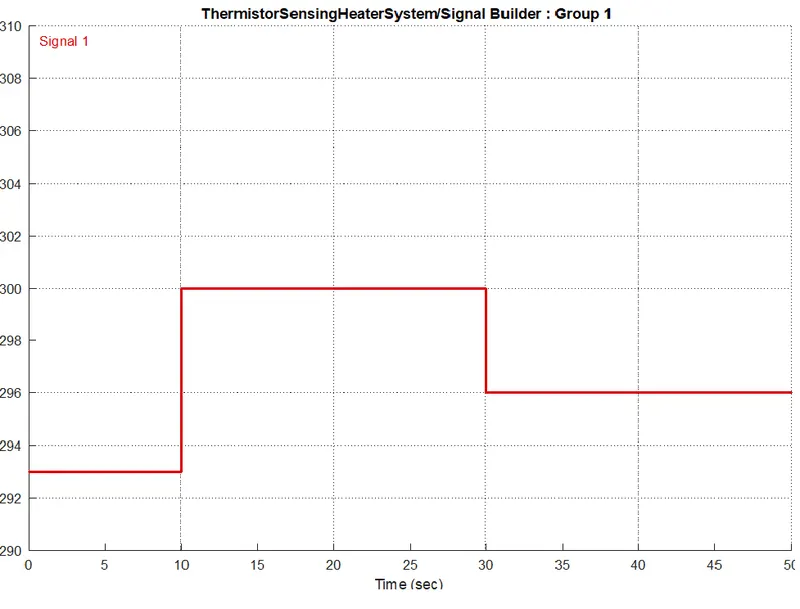
The following explanation can be made from the Target Model development:
- This input signal ultimately operates the Thermistor device. The Reference Temperature of the Thermistor is kept at 298K, so therefore according to the value of the temperature of the input signal the value of the Resistance of the thermistor is also changing, i.e. when the value of the temperature is higher the corresponding resistance provided by the thermistor to the electrical circuit is also higher. This can be easily seen from the Voltage Sensor waveform that is connected across the electrical circuit. Now this voltage Sensor waveform is further used as a triggering circuit to connect a battery to a Current Sensor that ultimatley constitue the fan operation as per our second objective.
- From the Fan's perspective, it consists of a Battery of a magnitude of 1V as the Fan input source and we observed the current flow using a Current Sensor to get the idea of when the Fan is operating and when it is disabled.
Results and Discussion:
From the above discussion the wavefrom form the Voltage Sensor Block is shown below:
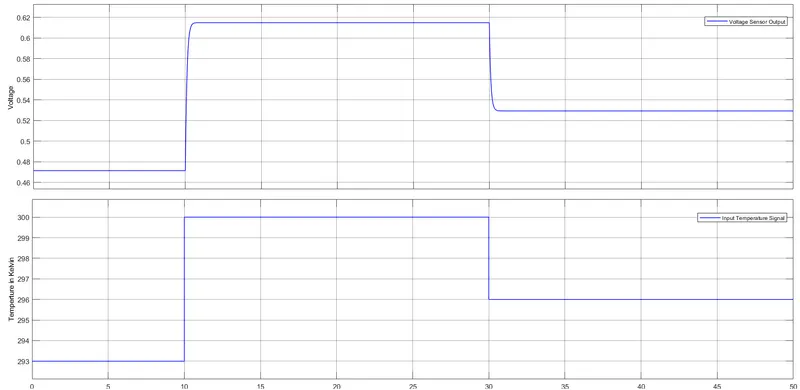
From the above output waveform it can be clearly seen that the voltage waveform is exactly following the same nature as that of the temperature of the heater system. This shows the proportionality of the Thermistor resistance with that of the temperature of the Heater as discussed above.
The corresponding output of the Fan Operation is also shown below:
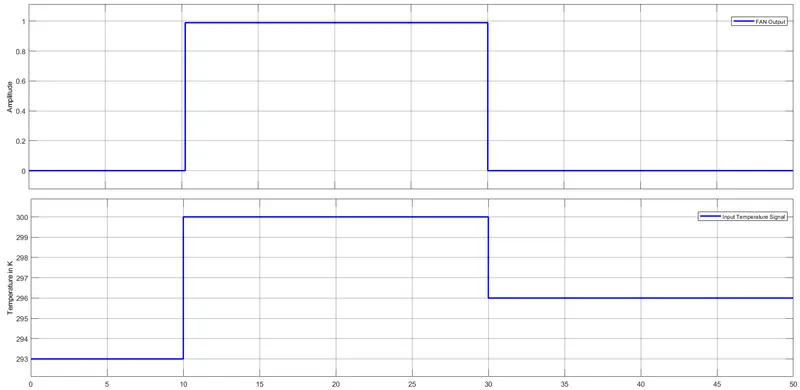
Basically the temperature signal corresponding to 298K gives a Voltage of magnitude 0.58V. So now the Threshold Level of the PS Switch of the Fan Circuit is choosen corresponding to the Voltage magnitude, now when the Voltage is above that level the PS Switch get closed and the circuit operates thereby giving the above Fan Output. However when the Voltage level drops below 0.58V(~=298K) the PS Switch gets open and the circuit get disabled, making the output signal fall to zero. This can be easily justify form the above Fan output waveform.