Week-11 Challenge: Braking
Q1.For a defined driving cycle, calculate the energy required for braking.
Ans:-
- Driving cycle is a data which provides the path behaviour of vehicle.
- It is a speed with respect to time relationship of vehicle in graphical or other formats.
- It is basically benchmark or reference which is used to analyse or predict
-Start/stop time for fuel consumption
-fuel econmy
- pollution
- It assesses the vehicle model before using it for various purposes, such as how well it handles slippery conditions or how quickly its engine warms up so that you can decide whether or not this type of vehicle is right for your needs.
Types of driving cycles:
-Urban Dynamometer Driving Schedule
-European driving cycle
-FUDS Fedral urban driving schedule
-Sub-urban driving cycles
-Transient driving cycles
We will consider the Urban Dynamometer Driving Schedule
The equation for kinetic energy from braking is given as,
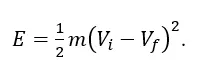
Where,
m = Mass of the vehicle in Kg.
Vi = Initial speed of the vehicle in m/s.
Vf = Final speed of the vehicle in m/s.
we will create the UDDS file and calculate the braking energy:
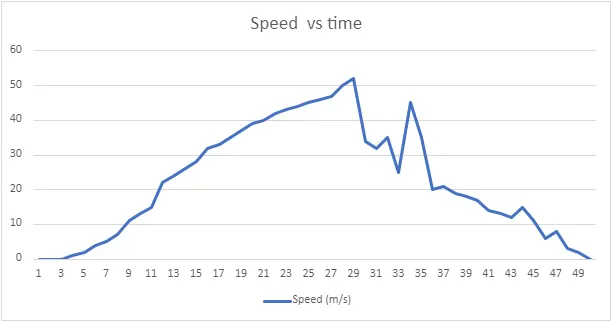
We will calculate the total braking energy required using 4 breakpoints
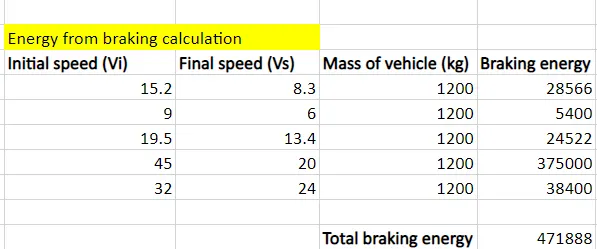
Therefore the total energy required for braking is 47.1KW
Q2.Why electric motor can’t develop braking torque at high speed similar to starting? How electric and mechanical brakes are coordinated?
Ans:-
From this curve we have two region, constant torque and constant power region. At the start the motor achieves peak torque till it reaches a certain motor speed range from where it will rapidly drop. The reason due to the drop in torque is due to the motor shaft reaching critical speed and the area where the peak torque is constant is known as the constant torque region of the motor. The region where the torque decreases is known as the constant power region as the power generated by the motor will be at it's peak.
Since the torque produced at the constant power region is very low, it is not possible to develop enough braking torque in this region. The braking torque produced increases as the speed decreases.
In electric vehicles regenerative braking is used which allows electric vehicles to use the motor as a generator when brakes are applied it convert vehicle energy from the brakes into an energy storage device.At high speed, the motor might be in its constant power region which causes less values of torques produced and this limits the amount of braking torque that is used for regeneration.
But there are certain limitation with regenerative braking the electric motor is unable to provide all the brake torque necessary for large decelerations. In case of braking if the braking torque is applied only one axle, there are chances stability and moveability issues can occur therefore to avoid such situation regenerative braking is operated using with a mechanical brake system where friction causes braking.
Electric brake system (regenerative braking) and mechanical brake sytem are used in strategic manner which is called as Brake Control Strategy.
Series Brake Control :
In this type of control system the Mechanical Brakes and Regenerative(Electric) Brakes are applied one after the another. We can not apply one brake system at a time we can apply either electric or mechanical brakes.
Parallel Brake Control:
In this type of brake control system both the echanical Brakes and electric brake systems are applied simultaneously.
Q3.Make a MATLAB program which plots contour of given motor speed, torque and efficiency values. Attach the code as a .m file attach a screenshot of all the plots.
Ans:-
AIM:-
To make MATLAB program which plots contour of given motor speed, torque and efficiency value.
We will assume:
Motor Speed - 0 - 1000 rad/s
Motor Torque - 0 - 500 N.m
and losses below
% Motor efficiency contour.
clear all
close all
clc

% Defining the speed and torque as arrays.
x = linspace(1,1000); % Motor speed in rad/s
y = linspace(1,500);  % Motor torque in N-m

% Motor loss constants
Kc = 0.1;     % Copper losses constant
Ki = 0.006;   % Iron losses constant
Kw = 0.00001; % Windage losses constant
CmL = 25;    % motor losses constant

%2-D grid torque and speed
[X,Y] = meshgrid(x,y);

 % Power equation
Output_power = X.*Y;

% Copper losses equation

Cl = (Y.^2)*Kc;

% Iron losses equation
Il= X*Ki;

% Windage losses equation
Wl= (X.^3)*Kw;

Input_power = Output_power + Cl + Il + Wl + CmL;

% Efficiency calculation

Z = Output_power./Input_power;

% Mapping the contours of the efficiency
V = [0.70,0.72,0.75,0.77,0.79,0.80,0.81,0.82,0.83,0.84,0.85,0.86,0.87,0.88,0.89,0.90,0.91,0.92,0.93,0.95];

% Plotting the contour
box off
grid off
contour(X,Y,Z,V);
xlabel('Speed in rad/s');
ylabel('Torque in N-m');
hold on
We have to is plot the graph using the contour command for speed, torque, and efficiency.
-First we have put the constants in a script i,e losses copper,iron,windage and motor
-The 2-D arrays of the speed and torque are then defined as 3-Dimensional arrays using the meshgrid command.
-The input power is defined as = output power + motor losses.
-The output power equation is defined as = the product of speed and torque.
-Efficiency is defined as the ratio of output power to input power.
-In order to map the contour for different efficiency ranges an array is defined which consists of the efficiencies from 0.7 to 0.95.
OUTPUT:
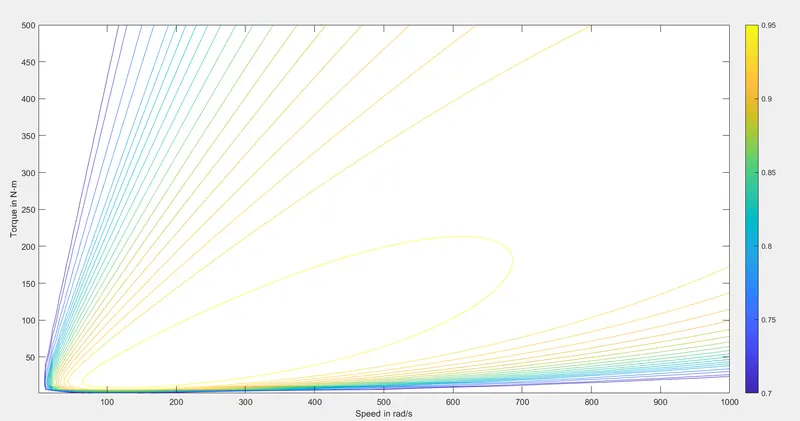
-From the output we can see the variation in speed and torque when efficiency increases.
-We can see the efficiency level in colour bar dark blue indicates less efficiency and bright yellow indicates high efficiency.
- increasing speed and torque, the efficiency of the motor gradually decreases to overcome the motor losses lower speed-torque combination is required to overcome the motor losses with high motor efficiency.
Conclusion:
Thus created MATLAB program which plots contour of given motor speed, torque and efficiency value and analysed the output graph.