Modelling of EV using MATLAB and Simulink
Create a MATLAB model of electric car which uses a battery and a DC motor. Choose suitable blocks from Powertrain block set. Prepare a report about your model including following:
AIM: - To create a Simulink model of electric vehicle
Objectives:-
- System level configurations
- Model parameters
- To find results
- Conclusion
Theory:
An electric vehicle (EV) is one that operates on an electric motor, instead of an internal-combustion engine that generates power by burning a mix of fuel and gases. Electric Vehicles (EV’s) include, road and rail vehicles, surface and underwater vessels, electric aircraft and electric spacecraft. Though the concept of electric vehicles has been around for a long time, it has drawn a considerable amount of interest in the past decade amid a rising carbon footprint and other environmental impacts of fuel-based vehicles. An electric vehicle may be powered through a collector system by electricity from off-vehicle sources, or may be self-contained with a battery, solar panels, fuel cells or an electric generator to convert fuel to electricity. They use an electric motor for propulsion. The most common types of motors used are permanent Magnet Synchronous Motor (PMSM) and three phase induction motor.
Types of EV’s:
-Plug-in Electric Vehicle
-On- and Off-road Electric Vehicles
-Space Rover Vehicles
-Seaborne Electric Vehicles
-Airborne Electric Vehicles
-Electrically Powered Spacecraft
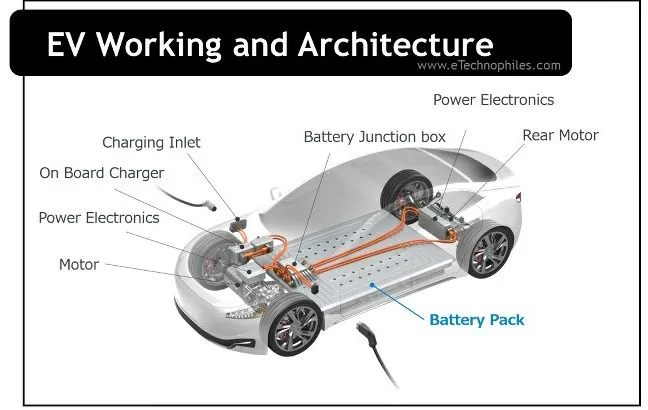
Main parts of the electric car are:
-Battery with BMS controller
-inverter
-Motor or generator
-Storage device
-Charger
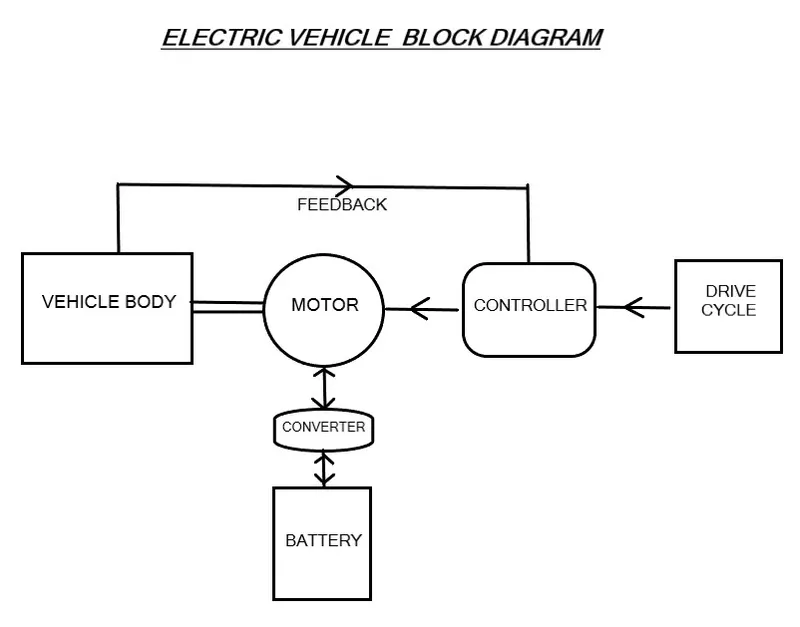
Matlab/Simulink model of electric vehicle:
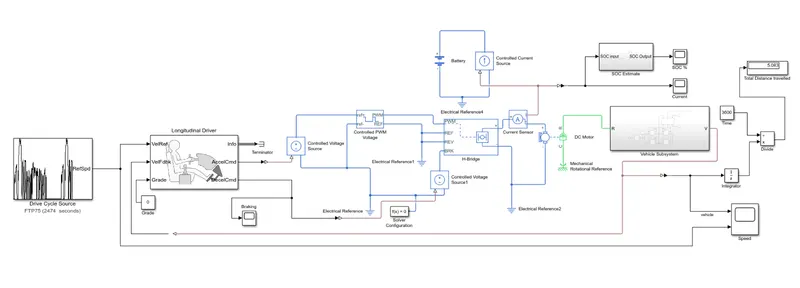
Blocks used for modeling:
Powertrain Block sets:
They provide fully assembled reference application models of automotive powertrains, including gasoline, diesel, hybrid, and electric systems. It includes a component library for simulating engine subsystems, transmission assemblies, traction motors, battery packs, and controller models. Also, they provide a standard model architecture that can be reused throughout the development process. It can use it for design tradeoff analysis and component sizing, control parameter optimization, and hardware-in-the-loop testing. And it can customize models by parameterizing components in a reference application with customizing data or by replacing a subsystem with the self-created model.
- Drive cycle source
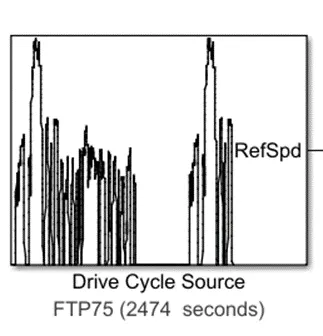
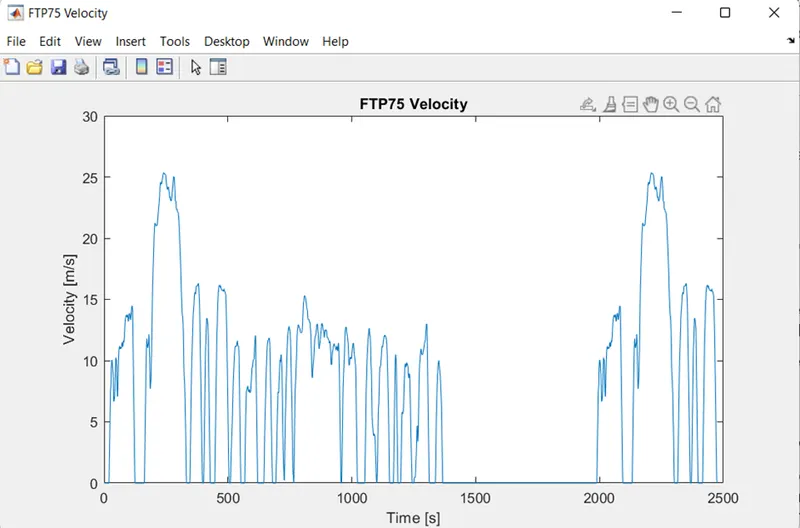
The Drive Cycle Source block generates a standard or user-specified longitudinal drive cycle it predicts the engine torque and fuel consumption that a vehicle requires to achieve desired speed and acceleration for a given gear shift reference.
We can see the characteristics of the given drive cycle by clicking on the plot drive cycle:
2.Longitudinal driver model:
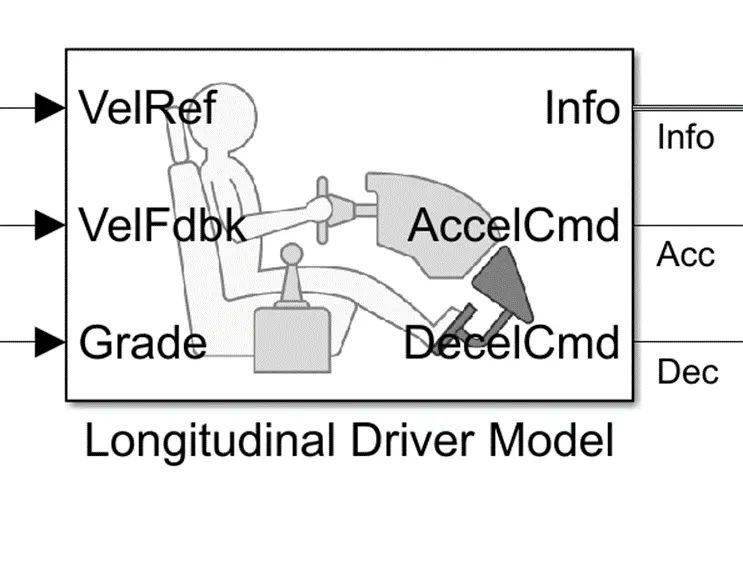
The Longitudinal Driver block implements a longitudinal speed-tracking controller. Based on reference and feedback velocities, the block generates normalized acceleration and braking commands that can vary from 0 through 1. You can use the block to model the dynamic response of a driver or to generate the commands necessary to track a longitudinal drive cycle.
3) Controlled voltage source:
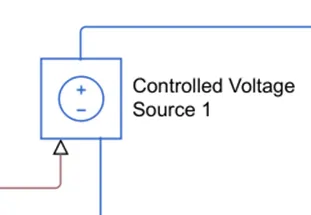
It is used to control the voltage which is connected to the positive reference of the controlled PWM voltage in the form of a signal by the longitudinal driver model acceleration command.
4) Controlled PWM voltage:
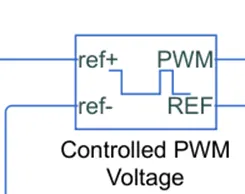
It is used to give the Pulse Width Modulation signals to the H bridge circuit at PWM terminal. The +ve reference terminal of the block is connecter to the controlled voltage source and -ve is connected to the electrical reference, the PWM is connected to the H bridge PWM as said above and REF is connected to the REF and REV terminals of the H bridge. Actual the main aim of the controlled PWM voltage is to give the controlled voltage in the form of a pulses in the DC voltage.
5) Current sensor block:
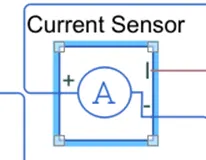
This is used to measure the current flowing through the H-bridge.
6)H-Bridge:
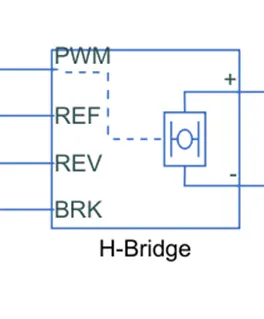
This block represents an H-bridge motor drive. The block can be driven by the Controlled PWM Voltage block in PWM or Averaged mode. In PWM mode, the motor is powered if the PWM port voltage is above the Enable threshold voltage. In Averaged mode, the PWM port voltage divided by the PWM signal amplitude parameter defines the ratio of the on-time to the PWM period. Using this ratio and assumptions about the load, the block applies an average voltage to the load that achieves the correct average load current. The Simulation mode parameter value must be the same for the Controlled PWM Voltage and H-Bridge blocks.
7) DC motor:
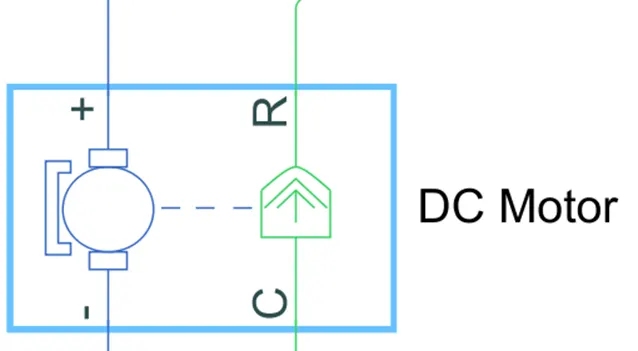
It is used to convert the electrical energy to mechanical energy. In this electric vehicle model, we have used type is permanent magnet DC motor. This motor can also act as a generator in the case of regenerative braking.
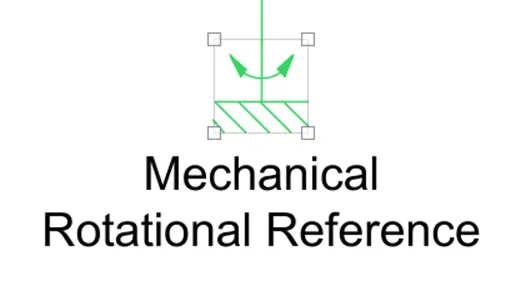
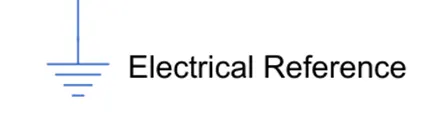
8) Electrical and mechanical rotational references:
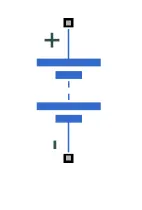
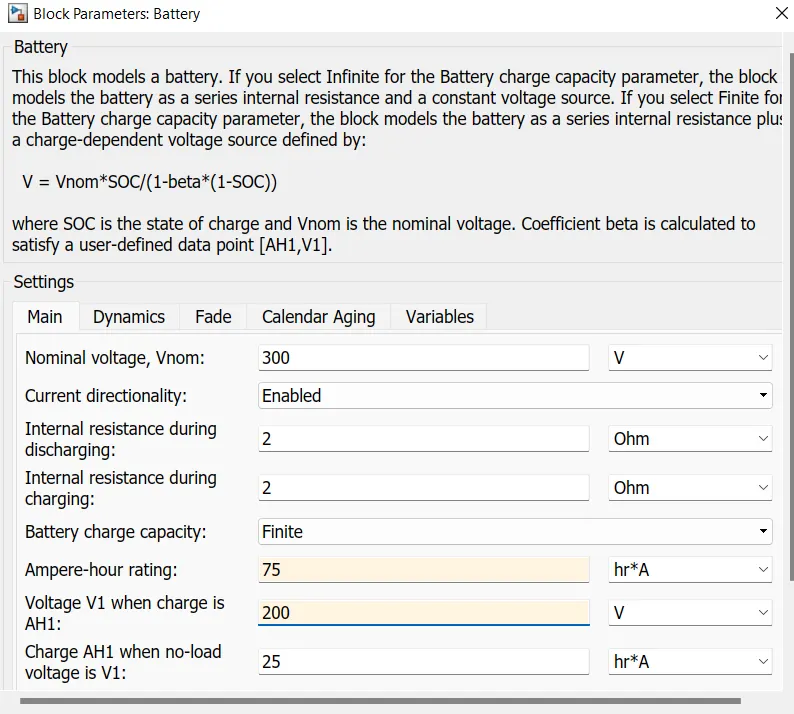
9) Battery:
10) Controlled current source block:
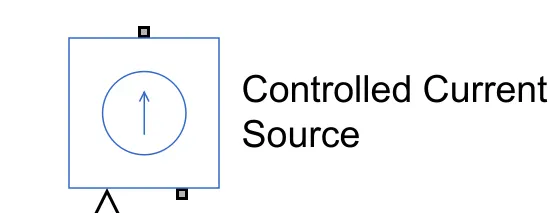
The Controlled Current Source block represents an ideal current source that is powerful enough to maintain the specified current through it regardless of the voltage across the source.
Vehicle body subsystem:
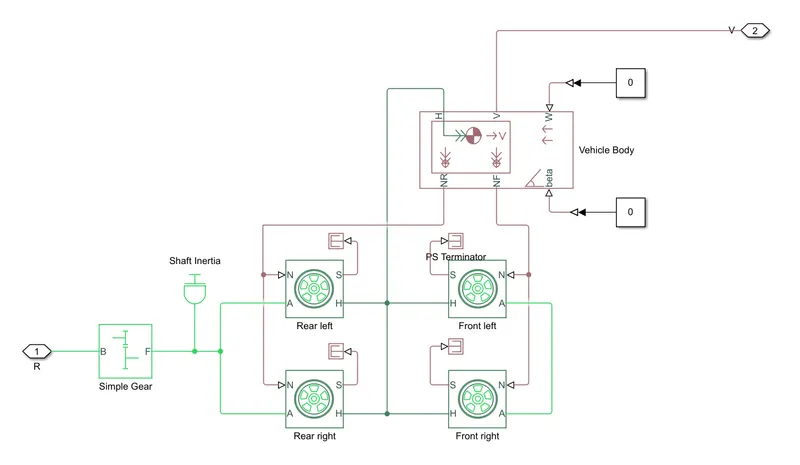
Contains Simple gear, four Tyres (magic formula), vehicle body
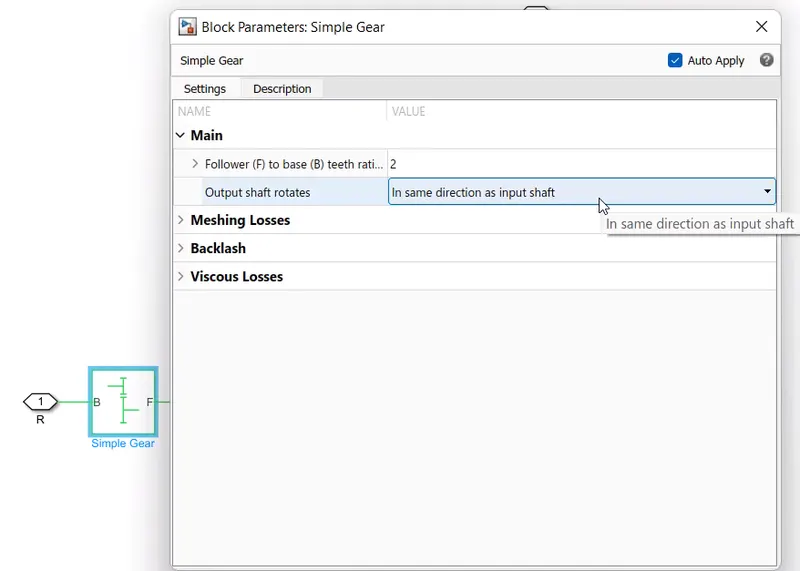
Output shaft rotation changes to in same direction as input shaft.
-Input is receiving from DC motor.
-Gear ratio is fixed gear box for transmission of tires.
- Shaft inertia this block represents an ideal mechanical rotational inertia.
-The Vehicle Body block represents a two-axle vehicle body in longitudinal motion. The vehicle can have the same or a different number of wheels on each axle. For example, two wheels on the front axle and one wheel on the rear axle. The vehicle wheels are assumed identical in size. The vehicle can also have a center of gravity (CG) that is at or below the plane of travel. The block accounts for body mass, aerodynamic drag, road incline, and weight distribution between axles due to acceleration and road profile.
-Output of this subsystem is velocity.
SOC Estimate subsystem:
The sub-block of the SOC contains the Rate transition block, gain block and the discrete time integrator.
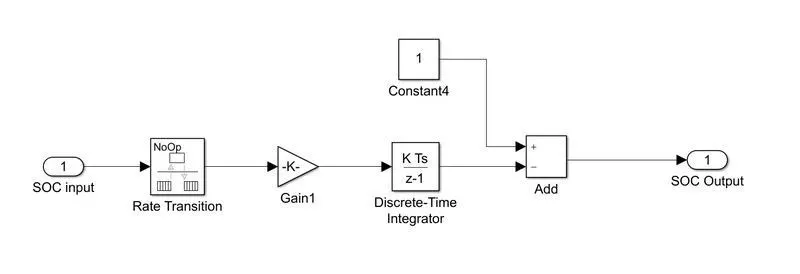
11) Rate Transition:
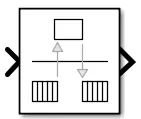
-The Rate Transition block transfers data from the output of a block operating at one rate to the input of a block operating at a different rate.
This will determine the voltage level in the battery at each point of simulation. The output from the current block is received at the input signal of the block and display the characteristic of the battery voltage consumed for the particular drive cycle.
12) Gain:
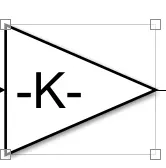
Then a gain block is connected to it. This gain will multiply the value of k=1A.seck=1A.secIn this case the battery capacity is in Ahr, which is ampere hour.
To convert: A sec = Ahr*(3600)
13) Discrete Time Integrator:
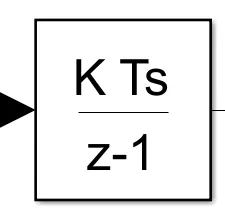
Then to add all these values with respect to time, we have used a Discrete-time integrator.
To get the results of this model we have to keep the stop time to 2474 sec or above because of the given drive cycle source with FTP (2474 seconds).
Result of ports:
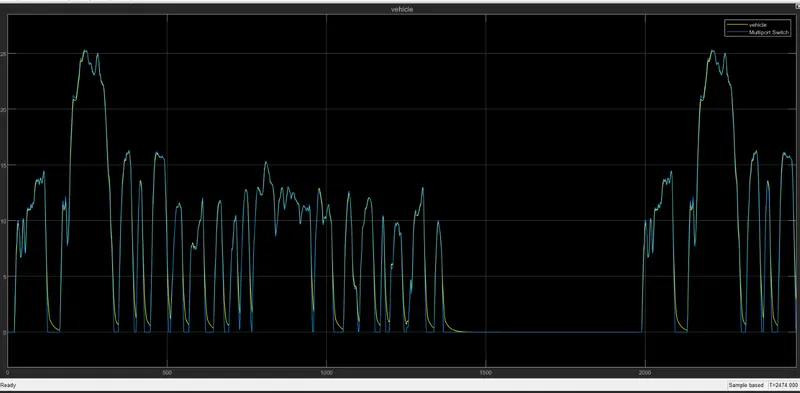
-Drive cycle (reference velocity) vs Vehicle velocity
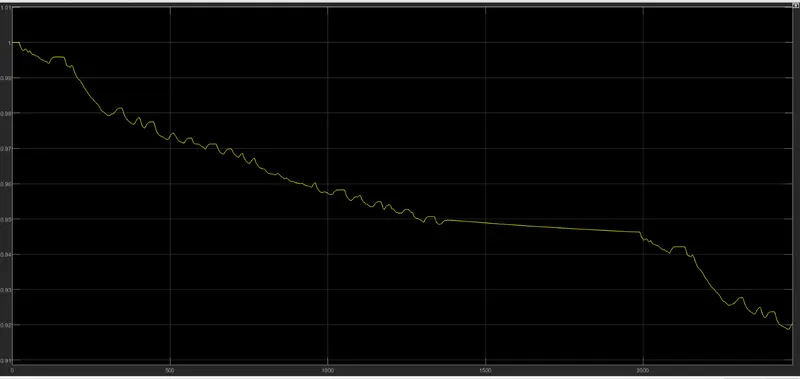
-SOC%
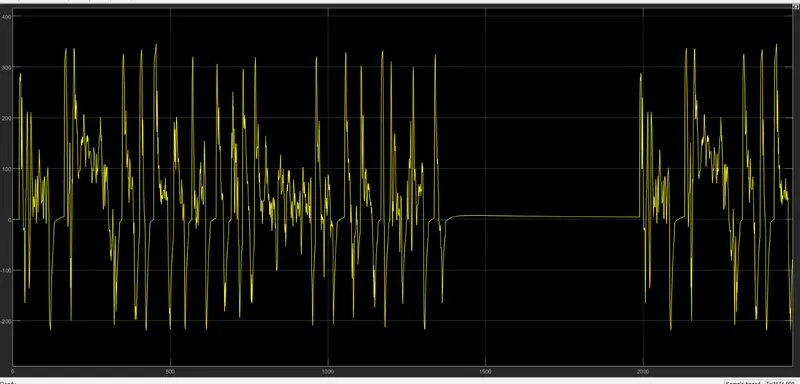
-Current
Conclusion:
- In the speed trace plots of drive cycle vs vehicle velocity for all the drive cycles which are observed in this study, the feedback speed plot and the reference speed plot overlap each other almost completely but there are regions where both the speeds are different. It is when the vehicle is decelerating.
- In case of SOC of battery state of charge for each drive cycle can be analyzed from the SOC plot. As long as the vehicle is accelerating the SOC is decreasing but as soon as the deceleration starts, the SOC plot goes slightly up. This is because the battery is being charged, due to regenerative braking during deceleration.
-In case of current as long as vehicle is normally moving current is maximum but it drops up to to half when vehicle is in regenerative braking mode.