Week-4 Challenge WOT Condition Part-2
Q1.What is the difference between mapped and dynamic model of engine, motor and generator? How can you change model type?
Ans:
| Mapped Engine | Dynamic Engine |
| Uses Steady-state look-up tables to characterize the engine performance | The engine behavior is broken down into engine characteristics seperated by lower level components. By combining these subsystems, the dynamic effect is captured. |
| Engine data from Dynamometer or GT-power is required. | Component level data is required. |
| For quasi-steady state simulation | To analyze the impact of engine components on overall performance |
| Mapped Motor | Dynamic Motor |
| It is based on the tabulated Torque-Speed envelope | It is based on the detailed design parameters of the motor |
| The block assumes that the speed fluctuations due to mechanical load do not affect the motor torque tracking | Transient effects are taken into account |
| The output torque tracks the torque reference demand and includes a motor-response and drive-response time constant | The block uses the three-phase input voltages to regulate the individual phase currents, allowing control of the motor torque or speed |
| Mapped generator | Dynamic generator |
|
Behavior can be represented as a set of lookup tables of generator efficiency and motor torque. |
Dynamic model of generator decompose the motor behavior into individual component models.The performance is estimated using real time details leveraring specifications provided by the user. |
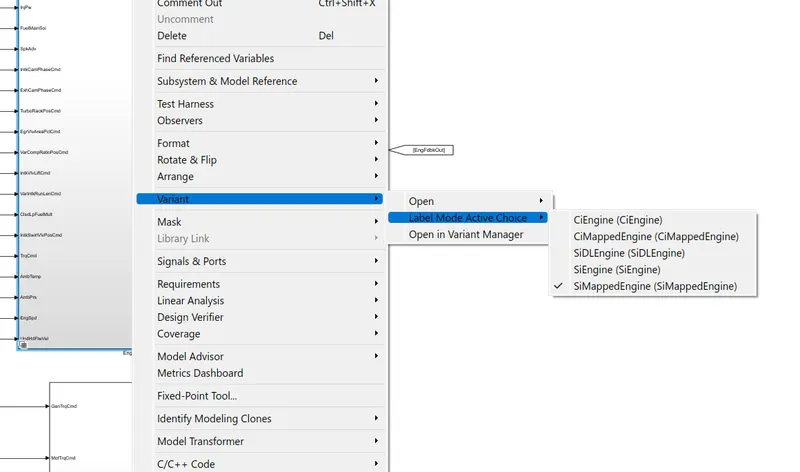
We can change the model type by changing the varient option mode by in model tab after that select between the mapped or dynamic modelbut only one variant can be active at a time and other variants are disabled.
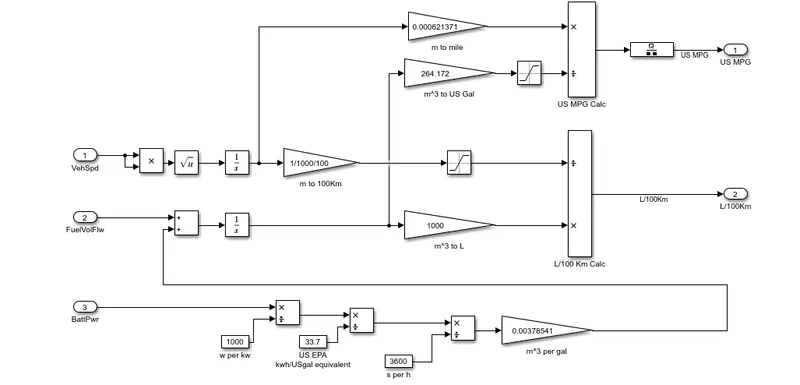
- Calculation of Miles per Gallon and factors in fuel flow model:
- Vehicle Speed (from drive cycle)
Vehicle speed is taken as input. The square root of square of vehicle speed is obtained and then using the Integrator block, the distance travelled by the vehicle in meters in obtained.
- Fuel Volume Flow (from engine output)
Fuel Volume Flow second. This fuel volume is added to the fuel volume equivalent of battery power.
- Battery (from the state of charge output)
Battery Power is taken as input. It is the value of battery power consumed by the vehicle at the end of the drive cycle in terms of Watts.
The vehicle speed is used to calculate the total distance of the drive cycle, by integrating the root mean square over the total time.
If the uses fuel (HEVs), the instantaneous fuel flow volume is integrated over the travel time to get the accumulated fuel volume flow. If a vehicle uses battery energy (EVs, HEVs), the instantaneous battery energy is converted to the equivalent instantaneous fuel flow rate by using the standard conversion constants.
If the vehicle uses both sources of power,
Total instantaneous fuel volume flow=Fuel volume flow from engine+Equivalent fuel volume flow from battery
Total instantaneous fuel volume flow=Fuel volume flow from engine+Equivalent fuel volume flow from battery
Thus, we can calculate MPG (mile per gallon),
MPG=Distance covered Total Instantaneous fuel volume flow
-Product block is then used to divide battery power with 33.7 to obtain US gallons per hour as output.
-Product block is used to convert the value to US gallons by dividing input by 3600. Using Gain block, the gallons are converted to m^3 by multiplying gallons with 0.00378541.
( 1 Gallon=0.00378541m3 )
-Distance in meters is fed into Gain block to convert it to miles (1 m=0.000621371 mile). The total fuel volume is put through Gain block to obtain the US gallon equivalent
( 1 m3=264.172 US gallons )
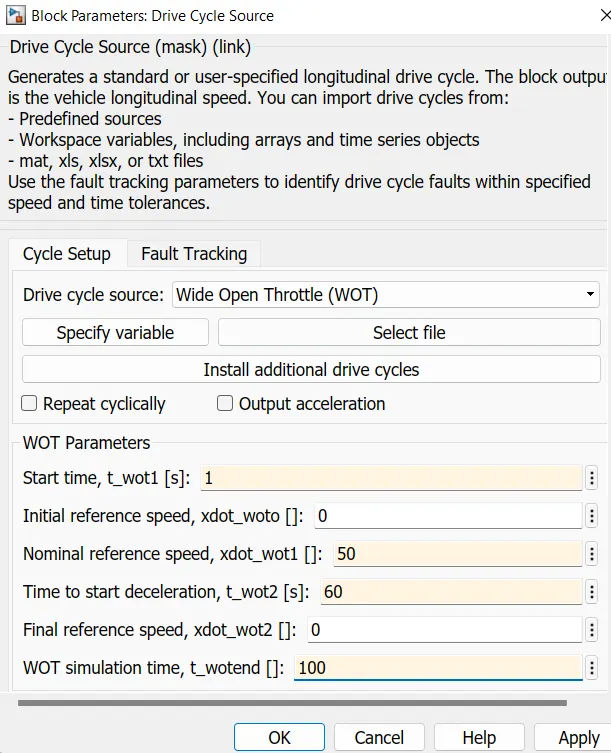
- Run the HEV Reference Application with WOT drive cycle. Change the grade and wind velocity in the environment block.
Hybrid Electric Vehicle configuration:
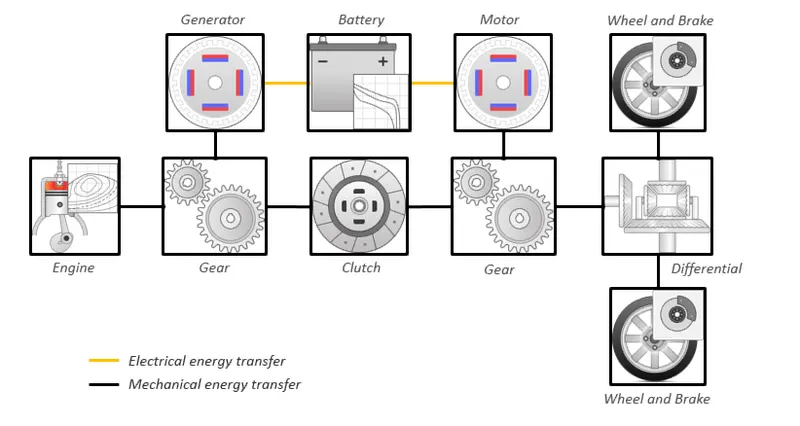
HVE multimode can be open from help >documentation section
Simulink model of the HEV multimode model as follows:
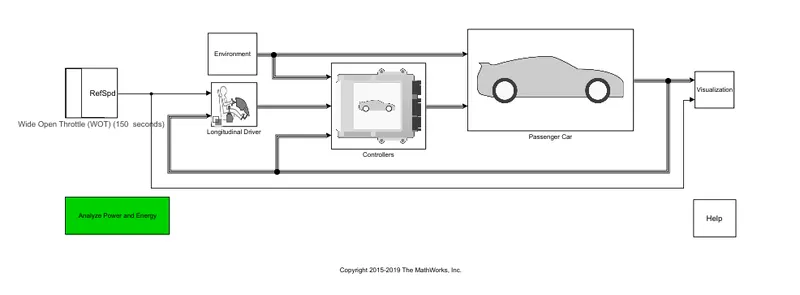
Now, we will change the grade and wind velocity in the environment block and see the results.
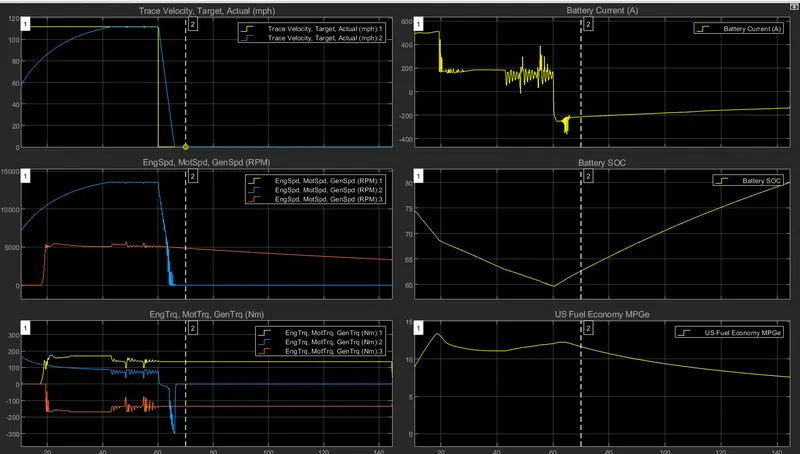
Output plots:
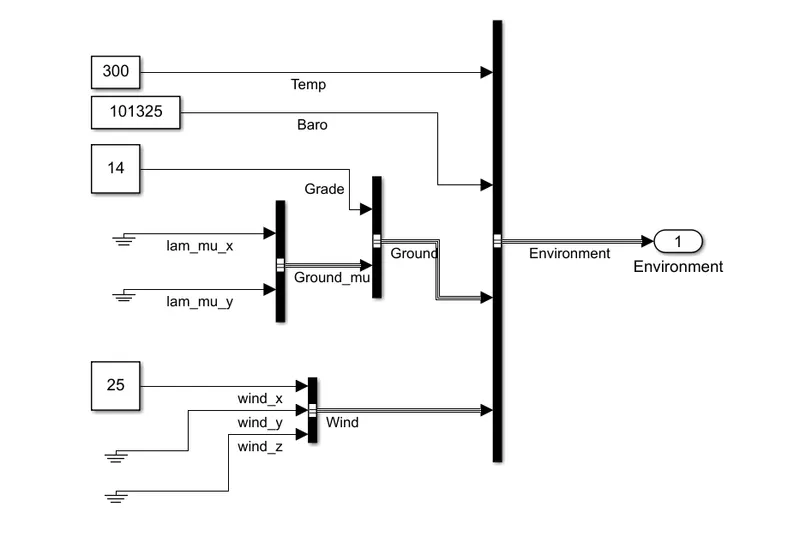
Now changing the environmental block
Grade = 14
Wind = 25 m/s
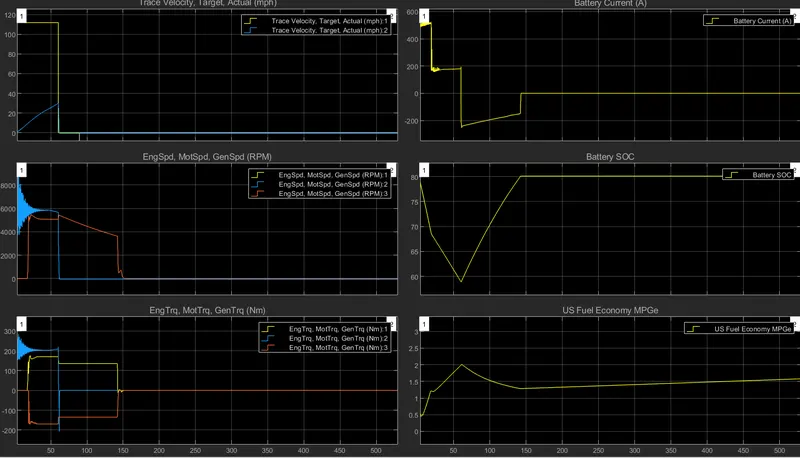
RESULTS:
Plot 1(Trace Velocity, target, actual velocity):
-This plot visualizes the velocity vs time.
-The vehicle reaches the desired velocity after few seconds of acceleration.
-In second case when we add the vehicle doesn't reach the desired velocity due to gradeability and resistance force due to wind.
Plot 2(Engine speed, Motor speed, Generator speed):
-It shows motor and engine speed.
- Motor gives initial acceleration it produces power to reach the maximum desired velocity. We then see that the motor still runs at some speed along with the engine to maintain the constant velocity.
- In second case where we have added, Now changing the environmental block, Grade = 14, Wind = 25 m/s
- the motor is not capable to produce enough propulsion power to reach the desired maximum velocity, thus the engine contributes to the propulsion effort. But both the powers are not sufficient for operation.
Plot 3(Engine torque, motor torque, and generator torque):
- Engine runs at maximum torque stabilization of power takes place between motor and engine once it reaches it desired speed.
- Negative value of the generator shows that the engine torque is used to charge the battery.
-In second case we don’t see any stabilization.
Plot 4(Battery current):
- In both the cases more current is required for the completion of demand therefore graph decreases accordingly and the negative battery current value indicates the regenerative braking and charging by the engine.
Plot 5(SOC):
-Battery SOC drops to some percentage but again it reaches its initial level due to regenerative braking.
- Keeping all other parameters the same, compare the simulated results of hybrid and pure electric powertrains.
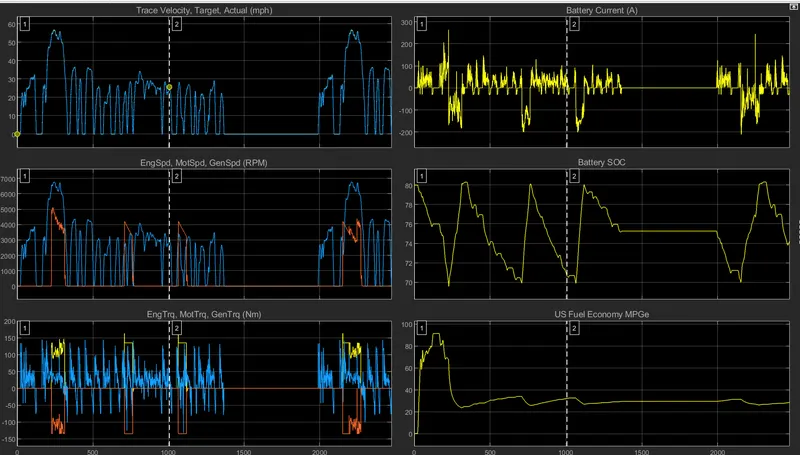
HYBRID POWERTRAIN:
We are using drive cycle source ( FTP75 )
PLOT RESULTS: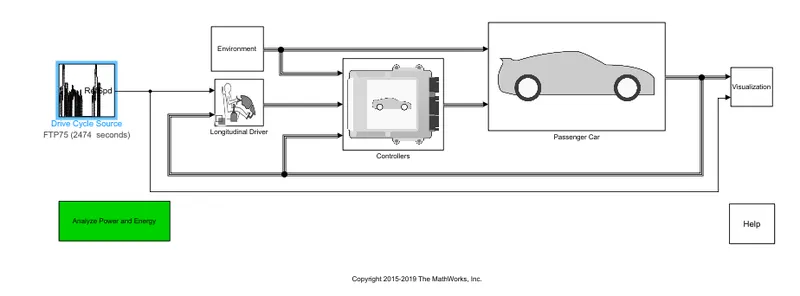
PLOT RESULTS:
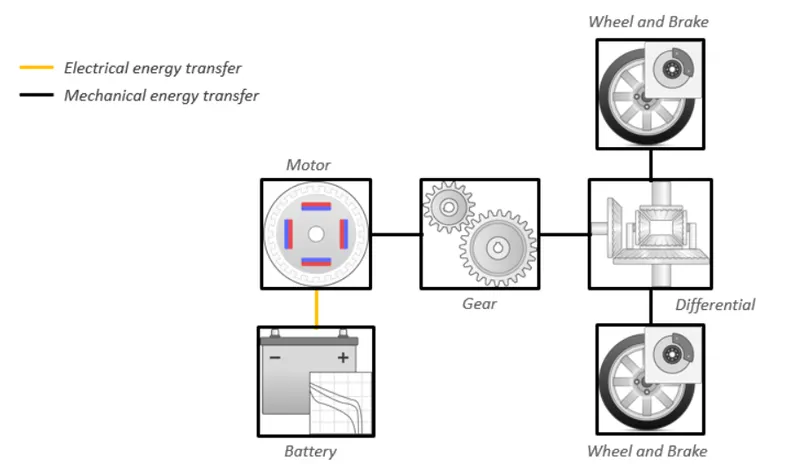
FULL ELECTRIC POWERTRAIN:
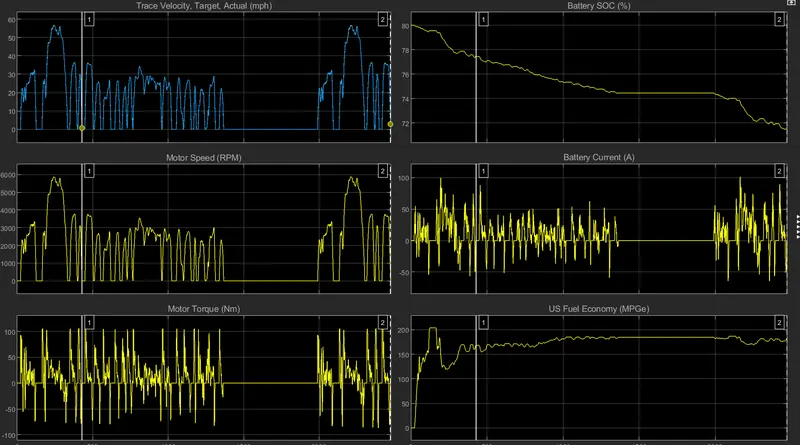
PLOT RESULTS:
| HYBRID | ELECTRIC |
| Engine and motor both combine powers are used for acceleration power is high. | Only motor is used for acceleration power which is low as compare to hybrid. |
| Battery SOC% drop is high.Small battery two power sources. | Battery SOC% drop is low.Big battery single power source. |
|
Battery run long time due to combined power.Fuel is used comparable expensive. |
Only single power source therefore run time is less. |