Week-11 Challenge: Braking
Objective1: For a defined driving cycle, calculate the energy required for braking.
Answer: For a defined drive cycle for 600sec, the braking energy is calculated as below.
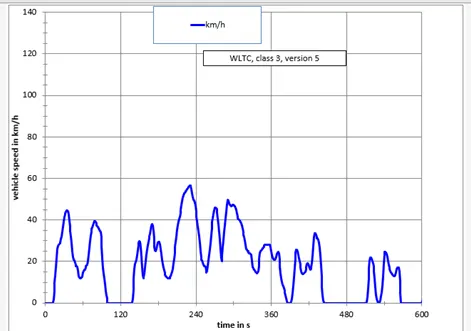
Braking energy is given as:
Total braking energy= 500{(44.5^2-12.0^2)+(39.0^2-0.0^2)+(29.8^2-12.0^2)+(38.0^2-12.0^2)+(56.5^2-14.5^2)+(46.0^2-20.2^2)+(49.8^2-14.3^2)+(28.2^2-0.0^2)+(25.6^2-13.9^2)+(19.1^2-16.2^2)+(33.5^2-0.0^2)+(21.9^2-0.0^2)+(24.5^2-13.1^2)+(17.0^2-0.0^2)}*(1000/3600)^2
=619.060 kJ
Note: As speed is given in kmph so it is converted into m/s.
Reference:
https://unece.org/DAM/trans/doc/2012/wp29grpe/WLTP-DHC-12-07e.xls
Q2. Why electric motor can’t develop braking torque at high speed similar to starting? How electric and mechanical brakes are coordinated.
Answer:
(A) From the speed-torque characteristics, it can be found that starting torque is always more than the running condition torque or up to base speed motor gives constant torque. After base speed torque decreases as the speed increases.
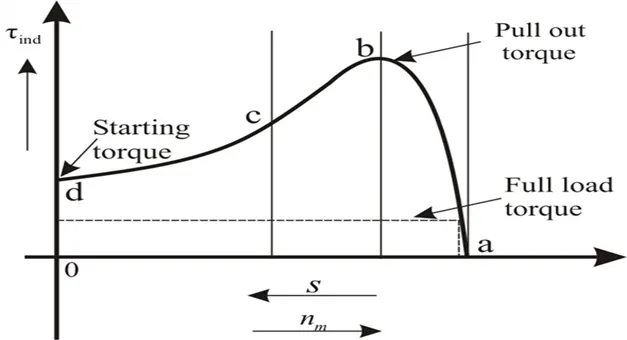
When motor is in running at stable point of operation ‘a’ and braking is desired, so the torque becomes negative.
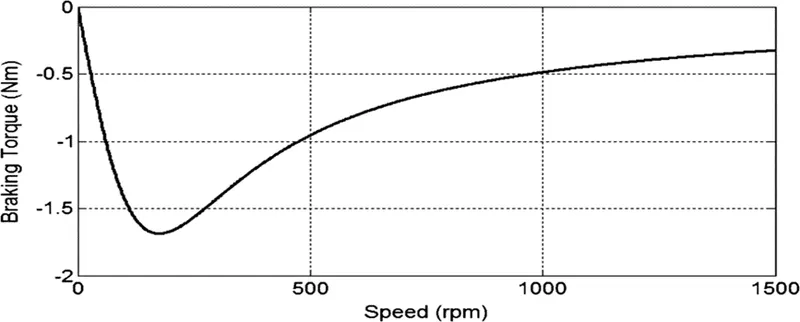
Now the motor can develop braking torque only which is available at point a`, which is surely less than the value of starting torque, that’s why electric motor can not develop braking torque at high speed, similar to high starting torque.
Reference:
(B) In order to increase the efficiency and safe operation, usually there is a combination of electrical and mechanical brakes. One cannot apply only electrical brake, as there will be problem related to charging current and braking torque availability. During braking the charging current will be high, and less braking torque is available than the starting torque.
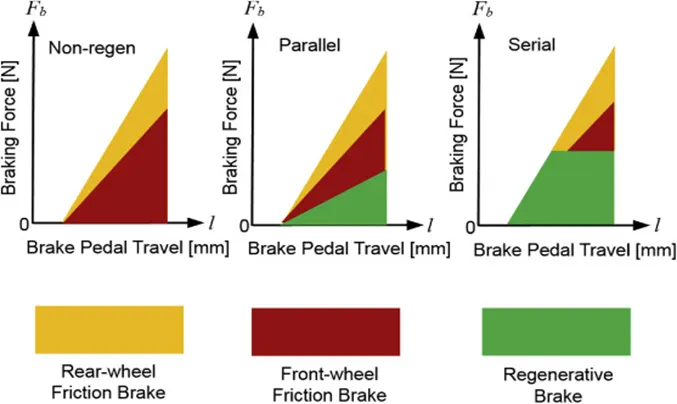
Following brake control strategies can be implemented. Brake control strategies are decided by speed torque characteristics.
- A) Series: Electrical and mechanical brakes are applied one after another. So, at a time either regenerative brakes, or mechanical brakes are applied.
- B) Parallel: Both electrical and mechanical brakes are applied simultaneously
Figure below shows the pictorial representation of different brake control strategies.
Reference:
https://www.sciencedirect.com/science/article/abs/pii/S0360544218302743
Objective3: To make a MATLAB program which plots contour of given motor speed, torque and efficiency values.
Matlab Script
Torque= linspace(1,250,250); %Input torque values from 1 to 250N-m
speed= linspace(1,1000,250); %Input speed values from 1 to 1000 RPM
[w,T]= meshgrid(speed,Torque); % making array of speed and torque
kc=0.298; % Copper loss Constant
ki=0.009; % Iron loss constant
kw=0.00005; % Windage loss constant
c=31; % To represent fixed losses
Pout= w.*T; % Output shaft power
Iron_loss=ki*w; % Iron loss
copper_loss=kc*(T.^2); % Copper Loss
windage_loss=kw*(w.^3); % Windage loss
Pin= Pout+Iron_loss+copper_loss+windage_loss+c; %Input power
efficiency=Pout./Pin;
n= [0.5,0.6,0.7,0.75,0.85,0.9,0.95,1]; % To create efficiency bar
contourf(speed,Torque,efficiency,n)
contourcbar
title('Speed-Torque-efficiency Contour')
xlabel('speed in RPM')
ylabel('Torque in N-m')
Result:
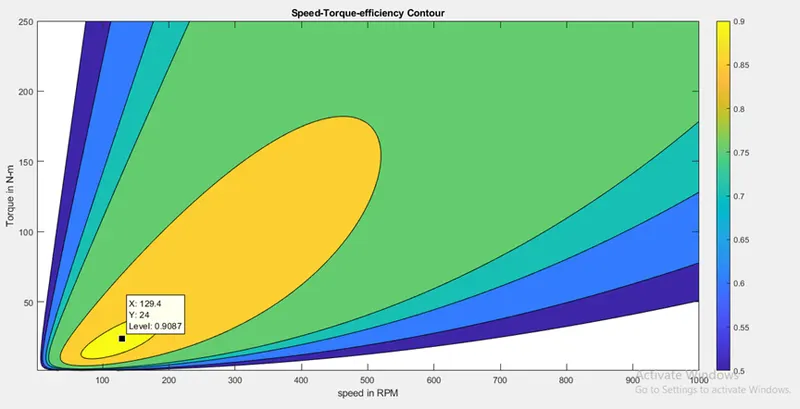
The contour represents torque on Y-axis, speed on x-axis, and the contours of circles represent the efficiency for given speed and torque. The color represents the height range or efficiency range, for example, the yellow color circle represents the efficiency range from 90% to 90.87%.