Week-4 Challenge WOT Condition Part-2
Objective1 Difference between mapped and dynamic model of engine, motor and generator. How can you change model type?
(A)
Mapped model:
(1) Data driven model generally by lookup table
(2) Static model
(3) Preferred for system level Simulation
(4) Represents Macro behavior
(5) Takes less simulation time
Dynamic model:
(1) Represents actual component model
(2) These models represent dynamic behavior
(3) Preferred for component level simulation
(4) Takes more simulation time
Mapped motor or generator model operates in torque-control mode, used when the problem is to track the reference torque or power demand. In mapped models, it is assumed that speed fluctuation due to mechanical load/electrical load does not affect the motor torque or generator power
For engines, mapped models are used for quasi state simulation, while dynamic models are used analyze the overall components efficiency.
(B)
Model type can be changed from the variant manager option as shown below
Here the Dynamic model is selected, which can be changed as follows
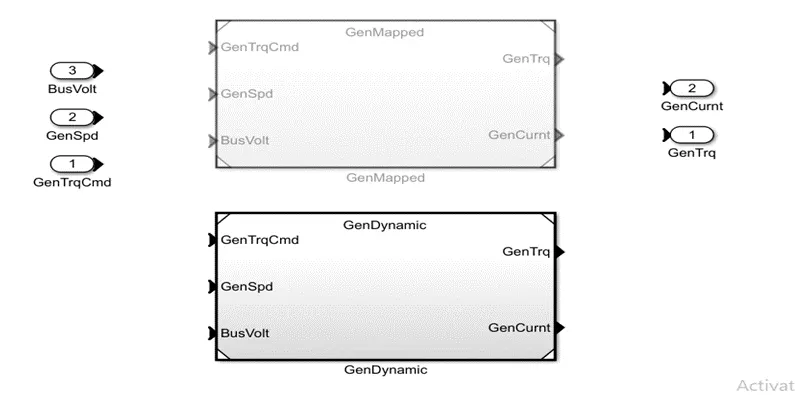
Here the Dynamic model is selected, which can be changed as follows
Right click on the any model, which will open the below tab
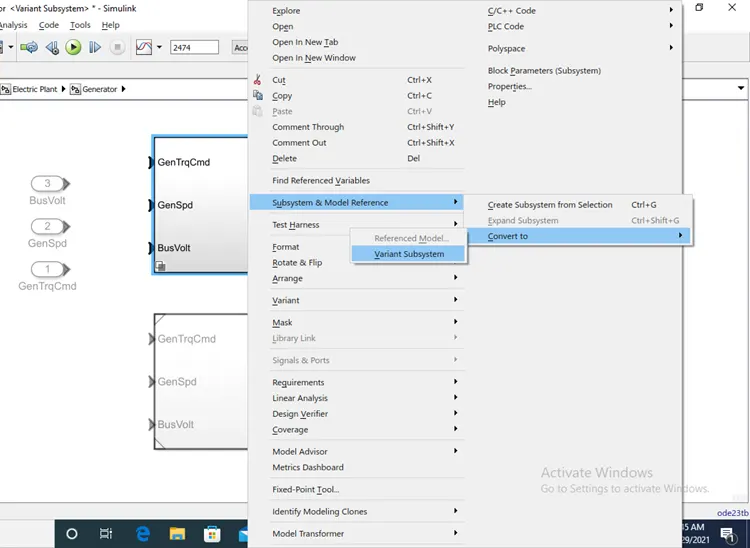
Select variant sub-system
Again right click

And go to variant manager

Select override using choice to select the desired model
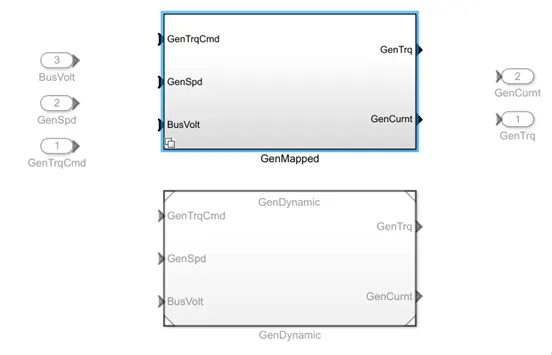
Now the model type is changed.
Objective2: How does the model calculate miles per gallon? Which factors are considered to model fuel flow.
Tsking HEV reference model
Form the vehicle speed, distance in miles can be found
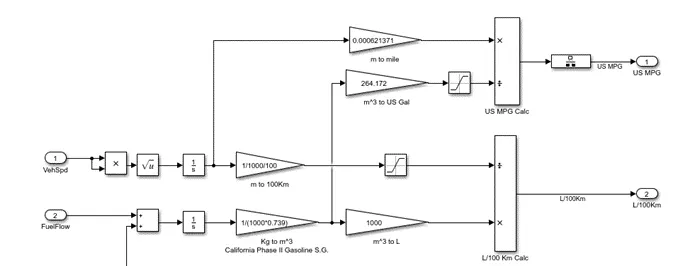
From the fuel flow, after integrating it, fuel in Kg is converted into m^3, then into gallons.
After calculating miles and gallons, miles per can be calculated
Objective3: HEV ReferenceApplication with WOT drive cycle.
Simulation model:
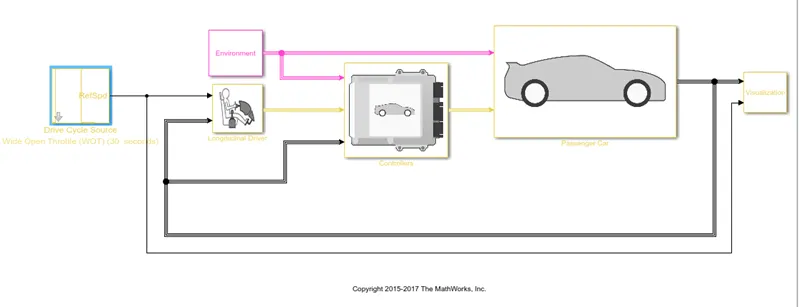
From the drive cycle change the derive cycle to WOT cycle.
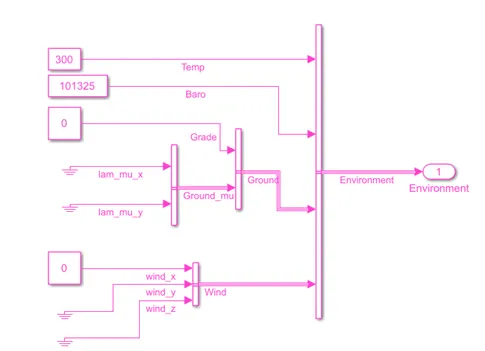
Default environment condition is shown below
Results: WOT simulation results, for the default condition is shown below
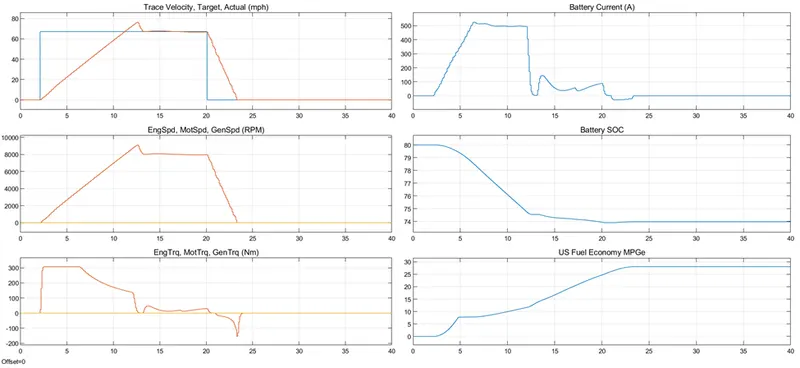
At t= 2sec, the wide open throttle input is given, with reference speed of 30 m/s or 67.108 sec, up to t=20sec. Target or actual speed is shown by red color, which tracks the reference speed at about t=13 sec.
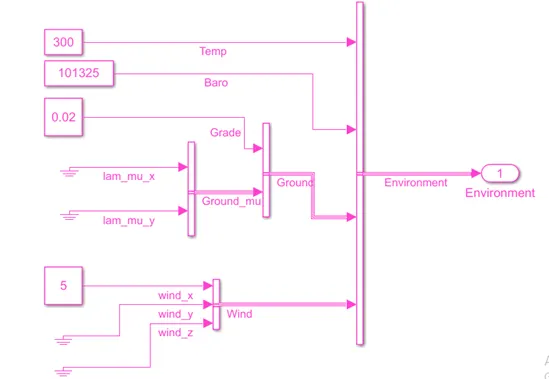
Now using environment block the gradient and wind velocity is changed to 2% and 5 m/s in x direction respectively.
Results:
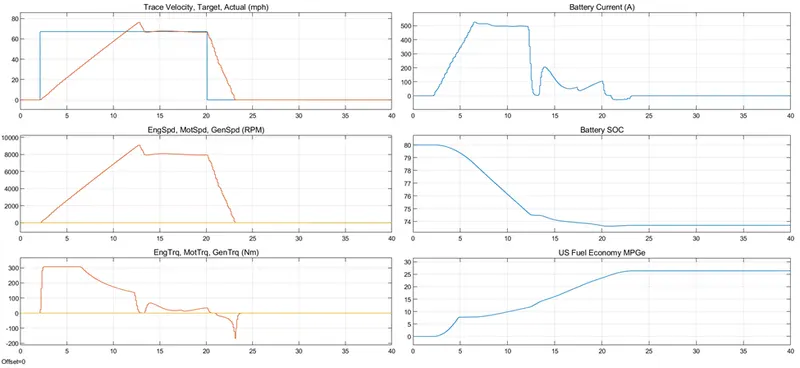
Now clearly we can see that, the time to reach the desired speed increased about t=14sec, also the battery state of charge at the end of drive cycle decreases below 74%, and there is reduction in fuel economy, as the more power is now required to overcome the hill climbing and drag force.
Objective4: compare the simulated results of hybrid and pure electric powertrains
Simulation result FTP dive cycle for 2474 sec is shown below
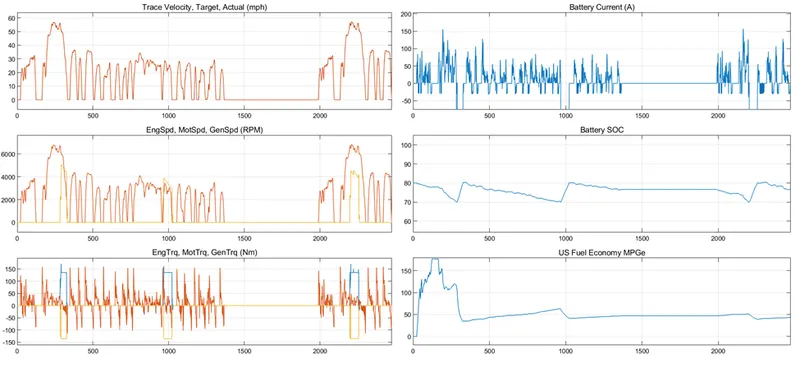
Now for the same FTP cycle for duration of 2474 sec the pure electric vehicle model is simulated and keeping all other specification.
Simulation results is shown below
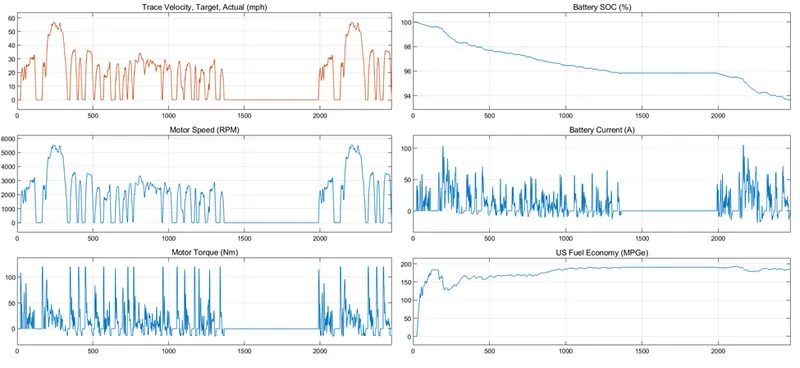
As pure electric vehicle only consists of motor and generator. So, battery will be charged only when there is regenerative braking, while in HEV we can see that, whenever the SOC reaches 70%, IC engine drives the generator and charges the battery again until the SOC reaches to 80%.
As the efficiency of electric vehicles is way more than IC engines, which has typical efficiency of about 15%. Therefore by observing the miles per gallon plot we can see that Pure EV is more efficient that HEV.