Week 1 Stress Concentration on a Plate with hole
Objective :
To perform the analysis of a metal block in tension test and to check the differences in stress distribution due to the varying design configuration of the block.
Procedure :
The 2 case types are analysed separately below
Material selection
First we will add the materials to be used for the block.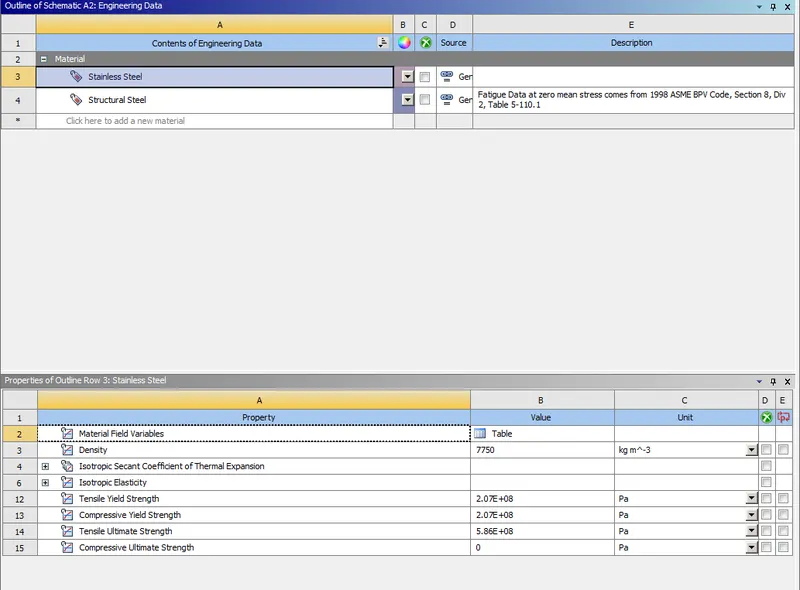
From the materials library we select the material stainless steel for this simulation. The values for various parameters come pre-filled when we select the material card.
CAD model :
Case (1)
Next we will design the model of the metal block in spaceclaim.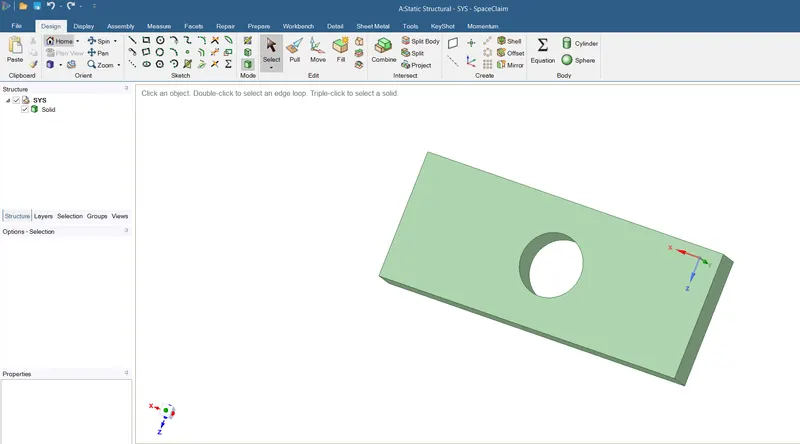
First we create the 2d drawing of the block with the given dimensions with the hole in the centre.
Next we use the pull option to extrude the model to a thickness of 30mm as required.
Hence the model has been created.
The volume of the above material is given as 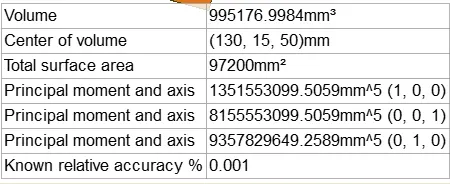
The density of the material is 7.75e-06 kg/mm³.
Hence we get the mass of the block as 7.713kg
Case (2)
For the second case, the CAD model is developed in a similar way with the addition of 1 extra hole on either side of the central hole.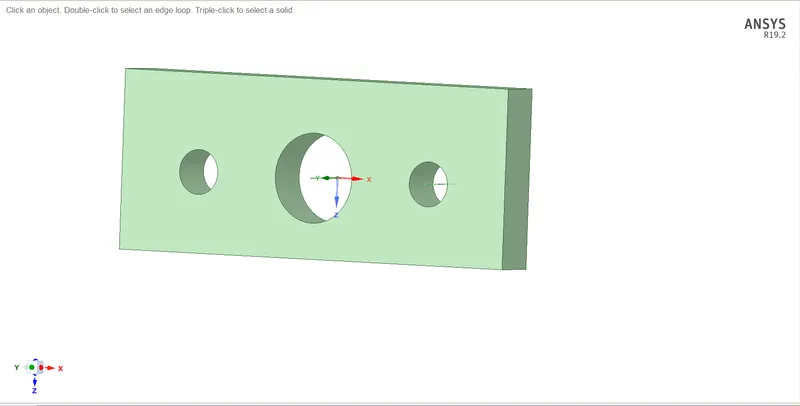
The volume of the above material is given as 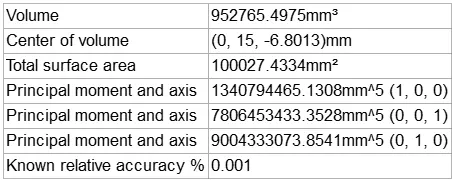
The density of the material is 7.75e-06 kg/mm³.
Hence we get the mass of the block as 7.384kg
This block is 4.45% lighter than the above block
Setup of simulation :
Next we will set up the rest of the simulation in Ansys mechanical. As we can see the model gets opened in Ansys mechanical application.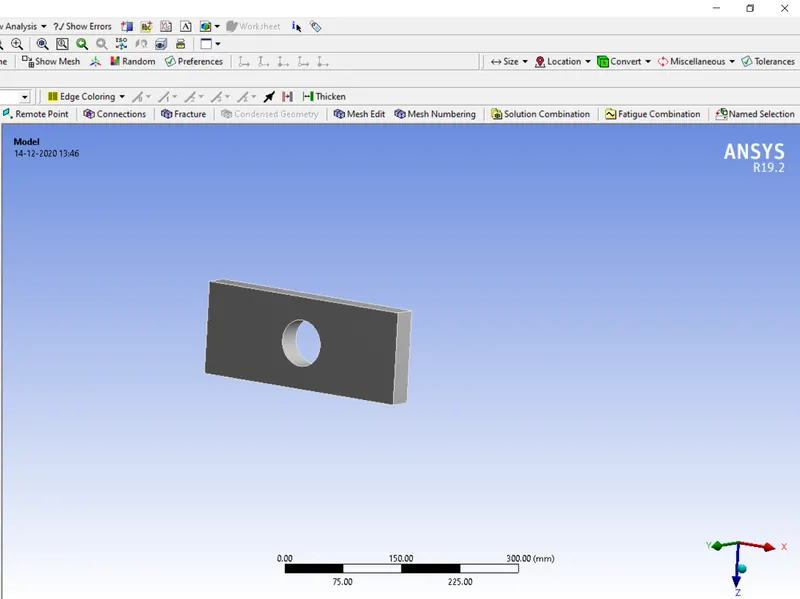
Generating the mesh : A mesh size of 3mm is chosen with high smoothing for better feature capturing around the edges. The meshing method chosen is tetrahedrons.
Case (1)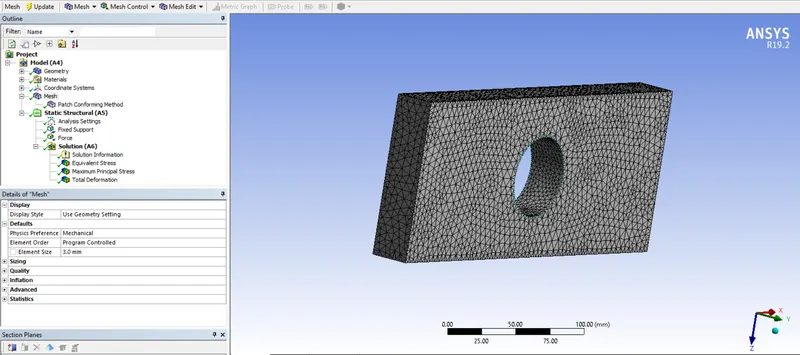
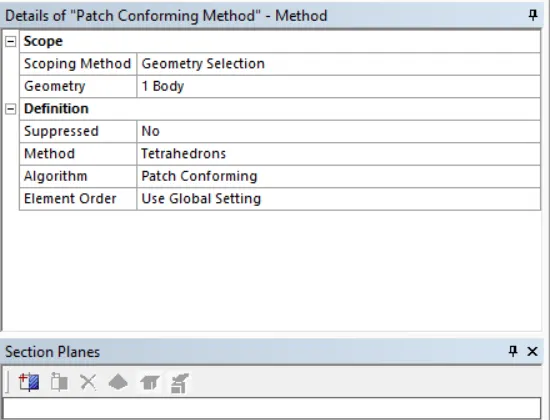
The total number of nodes and elements generated in the mesh are as follows: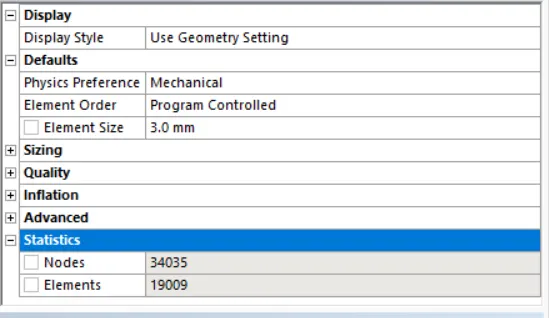
Case (2)
For the second case, the mesh is generated with similar element size and parameters as shown below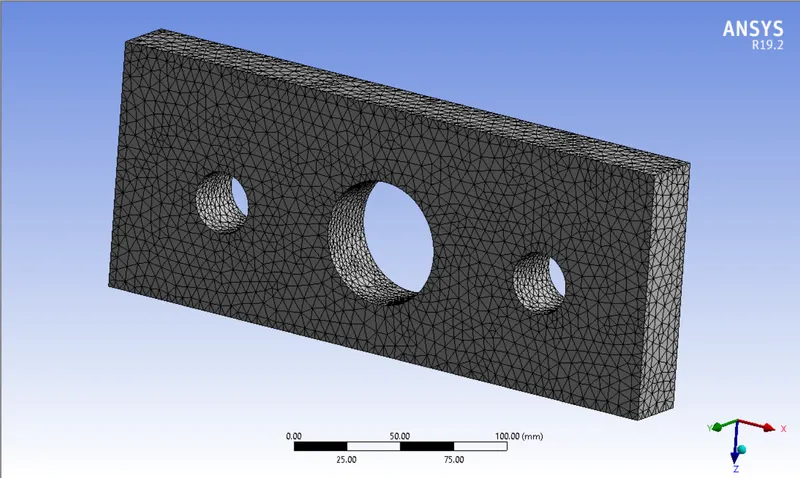
This case has the following number of elements and nodes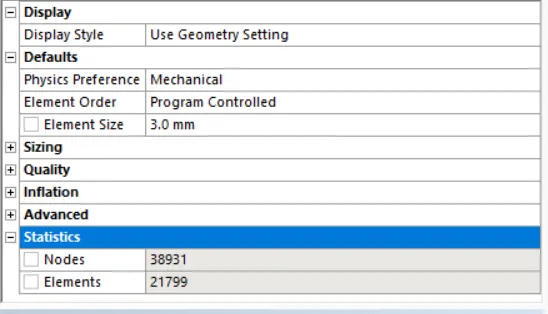
Setting up the physics :
Next we apply a fixed support to one end of the metal block.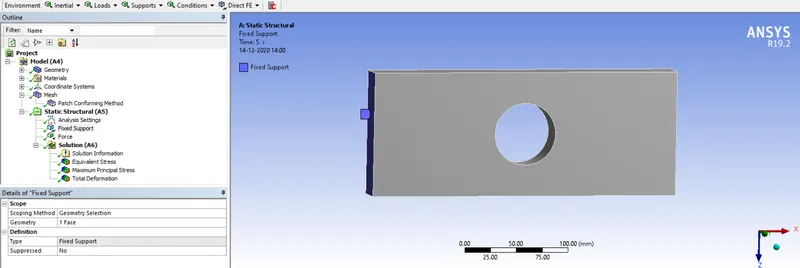
Applying force :
Next we apply force to the other end of the block in a ramped manner as shown below. The data is inputted in tabular form.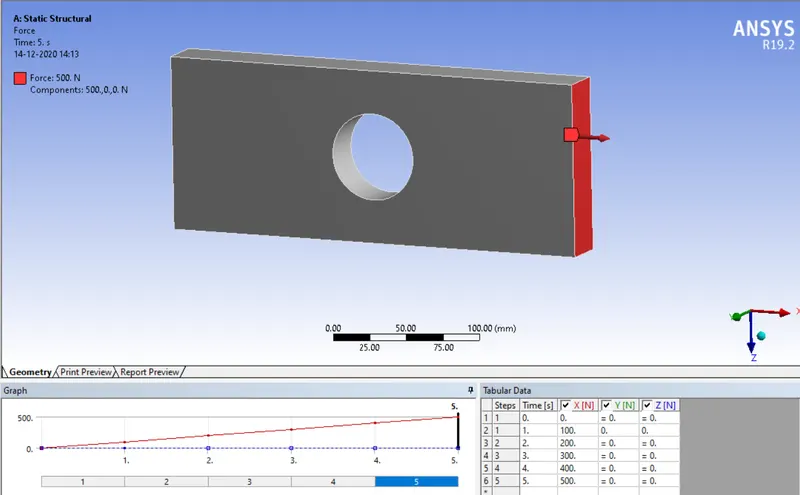
Analysis settings :
The simulation is divided into 5 steps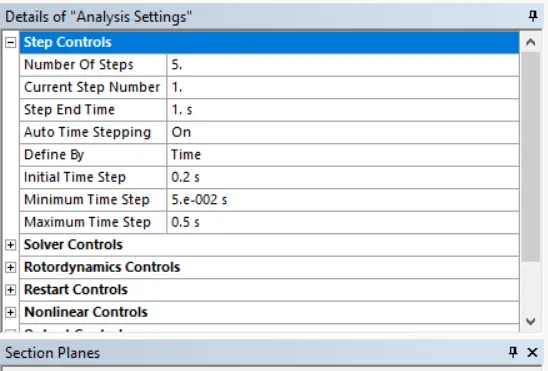
The initial, minimum timstep, maximum timestep are chosen as below. Large deflection is kept on.
Solution output :
The solution output is requested for the following parameters as requested.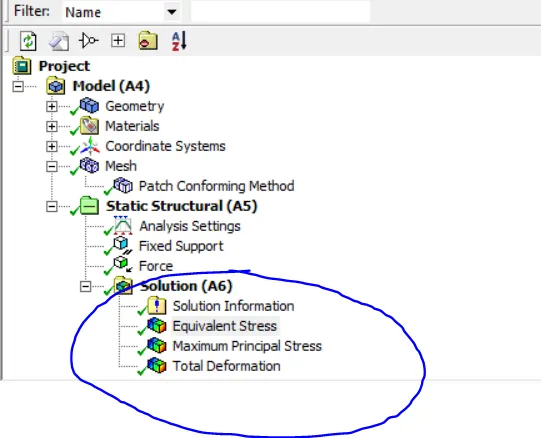
The simulation is setup the exact same way for both the cases with the only difference in the CAD model being used.
Run the simulation :
The simulation is then run by right-clicking on analysis-->solve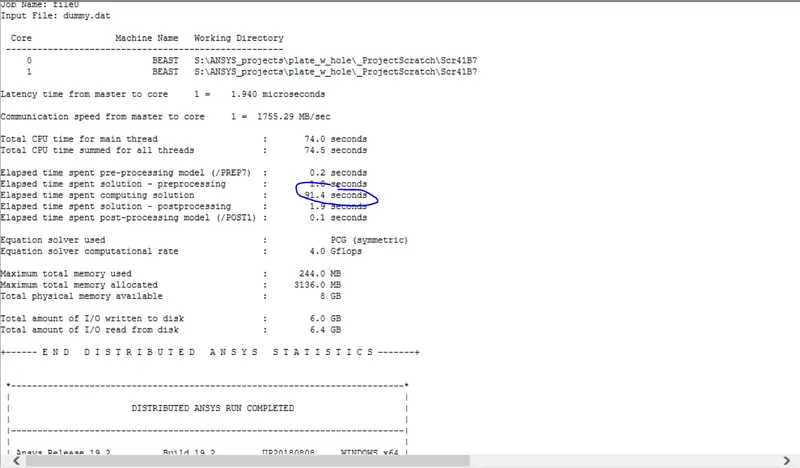
We can see the run-time in solution information.
Case (2)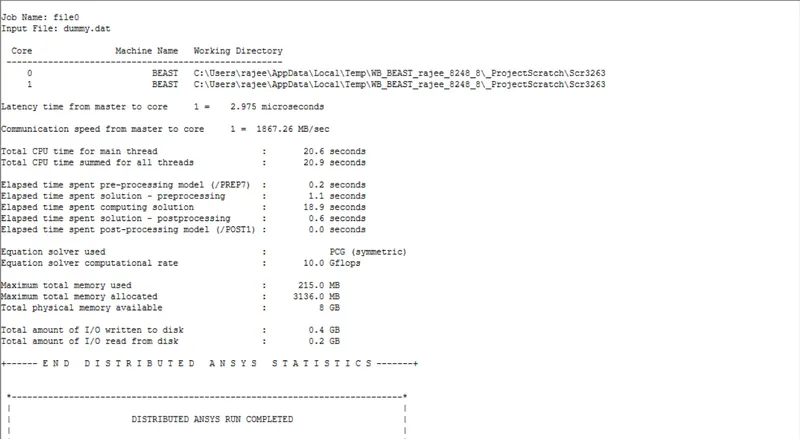
For the second case, the runtime for the simulation is 18.9 seconds, which is much lesser than the earlier case.
While viewing the solution the scale is chosen as true scale (1.0)
Post-processing :
Case (1) Stress distribution : We can see the results of stress distribution for Von-mises stress.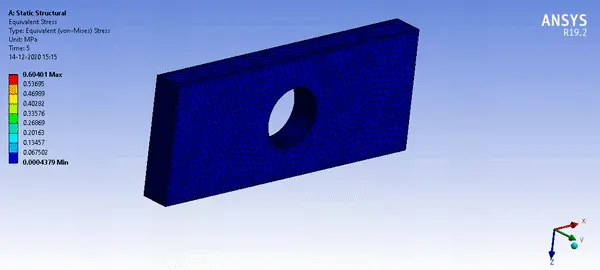
The peak stress is obtained at 0.604 Mpa as we can see above with stress concentration at opposite ends of the hole in a direction at right angles to the application of force.
Case (2)
The results of Von-Mises stress for case 2 are as given below.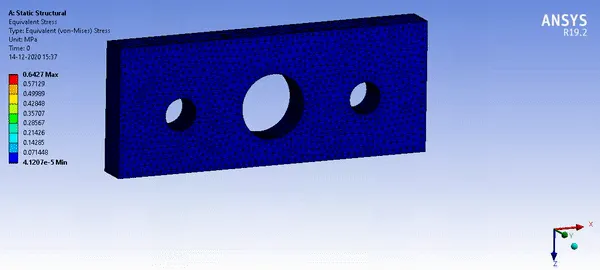
As we can see the maximum stress obtained is 0.6427 Mpa obtained at the central hole. This is slightly higher than the earlier case, and accounts for a 6.4% increase in the peak stress obtained.
Total deformation :
Case (1)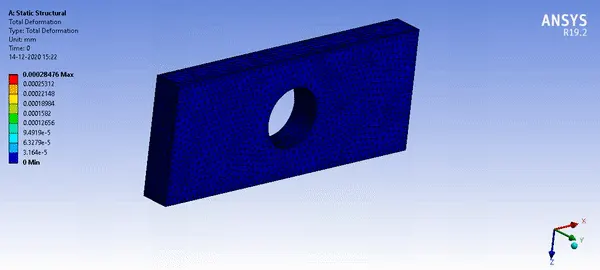
Next we can see that the total deformation develops in a way such that maximum deformation occurs at the side experiencing the tensile force. A peak deformation of 0.00028mm occurs at the force side of the block as we can see above.
Case (2)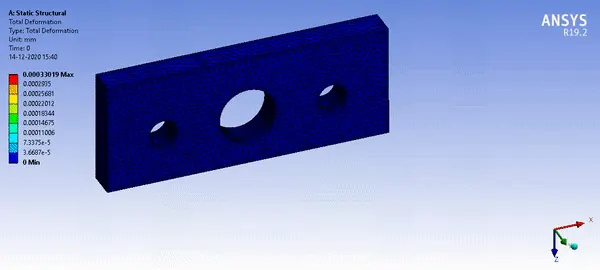
Next we can see that the total deformation develops in a way such that maximum deformation occurs at the side experiencing the tensile force. A peak deformation of 0.00033mm occurs at the force side of the block as we can see above. This corresponds to a 17% increase in total deformation in the model.
Conclusion : We have hence performed the simulation for both the models and arrived at the following conclusions.
1)From a strength perspective, the second one appears to be weaker, for a 4.5% reduction in mass, the total stress increases by 6.4% and the total deformation by 17% which is not a good tradeoff. Hence the first one is more rigid and is a better design. However the first one takes has a higher runtime for the simulation. Hence we can choose the design based on what is important to us.
2) From a manufacturing perspective, the first one is a better choice as obviously it is cheaper as it does not require the drilling of the 2 additional holes and hence is cheaper to produce. Hence if the holes do not serve any real purpose other than aesthetics, the first option is chosen from this standpoint.
Result : Hence both the case studies have been simulated and the conclusions have been drawn.